Copyright
©2013 Baishideng.
World J Meta-Anal. May 26, 2013; 1(1): 47-56
Published online May 26, 2013. doi: 10.13105/wjma.v1.i1.47
Published online May 26, 2013. doi: 10.13105/wjma.v1.i1.47
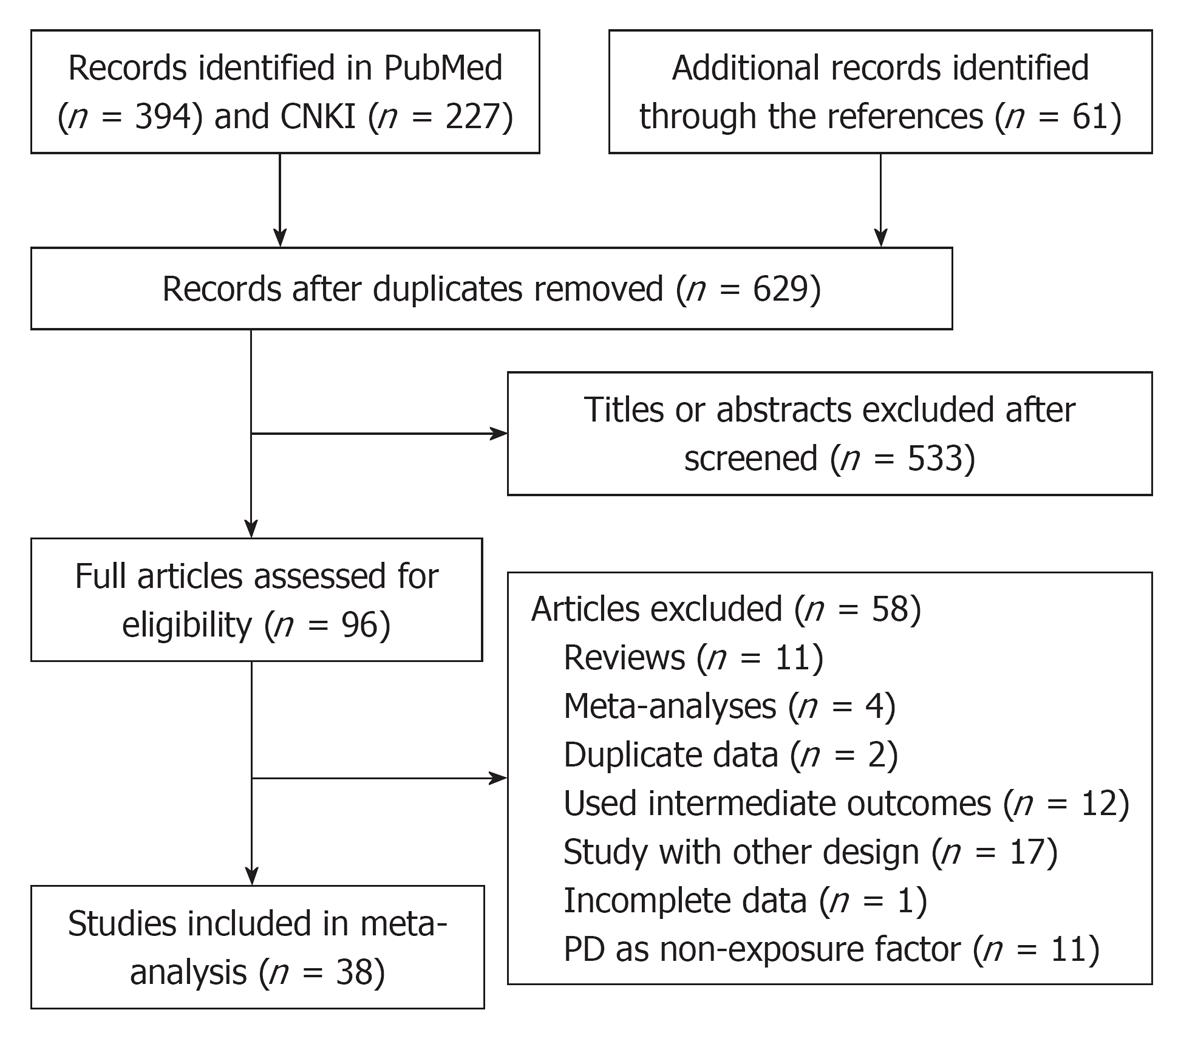
Figure 1 Flow chart of included case-control studies that tested the association between periodontal disease and risk of coronary heart disease.
PD: Periodontal disease; CHD: Coronary heart disease; CNKI: China National Knowledge Infrastructure.
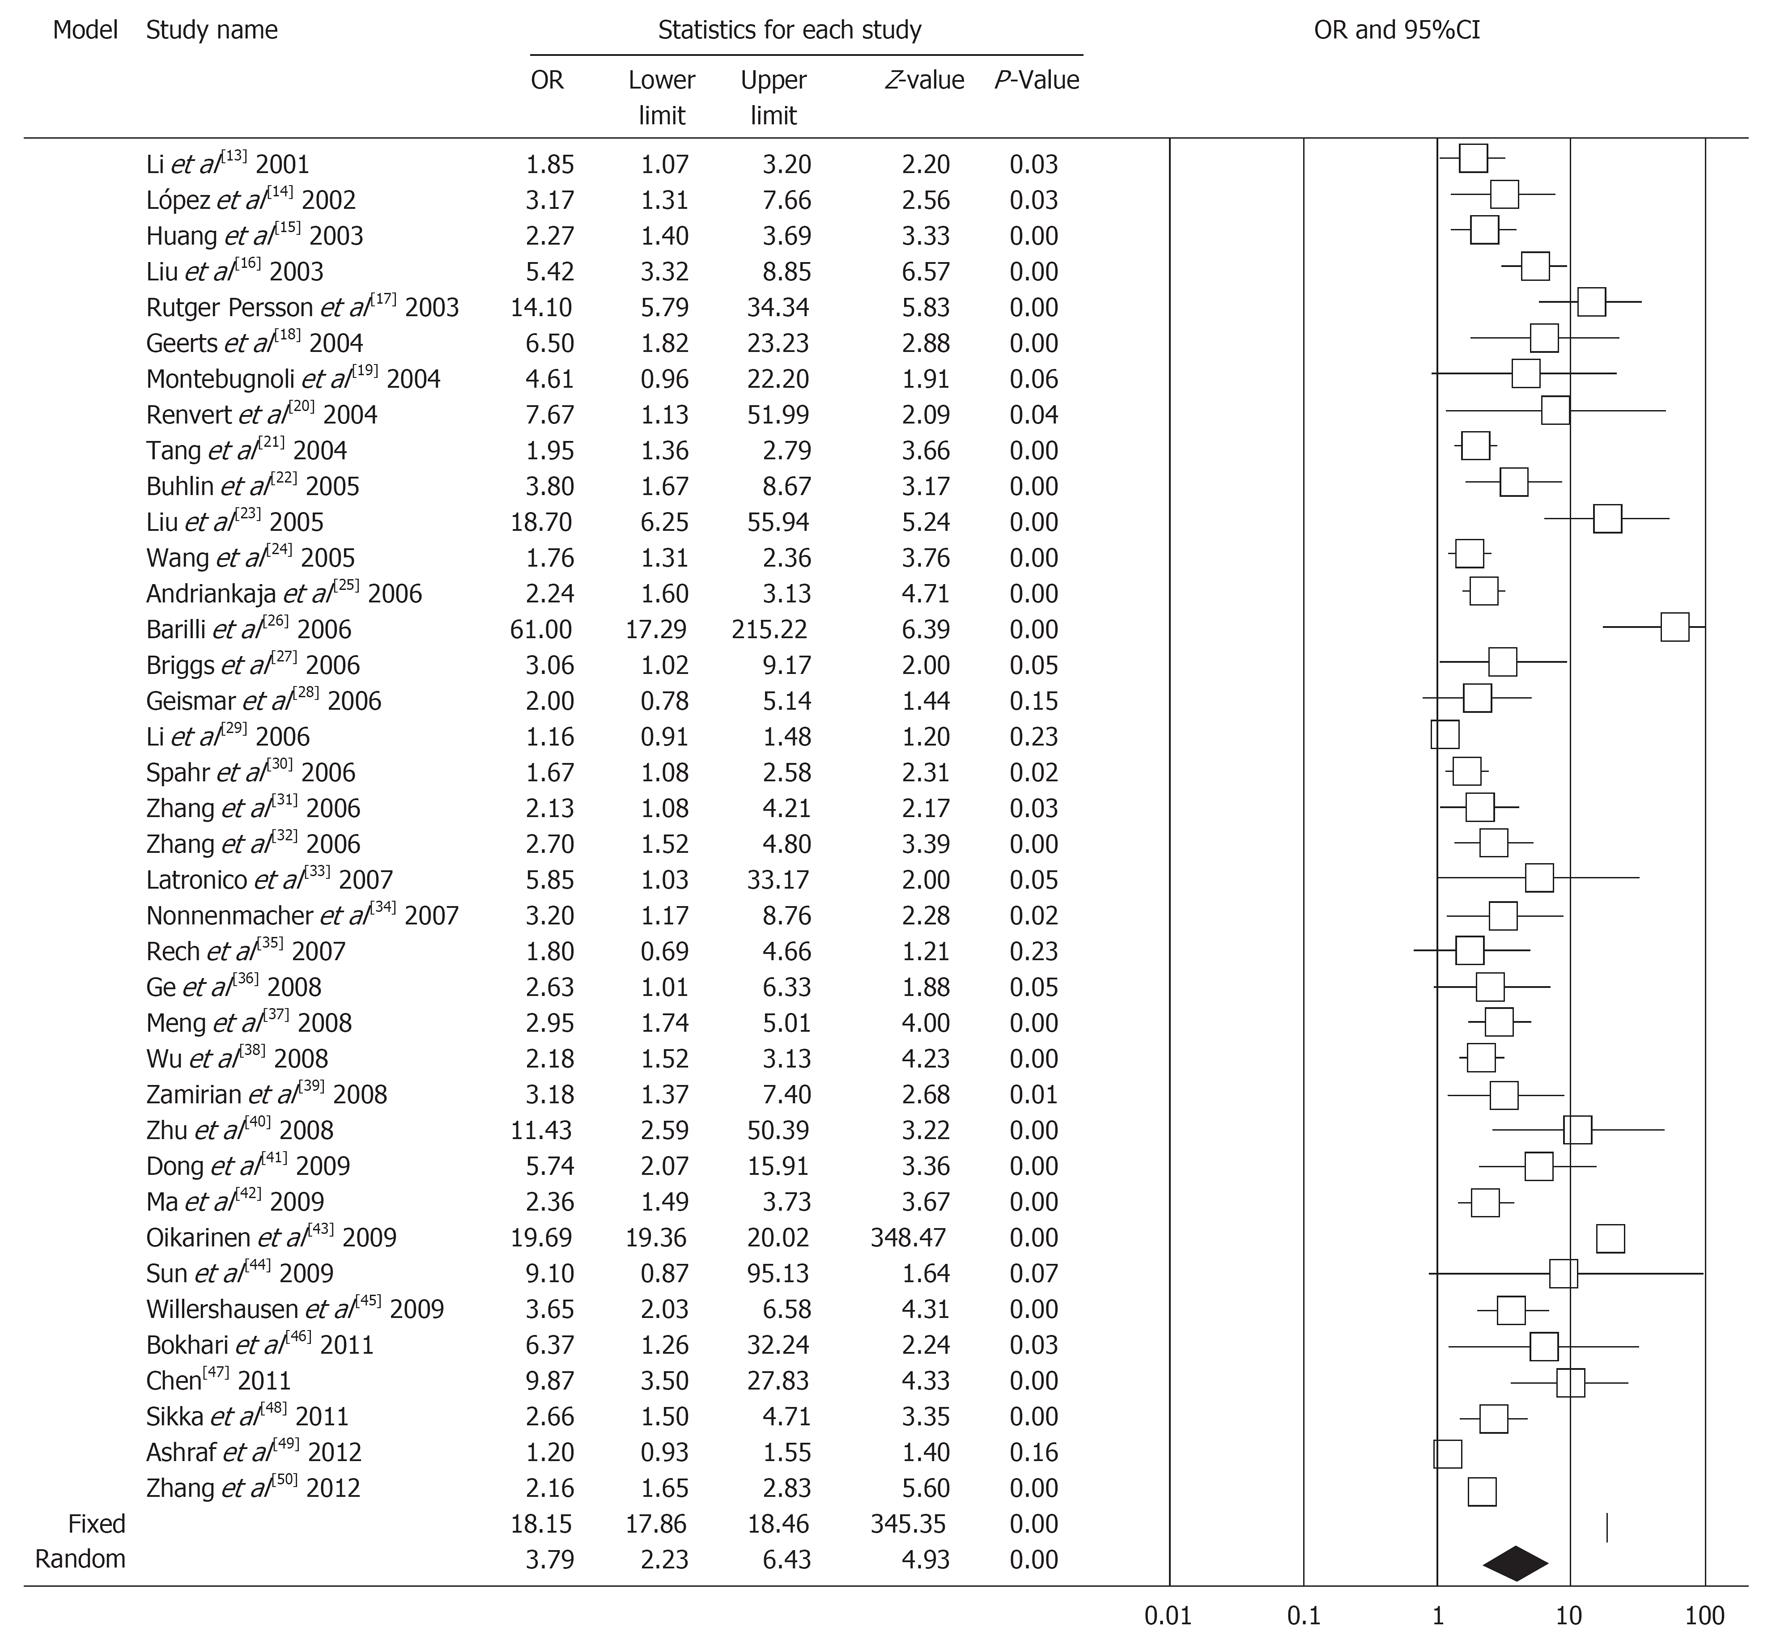
Figure 2 Forest plot of periodontal disease and risk of coronary heart disease, using pooled random-effects model.
The pooled odds ratio is represented by a diamond of standard height, with the width indicating the 95%CI.
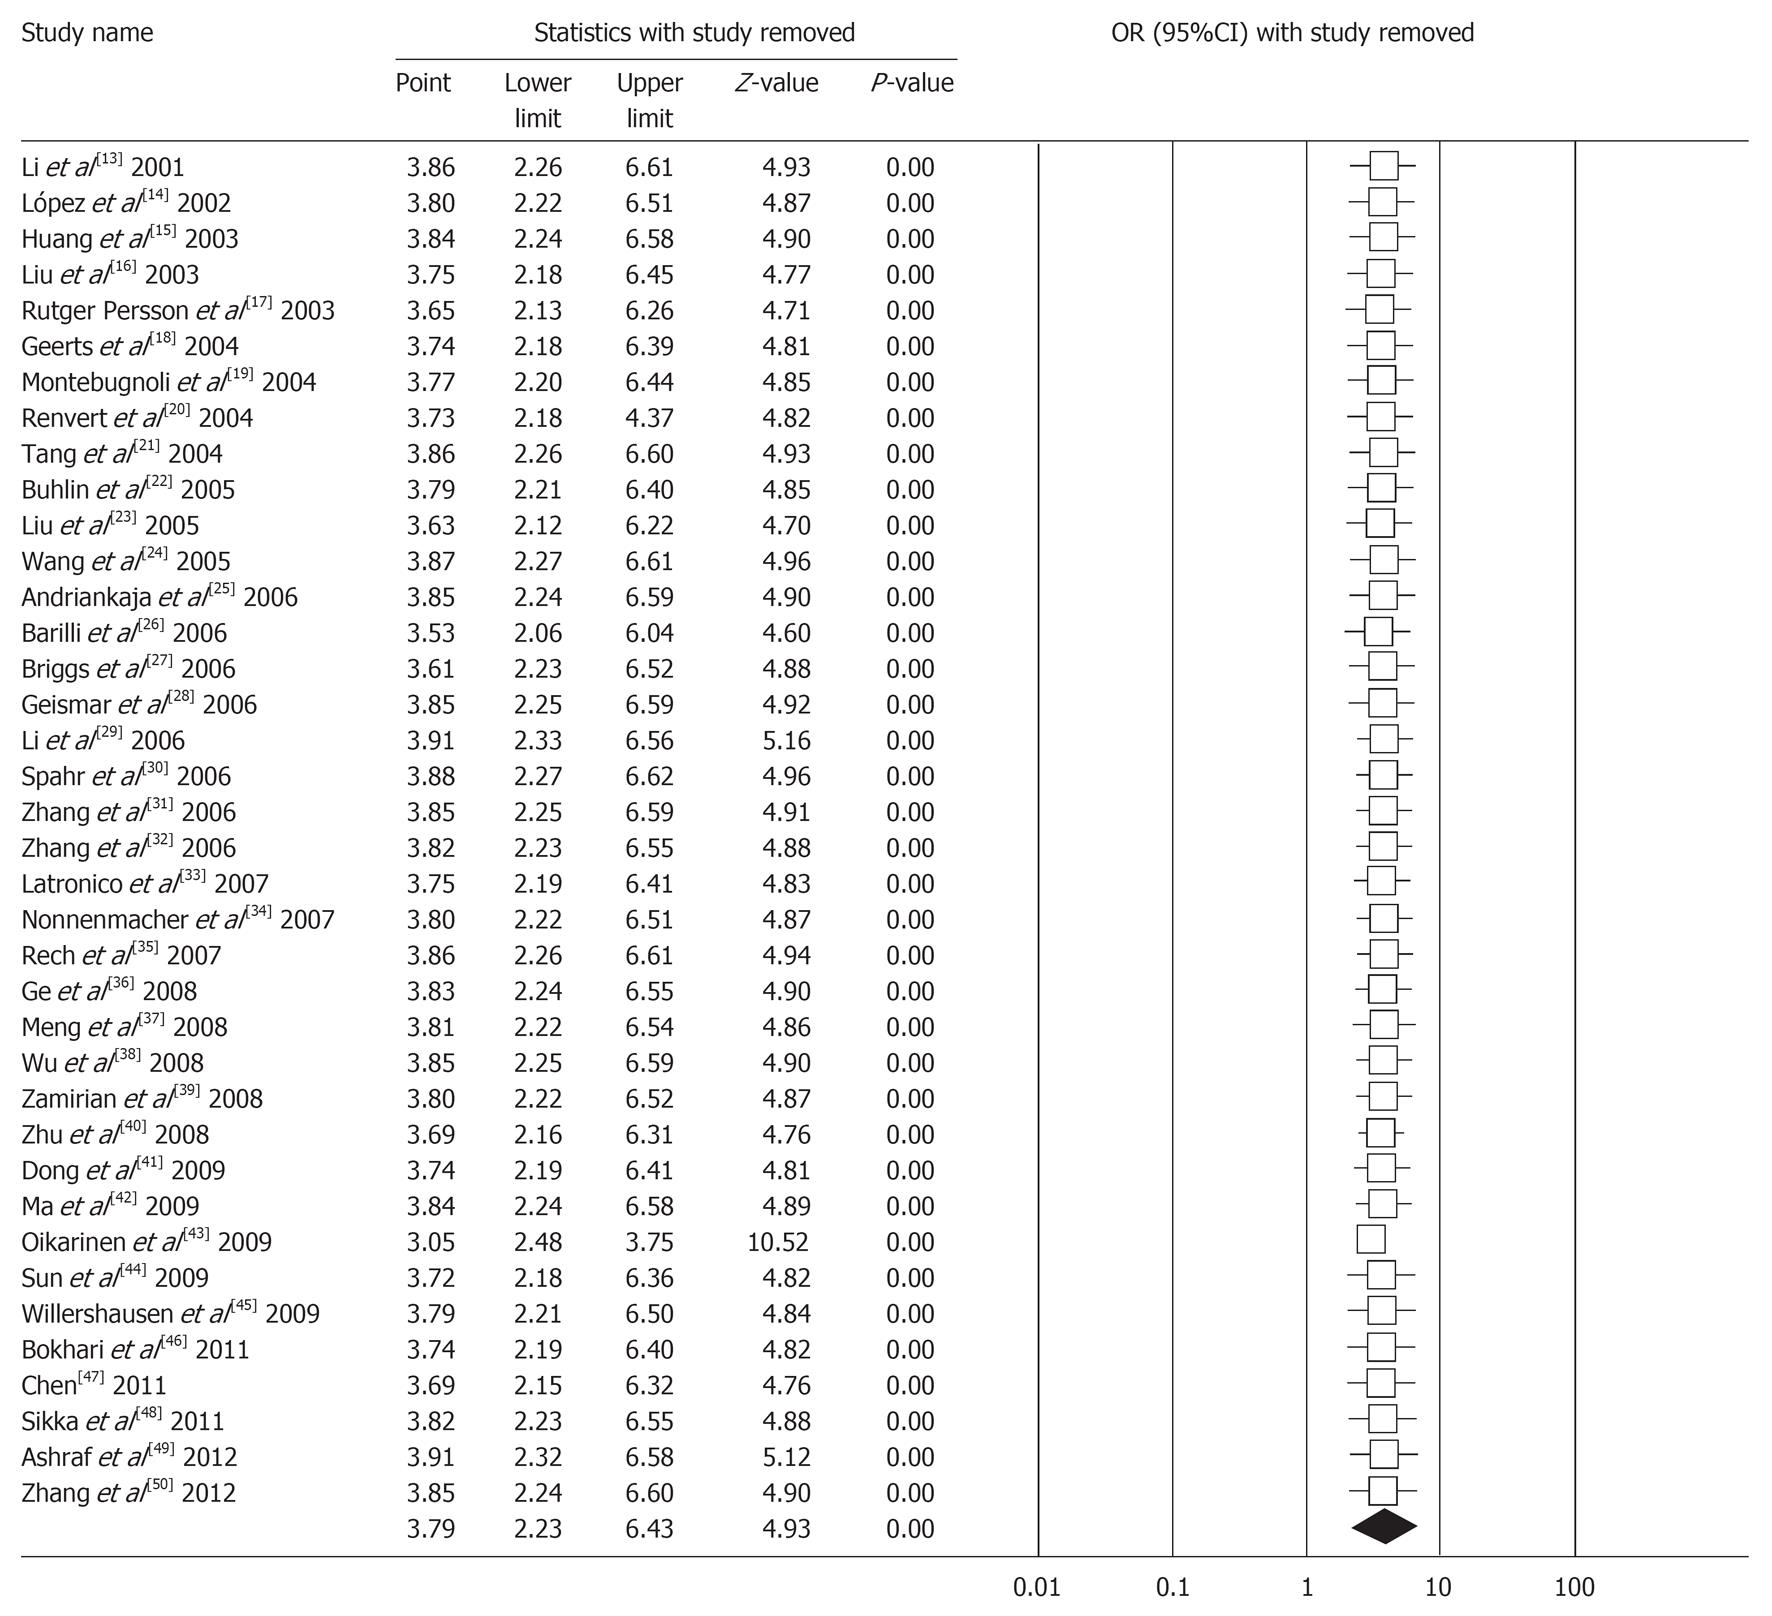
Figure 3 Forest plot of sensitivity analysis by removing each study in each turn.
The pooled odds ratio is represented by a diamond of standard height, with the width indicating the 95%CI.
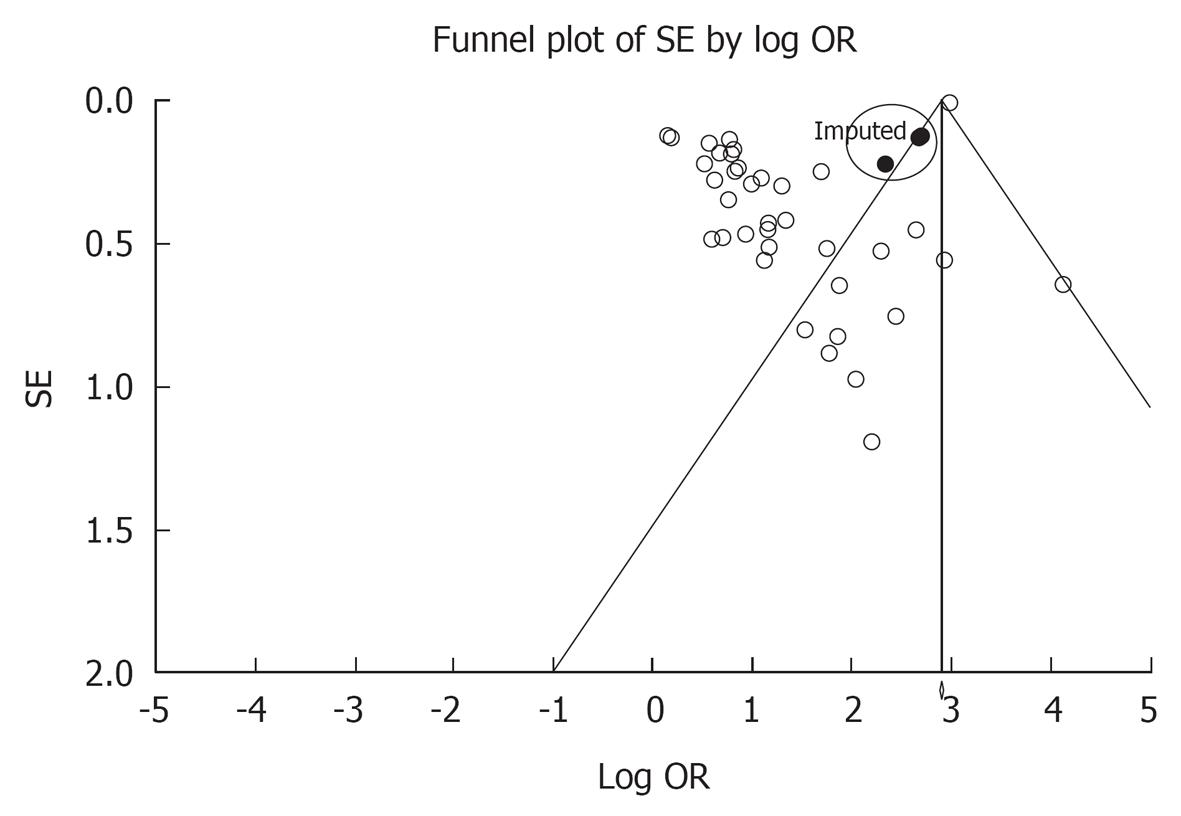
Figure 4 Filled funnel plot with pseudo-95%CIs of the 38 studies.
Log of odds ratio (OR) represents the natural logarithm of the OR of individual studies; Standard error by Log OR represents the standard error in the natural logarithm of the OR of individual studies. A circle in the figure represents a study, while a black spot represents an unpublished study which may exist to negate the results of the meta-analysis.
- Citation: Leng WD, Zeng XT, Chen YJ, Zhan ZQ, Yang Y. Periodontal disease is associated with increased coronary heart disease risk: A meta-analysis based on 38 case-control studies. World J Meta-Anal 2013; 1(1): 47-56
- URL: https://www.wjgnet.com/2308-3840/full/v1/i1/47.htm
- DOI: https://dx.doi.org/10.13105/wjma.v1.i1.47


