Published online Oct 26, 2012. doi: 10.5662/wjm.v2.i5.33
Revised: August 10, 2012
Accepted: September 6, 2012
Published online: October 26, 2012
AIM: To demonstrate the potential of using 2-aminothiazoline-4-carboxylic acid (ATCA) as a novel biomarker/forensic biomarker for cyanide poisoning.
METHODS: A sensitive method was developed and employed for the identification and quantification of ATCA in biological samples, where the sample extraction and clean up were achieved by solid phase extraction (SPE). After optimization of SPE procedures, ATCA was analyzed by high performance liquid chromatography-tandem mass spectrometry. ATCA levels following the administration of different doses of potassium cyanide (KCN) to mice were measured and compared to endogenous ATCA levels in order to study the significance of using ATCA as a biomarker for cyanide poisoning.
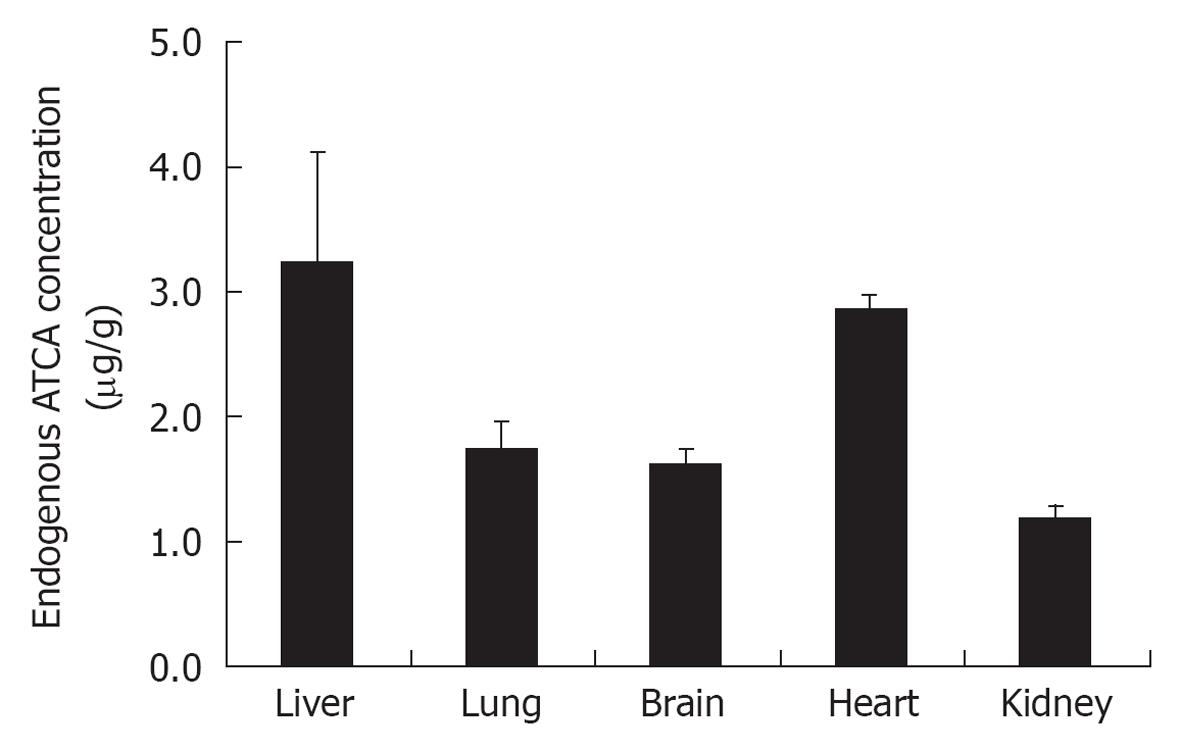
RESULTS: A custom made analytical method was established for a new (mice) model when animals were exposed to increasing KCN doses. The application of this method provided important new information on ATCA as a potential cyanide biomarker. ATCA concentration in mice plasma samples were increased from 189 ± 28 ng/mL (n = 3) to 413 ± 66 ng/mL (n = 3) following a 10 mg/kg body weight dose of KCN introduced subcutaneously. The sensitivity of this analytical method proved to be a tool for measuring endogenous level of ATCA in mice organs as follows: 1.2 ± 0.1 μg/g for kidney samples, 1.6 ± 0.1 μg/g for brain samples, 1.8 ± 0.2 μg/g for lung samples, 2.9 ± 0.1 μg/g for heart samples, and 3.6 ± 0.9 μg/g for liver samples.
CONCLUSION: This finding suggests that ATCA has the potential to serve as a plasma biomarker / forensic biomarker for cyanide poisoning.
- Citation: Yu JC, Martin S, Nasr J, Stafford K, Thompson D, Petrikovics I. LC-MS/MS analysis of 2-aminothiazoline-4-carboxylic acid as a forensic biomarker for cyanide poisoning. World J Methodol 2012; 2(5): 33-41
- URL: https://www.wjgnet.com/2222-0682/full/v2/i5/33.htm
- DOI: https://dx.doi.org/10.5662/wjm.v2.i5.33
Cyanide is a swift and powerful poison. Suicidal, accidental, or homicidal death involving the determination of cyanide is encountered frequently in forensic toxicological practice[1]. In crime scene investigations, two indicators of acute cyanide poisoning are (1) a “bitter almond” odor emanating from the victim; and (2) the presence of pink lividity in the post mortem examination[2]. The presence of cyanide can be confirmed chemically using a colorimetric test at the scene of the crime, followed by a laboratory analysis using a gas chromatography-mass spectrometry (GC-MS). Samples, such as stomach contents and whole blood are usually collected from victims and analyzed in order to confirm the cause of death[3]. The determination of the presence of cyanide involves extraction of hydrogen cyanide (HCN) from samples and the measurement of cyanide from the extracts[4,5]. Biological fluids, such as blood or urine can be taken from the subject for analysis[6-9]. Due to the relatively short half-life of cyanide (from minutes to hours depending on the matrix), direct analysis of cyanide to confirm cyanide poisoning may only be feasible within the first few hours following exposure[10-12].
Natural dietary and pulmonary intake of cyanide from the environment provides a nonzero cyanide background level in the body. Smoke inhalation in fires greatly increases background cyanide levels[13]. The volatility and reactivity of cyanide leaves direct measurements highly susceptible to errors introduced during the sample collection and separation step[14]. An alternative approach that can help to minimize false positive (no cyanide is involved but cyanide is detected) and false negative (cyanide is involved but cyanide is not detected) results, is to detect stable biomarkers of cyanide, rather than cyanide itself. Thiocyanate (SCN-), 2-aminothiazoline-4-carboxylic acid (ATCA), and cyanide-protein adducts in biological fluids and tissues have been reported as alternative biomarkers for cyanide exposure and poisoning[15,16]. SCN- is the major cyanide metabolite found in blood[17]. However, SCN- is also a natural metabolite of non-cyanide mediated pathways and thus is not a good marker for cyanide exposure[18].
Detoxification of cyanide by cystine to produce ATCA in vivo was first reported by Wood and Cooley[19]. They found that the pathway producing ATCA represents approximately 20% of cyanide metabolism, that the quantity of ATCA produced is directly proportional to the amount of cyanide metabolized, and that harvested ATCA is stable for months in the freezer[20]. Therefore, ATCA has been considered a promising candidate as a chemically stable biomarker for cyanide poisoning. More details of human metabolism of cyanide and detection of its biomarkers can be found in a recent review published by Logue et al[21]. Aside from the -cyanide mediated pathway, there are currently no other known pathway for endogenous ATCA production in the human body.
There are numerous analytical techniques to determine cyanide[22] and thiocyanate[23] or both[24,25] in biological samples, but only a few techniques are available to measure ATCA. Quantitative analysis of ATCA begins with extraction from biological samples followed by derivatization to produce a sample that is suitable for quantitative analysis with liquid chromatography or gas chromatography. Cation exchange solid-phase extraction (SPE) columns and individual pre-treatment steps for the extraction and analysis of ATCA from biological samples have been reported[26,27]. Derivatization steps were needed in those studies due to the use of either fluorometric detection or gas chromatography. Molecularly imprinted stir bar sorption extraction (MISBSE) of ATCA was reported by Jackson et al[28]. The MISBSE technique enables the selective extraction of ATCA from urine samples followed by direct detection of ATCA (without derivatization) by a tandem mass spectrometer. This technique may in the future provide rapid analytical method for the direct detection of ATCA for forensic urine analysis, but at the moment, MISBSE is not competitive with standard SPE methods due to the low binding capacities and sample recoveries.
The purpose of this study was to determine the optimal conditions for the quantification of ATCA in various biological fluids and organs using SPE, and high performance liquid chromatography coupled to tandem mass spectrometry (LC-MS/MS). Conditions associated with SPE sample loading, washing and final elution, were studied and refined. The effect of ATCA signal fluctuations arising from electrospray ionization (ESI) suppression was minimized by using a structural analogue of ATCA (2-aminothiazole-4-carboxylic acid, ATZA) as an internal standard. Similar LC-MS/MS analysis was previously reported and employed for different purposes with different experimental setups on different animal (rat) models[29,30]: Determining ATCA levels in plasma and various organs after a constant dose of cyanide exposure [4 mg/kg potassium cyanide (KCN)] indicated that the plasma ATCA level following cyanide exposure was not significantly elevated from the endogenous ATCA level. This suggested that ATCA might not be a good biomarker for cyanide intoxication[29]; however, this study also demonstrated that ATCA is a valuable forensic biomarker, since the ATCA level significantly increased in certain organs after a constant dose (4 mg/kg) of KCN administration. To determine how long ATCA persists in the circulation, ATCA was injected to the bloodstream, and samples were taken at periodic time intervals, and analyzed by the LC-MS/MS method[30]. Results suggested that ATCA is a chemically stable metabolite, suitable as a forensic biomarker. This study also compared the two sample preparation methods of SPE and MISBSE suggesting the priority of SPE over MISBSE. Present studies are reporting ATCA levels after exposing mice to higher, increasing (6, 6, 8 and 10 mg/kg) KCN doses. Exogenously elevated levels of ATCA were compared to endogenous levels of ATCA present in the biological fluids and organs prior to challenge. This new method can be extended to future toxicokinetic studies of ATCA in other animal models in order to confirm the significance of using ATCA as a biomarker from different biological matrices for human cyanide poisoning.
All animal procedures were conducted in accordance with the guidelines in The Guide for the Care and Use of Laboratory Animals (National Academic Press, 1996). The research facility was accredited by AAALAC (American Association for the Assessment and Accreditation of Laboratory Animal Care, International) and this animal study was approved by the IACUC (Institutional Animal Care and Use Committee) at Sam Houston State University.
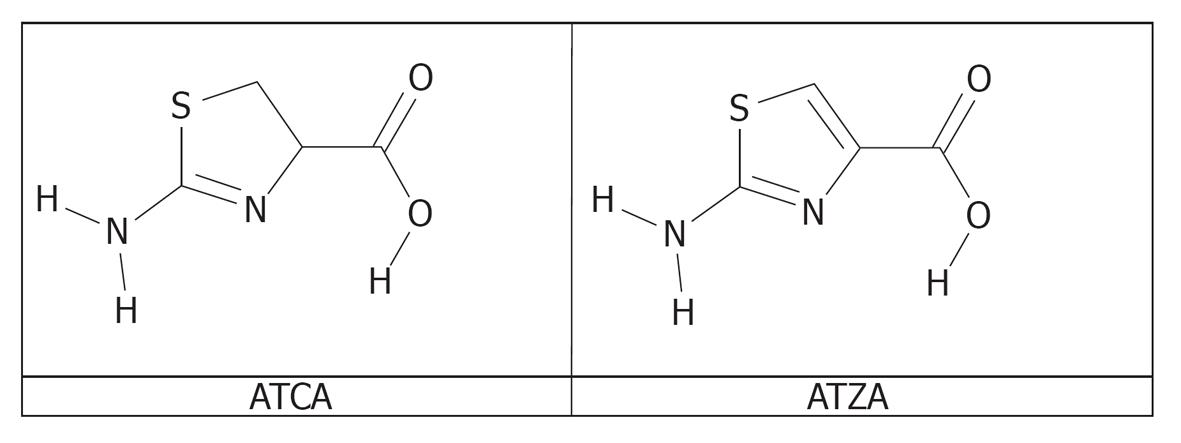
Trifluoroacetic acid (TFA) was obtained from EMD Chemicals (Gibbstown, NJ, USA) and used to prepare 0.5% (v/v) TFA in methanol (0.5% TFA/MeOH) as the mobile phase. All solvents were at least HPLC grade. ATCA was obtained from Chem-Impex International (Wood Dale, IL, USA). ATZA was obtained from Synthonix (Wake Forest, NC, USA). Molecular structures of ATCA and ATZA are shown in Figure 1. KCN was purchased from Sigma-Aldrich (St. Louis, MO, USA). For in vivo study, serial dilutions were used to produce aqueous KCN solutions of systematically decreasing concentration. KCN is acutely toxic. Ingestion of KCN or exposure to its salt or its aqueous solutions by eye or skin contact can be fatal. Exposure to as little as 50-150 mg can cause immediate collapse and death. Working with cyanide-containing compounds requires special care. Oasis® mixed mode cation exchange (MCX) cartridges were obtained from Waters Corporation (Milford, MA, USA). A 5% aqueous ammonium hydroxide/methanol solution (v/v) was prepared and used as the final elution solution. Mice liver, plasma, brain, heart and lung were used to evaluate the applicability of the analytical method.
SPE was performed in a glass manifold equipped with Teflon needle inserts and evacuated with a Buchi V-700 Vacuum Pump (Mallinckrodt Baker, Inc., Phillipsburg, NJ, USA). Homogenization was performed with ready-to-use Precellys® lysing kits on a Precellys-24 tissue homogenizer (Bertin Technologies, France). Pierce Reacti-Therm II Heating Module was used to stream air to borosilicate glass disposable culture tubes (13 mm × 100 mm). A Shimadzu liquid chromatograph (LC-20AT, Shimadzu, Columbia, MD) coupled to a tandem mass spectrometer (API 3200 ESI/MS/MS system, Applied Biosystems, Foster City, CA) was employed for the LC-MS/MS separation, detection and quantification of ATCA. A Luna CN column (3 micron, 100 mm × 2 mm; Phenomenx; Torrance, CA, USA) was used for the separation. A 5 μL aliquot was injected to the LC-MS/MS by an auto-sampler, and eluted isocratically at a 0.5 mL/min flow rate. Transition ions of ATCA in positive mode (m/z 147 → 101) and ATZA (m/z 145 → 127) were generated using ESI and detected using multiple reaction monitoring (MRM). The source dependent conditions of ESI were as follows: ionspray voltage: +5500 V, temperature: 450 °C, curtain gas 350 kPa, gas 1: 480 kPa, gas 2: 140 kPa. The compound dependent parameters were as follows: collision gas (CAD): 41 kPa, collision cell entrance potential: 14 V, and the collision cell exit potential: 4 V. More instrumentation details of ESI/MS/MS for the detection of ATCA can be found in our previous report[24].
ATCA standard solutions with concentrations ranging from 0-1000 ng/mL, were prepared from 330 μg/mL ATCA standard stock solutions by serial dilutions. Internal standard, 10 μg/mL of ATZA, was prepared from a 282 μg/mL ATZA standard stock solution. Both ATCA and ATZA stock solutions were prepared in mobile phase (0.5% TFA/MeOH). To construct the calibration curve, 200 μL of each standard solution was mixed with 20 μL of internal standard. The standard solutions were sonicated for 5 min and then dried. They were reconstituted with 220 μL of mobile phase, and then a 5 μL aliquot was injected to the LC-MS/MS for analysis.
To prepare the ATCA spiked samples, known amounts of ATCA were air-dried in the test tubes. Two hundred microliters of sample (urine, plasma, and organ homogenates) and 20 μL internal standard were added to these test tubes and diluted with 800 μL of 10 mmol/L phosphate buffer (pH 7.4) before SPE. For organ homogenization, samples were thawed, chopped, and weighed in homogenizing tubes, and 0.1 mol/L HCl was added to make a concentration of 0.6 g organ mass/mL in each tube. The samples were homogenized for 3 min, 1 min per cycle with 3 cycles at 6000 r/min using the Precellys 24. Homogenized mixtures of samples were diluted with 10 mmol/L phosphate buffer (pH 7.4) to obtain a final concentration of organ homogenate of 0.15 g organ mass/mL buffer. The solution was vortexed and centrifuged for 10 min at 10 000 r/min and the supernatant was removed for the SPE extraction.
SPE was performed on a MCX cartridge prior to the LC-MS/MS analysis. The MCX cartridges were conditioned with 1 mL of methanol and then 1 mL of distilled water. The samples (1 mL total) were loaded into the conditioned cartridges employing vacuum as needed. After sample loading, the cartridges were washed with 1 mL of 0.1 mol/L HCl first and then washed with 1 mL methanol. The cartridges were finally eluted with 1 mL of 5% (v/v) ammonium hydroxide in methanol (5% NH4OH/MeOH). Note that teflon inserts and waste test tubes were replaced with clean inserts and glass test tubes before final elution. The eluates were air dried first, then reconstituted with 220 μL of mobile phase. After sonication for 5 min, the reconstituted samples were transferred to LC-MS/MS auto-sampler vials containing 250 μL glass inserts.
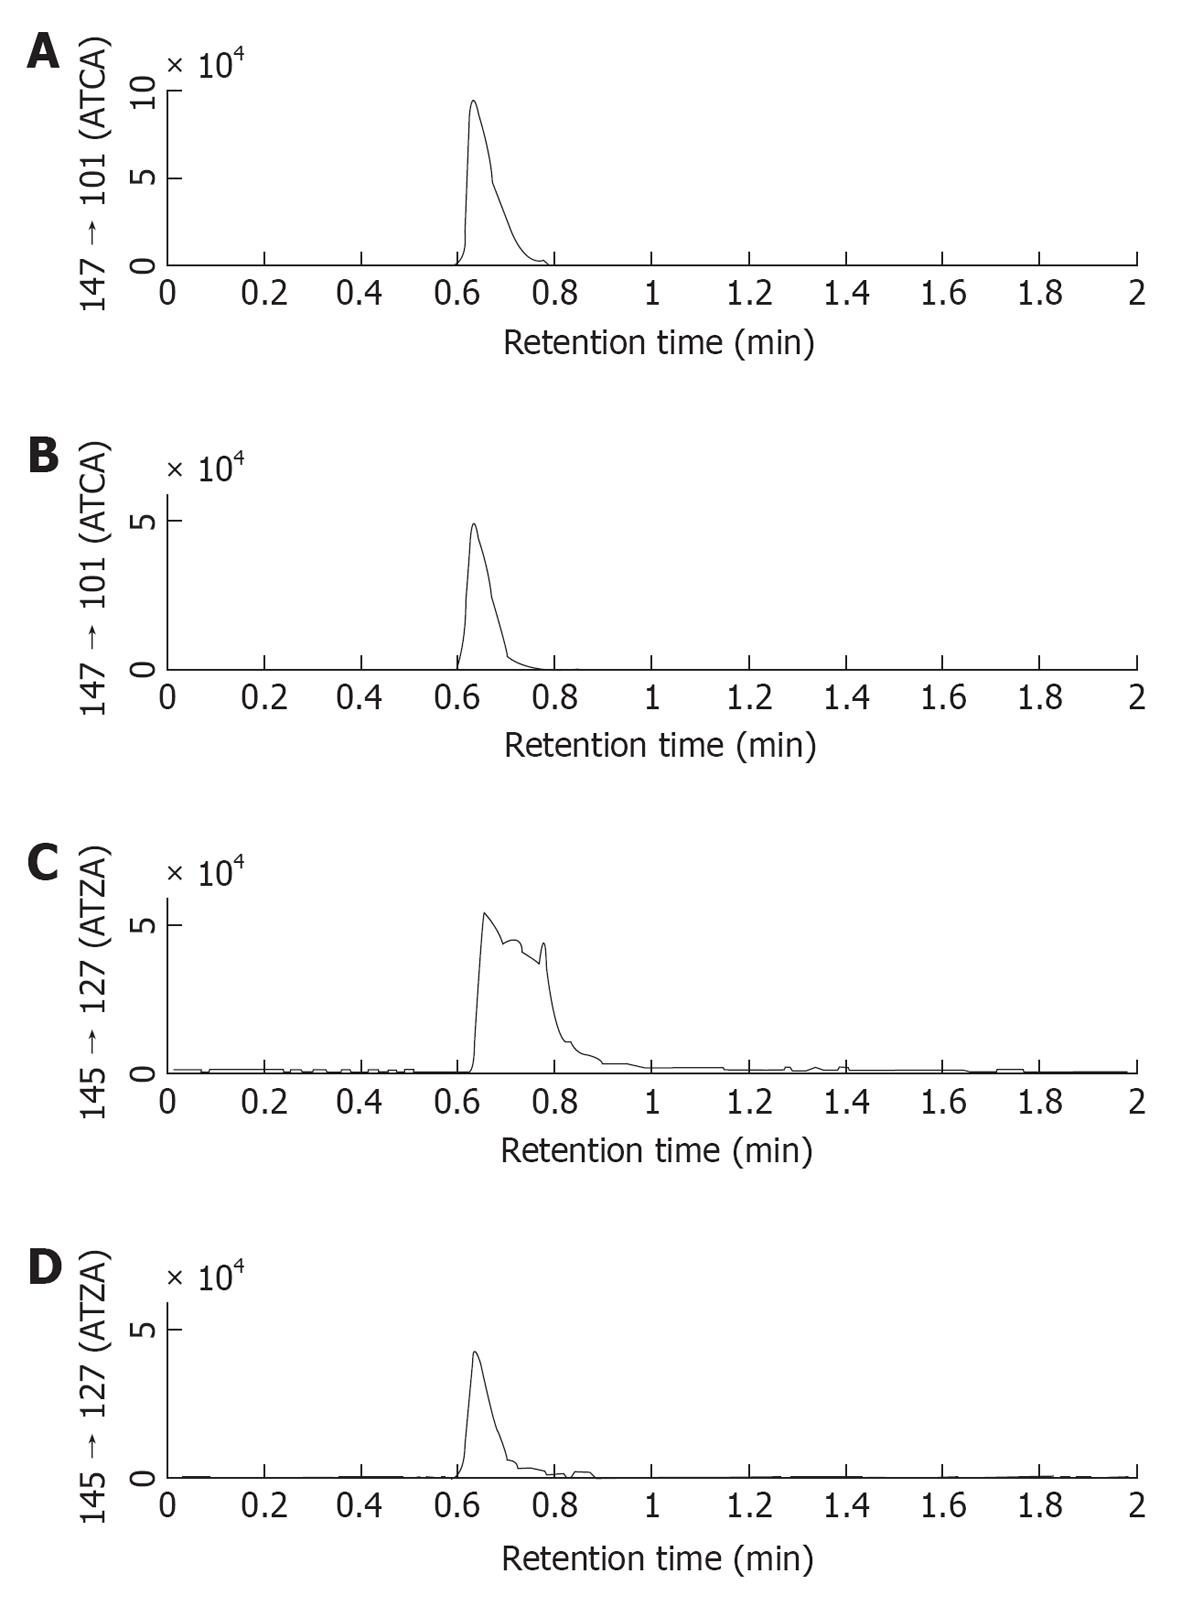
Detection of ATCA by ESI/MS/MS has been previously reported[24]. Briefly, 5 μg/mL ATCA and ATZA standard solutions were infused separately to the MS/MS at 10 μL/min in order to observe certain compound-dependent parameters for MRM transitions. When ATCA standard solution was infused to the ESI source under optimal ESI conditions, the ATCA molecular ion at m/z 147, corresponding to (M + H)+, was detected. ATCA product ion at m/z 101 was the most abundant product ion after the optimization of compound-dependent parameters of MRM, hence the transition ion m/z 147 → 101 was selected for identification and quantification of ATCA. Similarly, ATZA molecular ion at m/z 145 was generated under the optimal ESI condition. Its product ion m/z 127 was the most abundant product ions after optimization of compound-dependent parameters of MRM, hence the transition ion m/z 145 → 127 was selected for detection of the internal standard (ATZA). An internal standard corrected calibration curve was constructed by plotting the ratio of ATCA peak area to ATZA peak area vs ATCA concentrations. External calibration curves were also constructed to examine matrix and ionization suppression effects.
The quality control (QC) sample was a 200 μL, 500 ng/mL ATCA standard with 20 μL of 10 μg/mL internal standard. The QC was analyzed prior to each sample to ensure that the instrumentation was working properly. Additionally, a blank sample (mobile phase with the internal standard only) was also run between samples to check for any potential carryovers. The peak shape for the QC was confirmed first, and any deviation from the known peak shape was interpreted as an instrumentation error. Conditioning of separation column and tubing was performed when high backpressure was noticed. Once QC was passed, samples were analyzed using LC-MS/MS with good confidence.
For animal studies, Charles River provided the 18 CD-1 mice, all of which were male and weighed about 20 g. The experimental animals were housed in room temperature and light controlled rooms (22 °C ± 2 °C, 12-h light/dark cycle). They were furnished with water and Teklad Rodent Diet (W) 8604 (Teklad HSD, Inc., WI, USA) ad libitum. Plasma and organs (brain, lungs, heart, liver, and kidneys) of the mice were collected after subcutaneous injection of KCN at different doses. Three sublethal doses (6, 8, and 10 mg/kg-body-weight) were applied (3 mice/dose), and the injection solutions were prepared from a 4-mg/mL KCN stock solution. Each dose was injected with a 25 G × 1 1/2 needle. Mice were terminated 15 min after cyanide exposure and organs were collected. Blood samples were taken by pipetting. The average volume of blood obtained was 0.25 mL, and the blood was placed into Eppendorf tubes with 40 L of 10 mg/mL of heparin in water. The Eppendorf tubes were vortexed, then centrifuged at 13 000 r/min for 5 min. Plasma was collected, and organs were collected as well. Plasma and organ samples were placed into plastic 3 mL tubes and stored in the freezer until they were thawed for analysis. Note that longer exposure of cyanide was not performed in this work. The toxicokinetic and half-life studies of ATCA are separate research projects in our laboratory.
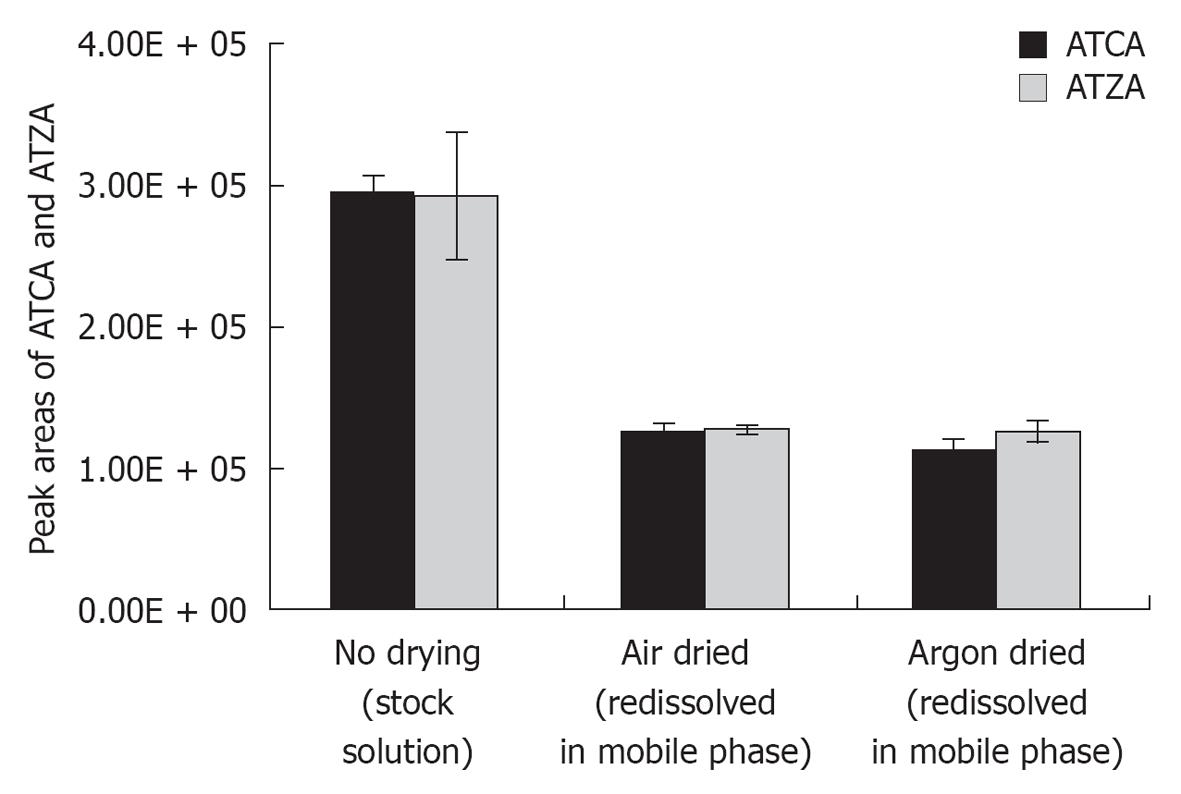
The use of MCX cartridge for the extraction of ATCA from acidified urine samples has been previously reported[20]. The ACTA was eluted from the cartridge by concentrated NH4OH and converted to the trimethylsilyl derivative through reaction with 30% N-methyl-N-trimethylsilyltrifluoroacetamide (MSTFA) in hexane before analysis by GC-MS. In our work, we have modified and optimized the SPE procedure for LC-MS/MS instrumentation. ATCA was detected by ESI-MS/MS without chemical derivatization. The impact of solvent composition on ATCA and ATZA ionization at the ESI source was tested first. Solvents of three ATCA standard solutions (500 ng/mL with ATZA) were evaporated by air (air-dry) and argon (argon-dry) gases and the residues were reconstituted with a freshly prepared mobile phase. As shown in Figure 2, the MS/MS signals of ATCA and ATZA were compared with and without air drying. The decreased peak areas of ATCA and ATZA in reconstituted solutions following air or argon drying were attributed to the variations of TFA concentration in the stock solution and the freshly prepared mobile phase. Solvent evaporation with argon had similar effects to that with air. Therefore, the use of an inert gas was not needed for solvent evaporation. It has been known that TFA is a good organic additive in chromatography, but a poor reagent for MS/MS signal. In our method development, it was unfortunate that we could not avoid the need for evaporation of samples and calibration standards.
Concentrated (28%-30%) aqueous ammonium hydroxide, 5% NH4OH/MeOH, 0.5% TFA/MeOH, and 1% TFA/MeOH were next tested to determine the optimal final elution solution. Triplicates of each solution were performed through SPE. The optimal final elution solution was also determined by using 2 different elution volumes (1 and 2 mL) of 5% NH4OH/MeOH. Triplicates of each volume were performed through SPE. These solutions yielded similar recoveries of ATCA and ATZA. Because 5% NH4OH/MeOH was relative easy to air-dry, it was selected as the final elution solution for SPE.
Various SPE procedures were tested and the best recovery was obtained using the procedure below. Mice plasma or homogenized mice organs (200 μL) mixed with 20 μL of internal standard (ATZA) was diluted with 800 μL of 10 mmol/L phosphate buffer (pH 7.4). ATCA and ATZA were then extracted with and eluted from the MCX cartridge. The samples eluted by the final elution solution were dried under gentle air streams. After air drying, the residues were reconstituted with 220 μL of mobile phase. Standard solutions and samples were then sonicated for 5 min prior to LC-MS/MS analysis. With a volatile organic additive, such as TFA, in the mobile phase, it is challenging to keep its concentration a constant from batch to batch. A precise control of TFA concentration, or elimination of matrix components could be investigated for method development, however, it is more applicable to just use an internal standard for calibration in our method.
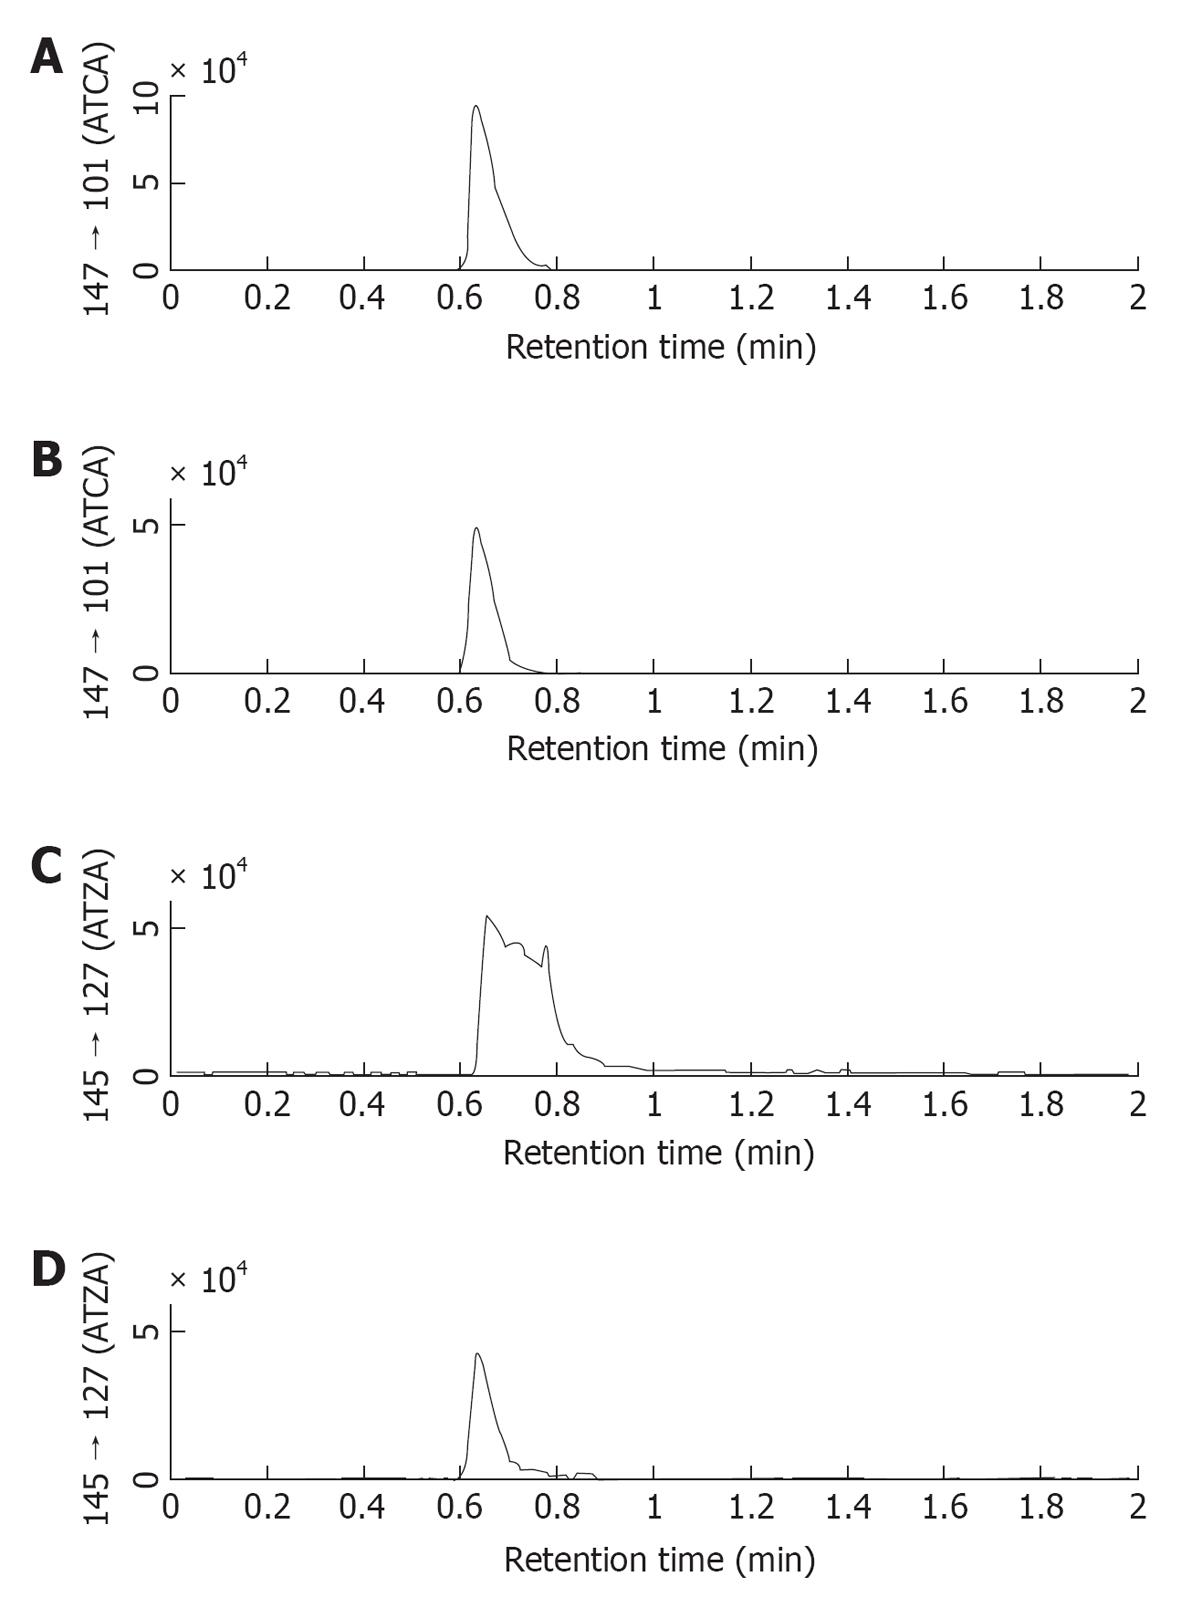
In our previous studies using ESI/MS/MS, a mobile phase of 0.5% acetic acid gave a good yield of the MRM transition ion of m/z 147 → 101 for the detection of ATCA. This mobile phase was found to be a poor eluent of ATZA. However, as shown in Figure 3, when TFA was added to the mobile phase a good sharp ATZA peak was detected. This result suggested that TFA was a more effective ion-paring reagent than acetic acid during the chromatography. Therefore, 0.5% TFA/MeOH was selected as the mobile phase, replacing the 0.5% acetic acid/MeOH mobile phase used in our prior work.
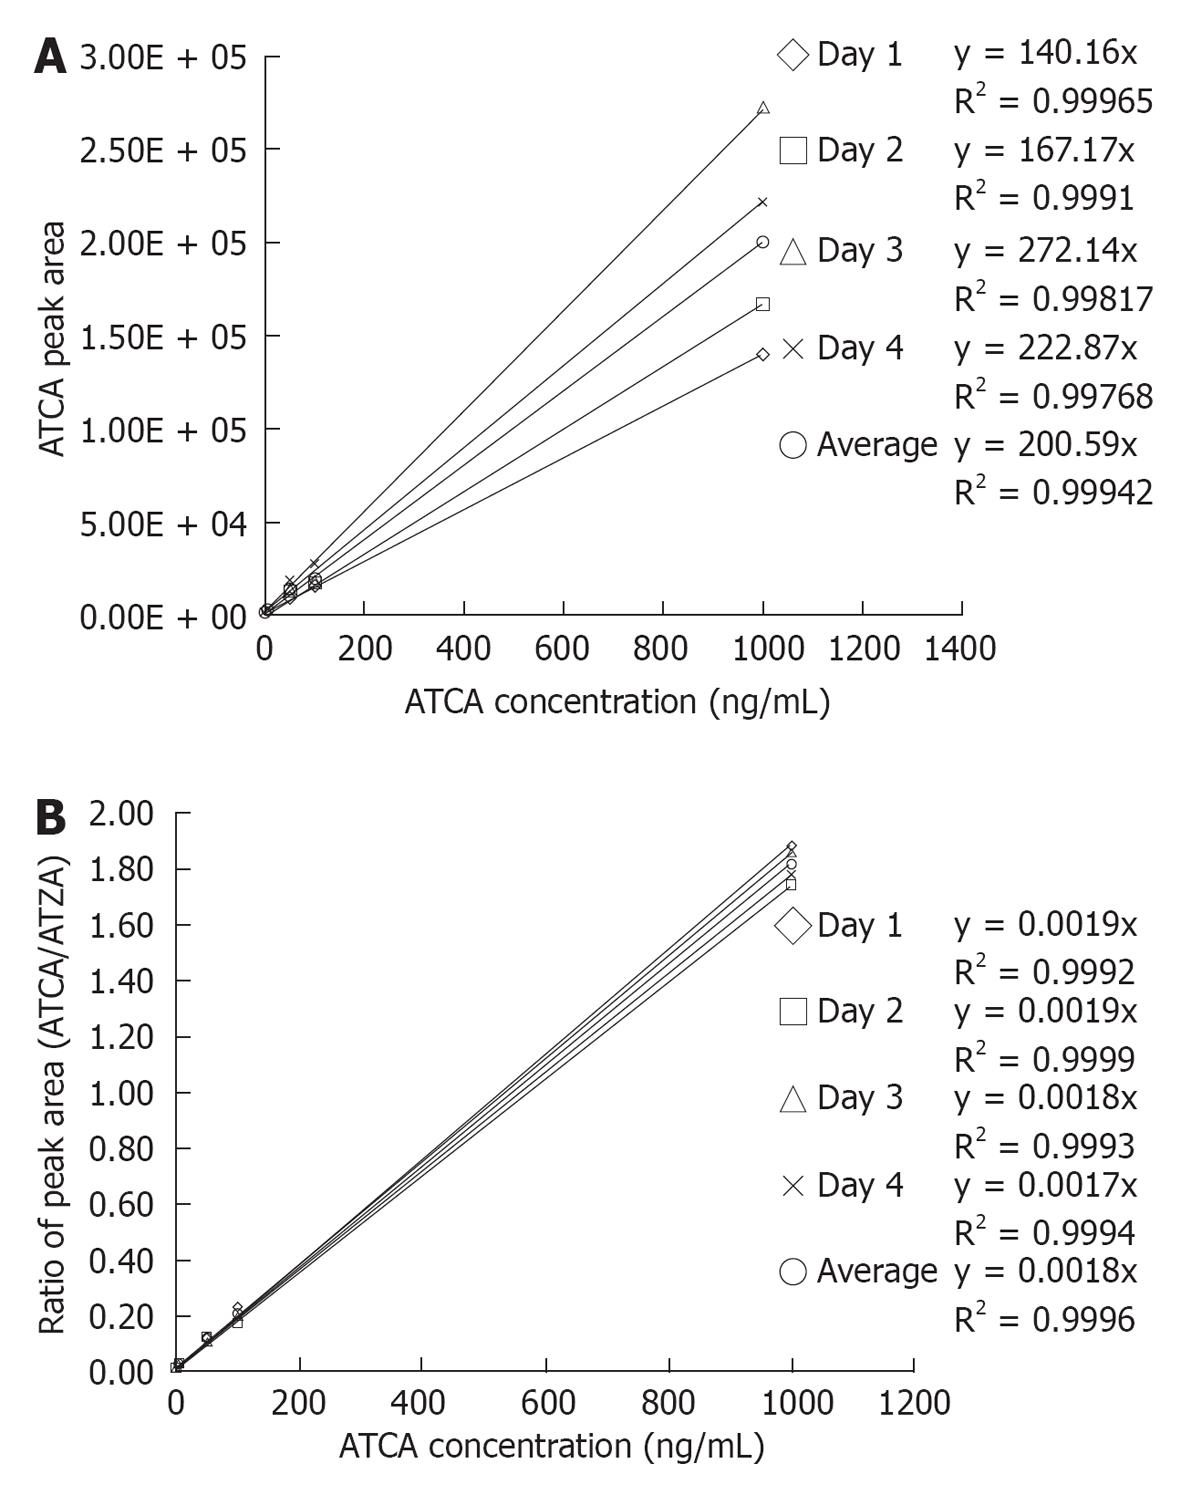
ATCA standard solutions, ranging from 0-1000 ng/mL, were analyzed by LC-MS/MS with ATZA as the internal standard. External calibration curves were first constructed to show the relationship between ATCA concentrations and integrated ATCA LC-MS/MS peak areas. As shown in Figure 4A, the external standard calibration curves showed good linearity over the tested ATCA concentration range with average R2 = 0.999 in a between-days experiment. The dashed lines show linear regression of calibration in each day. These linear regression lines yielded an average calibration equation y = (199 ± 60) × (n = 4), relative standard deviation (RSD) of calibration slopes = 30%. The high %RSD of the slopes indicated a typical ionization suppression effect of ESI. Internal calibration curves were next prepared by plotting the ratio of ATCA to ATZA peak areas vs ATCA concentration. As shown in Figure 4B, ratioing to the internal standard peak area improved the reproducibility of the calibration curves. The dashed lines show calibration curves obtained on different days. These internal standard compensated calibration curves yielded an average calibration equation y = (0.018 ± 0.00007) × (n = 4), RSD = 4%. The decrease of the RSD from 30% (external calibration) to 4% (internal standard calibration) demonstrated that the internal standard, ATZA, enables effective compensation for ionization suppression and matrix effects, and substantially improves the precision with which ATCA can be quantified. The effect of matrix components on MS/MS signals could be determined by comparing the slope of internal standard calibration curves and matrix added calibration curves (e.g., standard addition). However, it could not eliminate matrix effect for the different biological samples. Note that the use of an internal standard does not mean that the method is interference-free.
The endogenous levels of ATCA in different organs of mice were measured using the SPE procedure and LC-MS/MS conditions outlined above. As showed in Figure 5, triplicate samples from healthy mice showed endogenous ATCA concentrations as follows: 1.2 ± 0.1 μg/g for kidney samples, 1.6 ± 0.1 μg/g for brain samples, 1.8 ± 0.2 μg/g for lung samples, 2.9 ± 0.1 μg/g for heart samples, and 3.6 ± 0.9 μg/g for liver samples.
Mobile phase composition can impact the ESI ionization of analytes[27], The responses of positive ions may be varied by changes in the electrolyte concentration, pH, and percent methanol at the ESI ionization source[28]. TFA has been known to suppress ESI[29]. For quantitative analysis, it is important to air-dry the ATCA and ATZA standard solutions so that all solutions can be redissolved in the same batch of mobile phase (freshly prepare mobile phase is recommended). This ensures reproducible ionization suppression from sample to sample. We found that this solvent reconstitution step increased the precision of signal from replicate standard solutions (%RSD of ATCA < 5% and %RSD of ATZA < 8%). Note that the ring in ATCA may open under heat and basic conditions[24]. The evaporation of solvent should be performed under ambient temperature.
Matrix components in the sample could interfere with the detection of ATCA in LC-MS/MS. SPE was used to isolate the analyte from the complex sample matrices. However, while SPE generally reduces matrix effects, it can under certain circumstances also magnify matrix effects[30], an internal standard was needed to minimize this deviation of calibration. Ideally, the choice of deuterated ATCA as the internal standard has advantages chromatographically and can eliminate limitations of chemical properties in separation and detection method development. Unfortunately, deuterated ATCA was not commercially available. From this work, ATZA was selected and proved as to be a good alternative as an internal standard. The use of ATZA as an internal standard successfully mitigated ESI suppression and matrix effects. Note that the difference in the chemical properties of ATZA and ATCA has been shown by the difference in MS/MS fragmentation and the pKa of ATZA is different from ATCA which potentially can be a problem in separation. Fortunately, ATZA co-eluted with ATCA in our method. This is advantageous because ion suppression at the ESI source should then be more uniform for both ATCA and ATZA.
It has been suggested in an in vivo study that the reaction of an oxidized disulfide with a sulfur nucleophile from glutathione could be a plausible origin for ATCA[27]. It is likely that endogenous levels of ATCA in each organ reflect the availability of disulfide and the concentration of glutathione in those organs. Thus, endogenous ATCA levels may give an estimate of each organs capacity for cyanide detoxification. For example, the preliminary results showing lower endogenous ATCA levels in the kidneys and brain may be consistent with lower capacity for cyanide detoxification in those organs. This lower capacity might be partially due to the absence of rhodanese enzymes in the kidney and brain.
Mice received three different sublethal doses (6, 8 and 10 mg/kg) of cyanide subcutaneously (3 mice/doses) and were terminated 15 min after cyanide exposure. As shown in Figure 6, a significant correlation of cyanide dose vs ATCA concentration in plasma samples was observed. ATCA concentration in mice plasma samples was increased from 189 ± 28 ng/mL (n = 3 mice) for endogenous level (0 mg/kg body weight dose of KCN) to 413 ± 66 ng/mL (n = 3 mice) for 10 mg/kg body weight dose of KCN. This data represents the first in vivo study of ATCA concentration levels in plasma samples following administration of various controlled doses of cyanide.
Present in vivo study confirmed that ATCA concentration in plasma samples rose significantly with increasing cyanide dose levels in a mice model. This finding suggests that ATCA has the potential to serve as a plasma biomarker for cyanide poisoning. However, further studies for detecting ATCA in biological samples after exposure of various cyanide doses employing various animal models are necessary to reaffirm that ATCA can be established as a suitable cyanide biomarker/forensic biomarker. Since it is previously proven that ATCA is a persistent, chemically stable metabolite[26], more over the formed ATCA concentrations are significantly enhanced in certain organs even after a lower dose of cyanide exposure[25], This method can also be readily applied to actual autopsy materials. It is important to develop this method into a complementary method to extend the detection time window for cyanide poisoning cases, especially for those autopsy samples that have been stored for a long time where cyanide poisoning was suspected. These studies are superior to the previously reported studies with a different animal model (rat)[25]: While the previous experimental setup of applying one single KCN dose (4 mg/kg) did not prove the potential importance of ATCA as a plasma biomarker, present studies confirm that at higher doses of KCN administration the plasma ATCA level is proportionally and significantly increasing with increasing KCN doses. Earlier studies indicated enhanced ATCA levels in the urine and plasma[20] of smokers vs non smokers, suggesting that ATCA has potential as a cyanide biomarker in human. Different cyanide metabolite baseline levels in smokers vs nonsmokers is a factor that needs to be accounted for in all methods, including ATCA based methods, that seek to differentiate between chronic and acute cyanide exposure. Present findings provide additional evidence to the study by Logue et al[20], for the potential of ATCA to serve as a plasma biomarker in mice and human, and confirm its utility as a forensic biomarker what was in agreement with the earlier investigation using a single lower dose of KCN in a rat model[29].
Research supports from the Faculty Enhancement Grants for Research from Sam Houston State University was greatly appreciated.
Cyanide (CN) is a potent poison, which people can be exposed to in a various ways. It has been widely recognized as a chemical warfare agent and is considered as a possible terrorist threat. It is important to determine cyanide itself, or its metabolites in biological matrices for forensic, clinical, military, research and veterinary purposes. Common metabolites of cyanide include 2-aminothiazoline-4-carboxylic acid (ATCA) and thiocyanate. ATCA is formed when cyanide reacts with cysteine.
One of the most important frontiers in cyanide research to develop effective methods for forensic analysis of cyanide exposure, based on detection of CN and its metabolites (thiocyanate and ATCA). Since cyanide is present in the body in the volatile hydrogen cyanide form, it is rapidly depleted from blood (generally within the first 20 min of exposure) following exposure, leaving only metabolites as biomarkers. Important criteria for a biomarker include chemical stability, and biomarker concentration levels in biological matrices that correlate with the doses of exposure. Earlier studies proved that ATCA is a chemically stable cyanide metabolite. The present study indicates the cyanide dose vs ATCA blood concentration relation, therefore it suggests that ATCA might be established as a cyanide biomarker.
Logue et al (2005 and 2010) reported an analytical method gas chromatography-mass spectrometry (GC-MS) to measure ATCA in biological matrices. Since ATCA is not volatile, it requires derivatization prior to measurement via GC-MS. The authors’ HPLC method detects ATCA without derivatization. For sample preparation before injecting the samples to the chromatography column (LC-MS/MS method), Yu’s group at SHSU (Jackson et al, 2010) developed and reported a molecularly imprinted polymer stir bar sorption extraction for determining ATCA. The present study employs the LC-MS/MS method, and it compared the two extraction methods (molecularly imprinted polymer stir bar sorption extraction and SPE), and for further analysis it recommends the SPE extraction when determining ATCA by LC/MS/MS method. Employing the HPLC/MS/MS method with SPE extraction, this study confirmed that ATCA can serve as a biomarker for cyanide exposure. In an earlier study (Petrikovics et al, 2011) reported the possible establishment of ATCA as a forensic biomarker, since the post exposure concentration of ATCA in organs was significantly elevated relative to the endogenous ATCA levels, especially in the liver in a rat model. Further investigations are being pursuedto determine endogenous cysteine/cystine levels in order to understand why certain organs contain more ATCA after a constant cyanide exposure. When a constant low dose of cyanide was administered, the plasma ATCA level was not elevated relative to the endogenous plasma ATCA. In the present study the authors report that when cyanide doses are higher, and more representative of acute exposure, the ATCA levels in the plasma are correlated with CN dose in a mice model.
This results of this study suggest that ATCA holds promise as a forensic biomarker for CN.
The results of this study show that ATCA levels are strongly correlated with CN exposure levels in a mice model. These results are consistent with the hypothesis that ATCA might serve as a biomarker/ forensic biomarker for cyanide exposure.
Peer reviewers: Srinivas Ayyadevara, Research Health Scientist, Research Assistant Professor, Department of Geriatrics, University of Arkansas for Medical Sciences, John L McClellan Medical Center, 4300 West 7th Street, Research 151, Room GB 103, Little Rock, AR 72205, United States; Murielle Mimeault, PhD, Department of Biochemistry and Molecular Biology, College of Medicine, Eppley Cancer Institute, 7052 DRC, University of Nebraska Medical Center, 985870 Nebraska Medical Center, Omaha, NE 68198-5870, United States; Soledad Rubio, Professor, Department of Analytical Chemistry, University of Córdoba, Edificio Anexo Marie Curie, Campus de Rabanales, 14017, Córdoba, Spain
S- Editor Jiang L L- Editor A E- Editor Zheng XM
| 1. | Lv J, Zhang Z, Li J, Luo L. A micro-chemiluminescence determination of cyanide in whole blood. Forensic Sci Int. 2005;148:15-19. |
| 2. | Gill JR, Marker E, Stajic M. Suicide by cyanide: 17 deaths. J Forensic Sci. 2004;49:826-828. |
| 3. | Laforge M, Buneaux F, Houeto P, Bourgeois F, Bourdon R, Levillain P. A rapid spectrophotometric blood cyanide determination applicable to emergency toxicology. J Anal Toxicol. 1994;18:173-175. |
| 4. | Darr RW, Capson TL, Hileman FD. Determination of hydrogen cyanide in blood using gas chromatography with alkali thermionic detection. Anal Chem. 1980;52:1379-1381. |
| 5. | Shiono H, Maseda C, Akane A, Matsubara K. Rapid and sensitive quantitation of cyanide in blood and its application to fire victims. Am J Forensic Med Pathol. 1991;12:50-53. |
| 6. | McAuley F, Reive DS. Rapid quantitation of cyanide in blood by gas chromatography. J Anal Toxicol. 1983;7:213-215. |
| 7. | Ishii A, Seno H, Watanabe-Suzuki K, Suzuki O, Kumazawa T. Determination of cyanide in whole blood by capillary gas chromatography with cryogenic oven trapping. Anal Chem. 1998;70:4873-4876. |
| 8. | Zamecnik J, Tam J. Cyanide in blood by gas chromatography with NP detector and acetonitrile as internal standard. Application on air accident fire victims. J Anal Toxicol. 1987;11:47-48. |
| 9. | Lundquist P, Rammer L, Sörbo B. The role of hydrogen cyanide and carbon monoxide in fire casualties: a prospective study. Forensic Sci Int. 1989;43:9-14. |
| 10. | Moriya F, Hashimoto Y. Potential for error when assessing blood cyanide concentrations in fire victims. J Forensic Sci. 2001;46:1421-1425. |
| 11. | Calafat AM, Stanfill SB. Rapid quantitation of cyanide in whole blood by automated headspace gas chromatography. J Chromatogr B Analyt Technol Biomed Life Sci. 2002;772:131-137. |
| 12. | McAllister JL, Roby RJ, Levine B, Purser D. Stability of cyanide in cadavers and in postmortem stored tissue specimens: a review. J Anal Toxicol. 2008;32:612-620. |
| 13. | Noguchi TT, Eng JJ, Klatt EC. Significance of cyanide in medicolegal investigations involving fires. Am J Forensic Med Pathol. 1988;9:304-309. |
| 14. | Lindsay AE, Greenbaum AR, O’Hare D. Analytical techniques for cyanide in blood and published blood cyanide concentrations from healthy subjects and fire victims. Anal Chim Acta. 2004;511:185-195. |
| 15. | Baskin SI, Petrikovics I, Platoff GE, Rockwood GA, Logue BA. Spectrophotometric Analysis of the Cyanide Metabolite 2-Aminothiazoline-4-Carboxylic Acid (ATCA). Toxicol Mech Methods. 2006;16:339-345. |
| 16. | Isom GE, Baskin SI. Enzymes involved in cyanide metabolism. Comprehensive Toxicology. New York: Elsevier Science 1997; 477-488. |
| 17. | Baskin SI, Petrikovics I, Kurche JS, Nicholson JD, Logue BA, Maliner BJ, Rockwood GA. Insights on Cyanide Toxicity and Methods of Treatment. Pharmacological perspectives of toxic chemicals and their antidotes. New Delhi: Narosa Publishing House 2004; 105-146. |
| 18. | Ballantyne B. In vitro production of cyanide in normal human blood and the influence of thiocyanate and storage temperature. Clin Toxicol. 1977;11:173-193. |
| 19. | WOOD JL, COOLEY SL. Detoxication of cyanide by cystine. J Biol Chem. 1956;218:449-457. |
| 20. | Logue BA, Kirschten NP, Petrikovics I, Moser MA, Rockwood GA, Baskin SI. Determination of the cyanide metabolite 2-aminothiazoline-4-carboxylic acid in urine and plasma by gas chromatography-mass spectrometry. J Chromatogr B Analyt Technol Biomed Life Sci. 2005;819:237-244. |
| 21. | Logue BA, Hinkens DM, Baskin SI, Rockwood GA. The analysis of cyanide and its breakdown products in biological samples. Crit Rev Anal Chem. 2010;40:122-147. |
| 22. | Youso SL, Rockwood GA, Lee JP, Logue BA. Determination of cyanide exposure by gas chromatography-mass spectrometry analysis of cyanide-exposed plasma proteins. Anal Chim Acta. 2010;677:24-28. |
| 23. | Youso SL, Rockwood GA, Logue BA. The analysis of protein-bound thiocyanate in plasma of smokers and non-smokers as a marker of cyanide exposure. J Anal Toxicol. 2012;36:265-269. |
| 24. | Kage S, Nagata T, Kudo K. Determination of cyanide and thiocyanate in blood by gas chromatography and gas chromatography-mass spectrometry. J Chromatogr B Biomed Appl. 1996;675:27-32. |
| 25. | Tsuge K, Kataoka M, Seto Y. Cyanide and thiocyanate levels in blood and saliva of healthy adult volunteers. J Health Sci. 2000;46:343-350. |
| 26. | Bradham LS, Catsimpoolas N, Wood JL. Determination of 2-iminothiazolidine-4-carboxylic acid. Anal Biochem. 1965;11:230-237. |
| 27. | Lundquist P, Kagedal B, Nilsson L, Rosling H. Analysis of the cyanide metabolite 2-aminothiazoline-4-carboxylic acid in urine by high-performance liquid chromatography. Anal Biochem. 1995;228:27-34. |
| 28. | Jackson R, Petrikovics I, Lai EPC, Yu JCC. Molecularly imprinted polymer stir bar sorption extraction and electrospray ionization tandem mass spectrometry for determination of 2-aminothiazoline-4-carboxylic acid as a marker for cyanide exposure in forensic urine analysis. Anal Method. 2010;2:552-557. |
| 29. | Petrikovics I, Thompson DE, Rockwood GA, Logue BA, Martin S, Jayanna P, Yu JCC. Organ-distribution of the metabolite 2-aminothiazoline-4-carboxylic acid in a rat model following cyanide exposure. Biomarkers. 2011;16:686-690. |
| 30. | Petrikovics I, Yu JCC, Thompson DE, Jayanna P, Logue BA, Nasr J, Bhandari , Baskin SI, Rockwood G. Plasma persistence of 2-aminothiazoline-4-carboxylic acid in rat system determined by liquid chromatography tandem mass spectrometry. J Chromatog B. 2012;81-84:891-892. |


