Copyright
©The Author(s) 2017.
World J Methodol. Sep 26, 2017; 7(3): 73-92
Published online Sep 26, 2017. doi: 10.5662/wjm.v7.i3.73
Published online Sep 26, 2017. doi: 10.5662/wjm.v7.i3.73
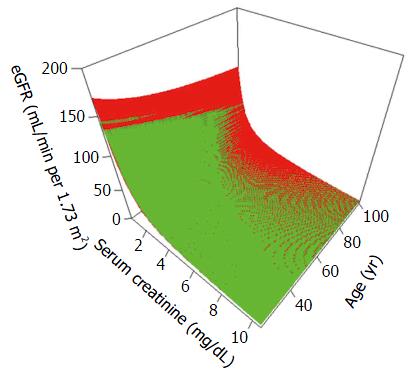
Figure 1 Modification of Diet in Renal Disease[22] and Chronic Kidney Disease Epidemiology Collaboration[23] formulae for estimating glomerular filtration rate fit to variations in serum creatinine (X axis) and age (Y axis) assuming males of Caucasian race.
Note that the CKD-EPI formula yields slightly higher eGFR values with higher serum creatinine values and lower age whereas the MDRD formula leads to significantly higher eGFR values at very low serum creatinine values. MDRD: Modification of Diet in Renal Disease; CKD-EPI: Chronic Kidney Disease Epidemiology Collaboration; eGFR: Estimating glomerular filtration rate.
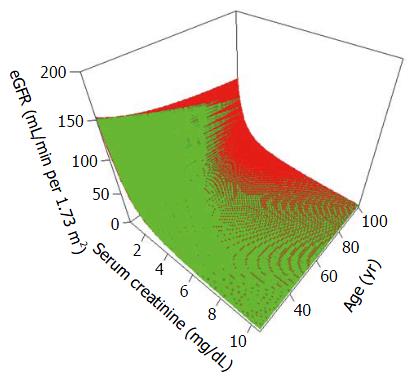
Figure 2 Modification of Diet in Renal Disease[22] and Chronic Kidney Disease Epidemiology Collaboration[23] formulas for estimating glomerular filtration rate fit to variations in serum creatinine (X axis) and age (Y axis) assuming females of Black race.
The CKD-EPI formula yields slightly higher eGFR values with higher serum creatinine values and lower age whereas the MDRD formula leads to significantly higher eGFR values at very low serum creatinine values in this population also. MDRD: Modification of Diet in Renal Disease; CKD-EPI: Chronic Kidney Disease Epidemiology Collaboration; eGFR: Estimating glomerular filtration rate.
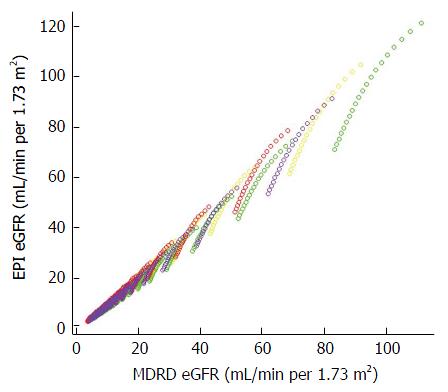
Figure 3 Scatterplot demonstrating close relationships between estimating glomerular filtration rate values calculated by the Chronic Kidney Disease Epidemiology Collaboration formula[23] (Y axis) and the Modification of Diet in Renal Disease formula[22] (X axis).
Different colors are used to indicate the races and genders depicted in this figure: Yellow indicates Caucasian males, Green Black males, Red Caucasian females, and Purple Black females. A straight line to fit the data minimizes the least square error with an intercept of -1.03 and a beta coefficient of 1.04 achieving an R2 value of 0.99. MDRD: Modification of Diet in Renal Disease; CKD-EPI: Chronic Kidney Disease Epidemiology Collaboration; eGFR: Estimating glomerular filtration rate.
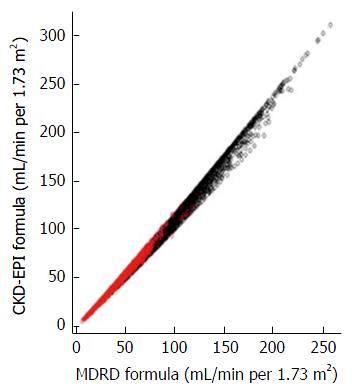
Figure 4 Comparison of estimating glomerular filtration rate values obtained by the Modification of Diet in Renal Disease[22] and Chronic Kidney Disease Epidemiology Collaboration[23] formulas in subjects who were enrolled in the NHANES study (Serum creatinine > 0.
4 mg/dL, age ≥ 20 year) and the MDRD study[22]. MDRD: Modification of Diet in Renal Disease; CKD-EPI: Chronic Kidney Disease Epidemiology Collaboration.
- Citation: Alaini A, Malhotra D, Rondon-Berrios H, Argyropoulos CP, Khitan ZJ, Raj DSC, Rohrscheib M, Shapiro JI, Tzamaloukas AH. Establishing the presence or absence of chronic kidney disease: Uses and limitations of formulas estimating the glomerular filtration rate. World J Methodol 2017; 7(3): 73-92
- URL: https://www.wjgnet.com/2222-0682/full/v7/i3/73.htm
- DOI: https://dx.doi.org/10.5662/wjm.v7.i3.73


