Copyright
©The Author(s) 2016.
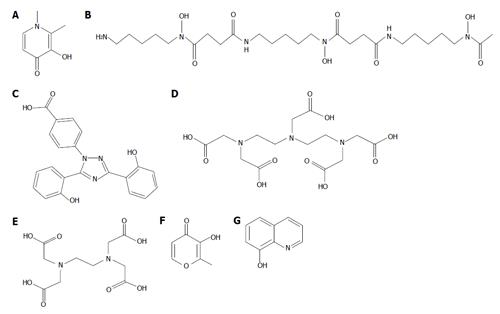
Figure 1 The chemical structure of the iron chelating drugs.
L1 (A), DF (B) and DFRA (C) are currently used for the treatment of thalassaemia and other transfusional iron loading conditions. DTPA (D) and EDTA (E) have been previously used for the treatment of iron overload but are now used for the detoxification of toxic metals and in particular EDTA in alternative medicine. The maltol (F) iron complex is used for increasing iron absorption and 8-hydroxyquinoline (G) is a lipophilic chelator used for radiolabeling in diagnostic medicine and for experimental purposes. L1: Deferiprone; DF: Deferoxamine; DFRA: Deferasirox; DTPA: Diethylenetriaminepentaacetic acid; EDTA: Ethylenediaminetetraacetic acid.
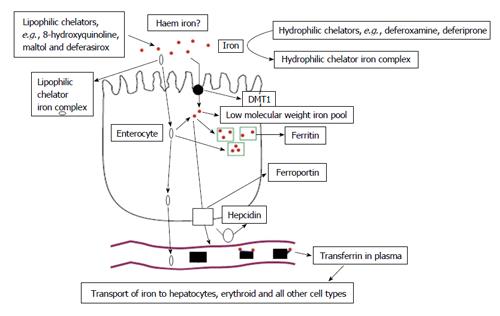
Figure 2 Iron absorption mechanisms at the enterocyte.
Under normal conditions the regulatory pathway of iron absorption at the enterocyte involves the regulatory molecules DMT1, hepcidin, ferroportin and then iron transfer and uptake by transferrin in plasma. A parallel pathway of iron absorption may involve lipophilic dietary chelating molecules like maltol. Different pathway of iron uptake by the enterocyte also exists for haem iron. Adapted from ref. [22]. DMT1: Divalent metal transporter 1.
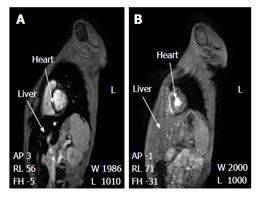
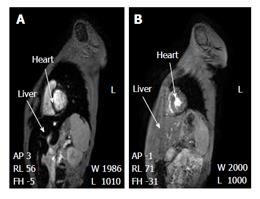
Figure 3 Clearance of iron overload of the liver and heart of a thalassaemia patient using the deferiprone deferoxamine combination.
The MR image changes before (A) and after (B) the L1/DF combination therapy. Short axis view of liver and heart of a thalassaemia patient at 4 mo before the L1/DF combination (A: Cardiac T2* was estimated as 9.3 ms and liver T2* as 3.8 ms. The serum ferritin was 727 μg/L, 2.5 mo before the MRI scan) and 9 mo after the combination (B: Cardiac T2* was estimated as 23.0 ms and liver T2* 26.2 ms. The serum ferritin was 166 μg/L, 0.5 mo after the MRI scan). Arrows indicate the liver and interventricular septum of the heart, respectively. Adapted from ref. [74]. MRI: Magnetic resonance imaging; L1: Deferiprone; DF: Deferoxamine.
Figure 4 Non homogeneous iron distribution among the organs of iron loaded thalassaemia patients.
Differential iron loading of the heart and liver of two iron loaded thalassaemia patients using MRI and T2* estimation. A: Heavy haemosiderosis of the liver [T2* = 1.2 ms (normal T2* ≥ 6.3)] and normal T2* of the heart (T2* = 20.6). The top arrow shows the interventricular septum of the heart of the patient with no iron deposition (normal) where the bottom arrow shows the heavy iron loading within the liver parenchyma, demonstrated as low signal intensity (dark); B: Heavy haemosiderosis of the heart (T2* = 6.32 ms) and normal T2* of the liver (T2* = 19.2 ms). The top arrow shows the abnormal iron deposition in the interventricular septum of the heart of the patient, which is shown with low signal intensity (dark). The bottom arrow shows the liver of the patient with no iron deposition (normal). Adapted from ref. [14]. MRI: Magnetic resonance imaging.
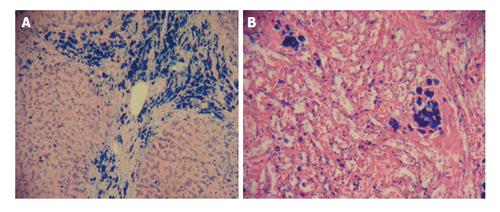
Figure 5 Non homogeneous iron distribution in the liver and spleen of an iron loaded thalassaemia patient.
Liver and spleen biopsy photographs (× 20) of a 29-year-old, 55 kg male thalassaemia patient. The liver biopsy was obtained during splenectomy. A: Liver section showing non unifom iron deposition stained with Pearl’s Prussian blue. There are hemosiderin deposits in hepatocytes and Kupffer cells and especially within bile ducts; B: Spleen section where iron deposits were stained with Pearl’s Prussian blue. There are non uniform hemosiderin deposits within cytoplasma and nucleus of macrophages. Four months before the splenectomy the patient had an MRI T2* (ms) of heart 4.1, liver 0.0, spleen 2.9, and serum ferritin of 3850 μg/L. Adapted from ref. [96]. MRI: Magnetic resonance imaging.
- Citation: Kontoghiorghe CN, Kontoghiorghes GJ. New developments and controversies in iron metabolism and iron chelation therapy. World J Methodol 2016; 6(1): 1-19
- URL: https://www.wjgnet.com/2222-0682/full/v6/i1/1.htm
- DOI: https://dx.doi.org/10.5662/wjm.v6.i1.1


