Copyright
©The Author(s) 2025.
World J Methodol. Mar 20, 2025; 15(1): 97512
Published online Mar 20, 2025. doi: 10.5662/wjm.v15.i1.97512
Published online Mar 20, 2025. doi: 10.5662/wjm.v15.i1.97512
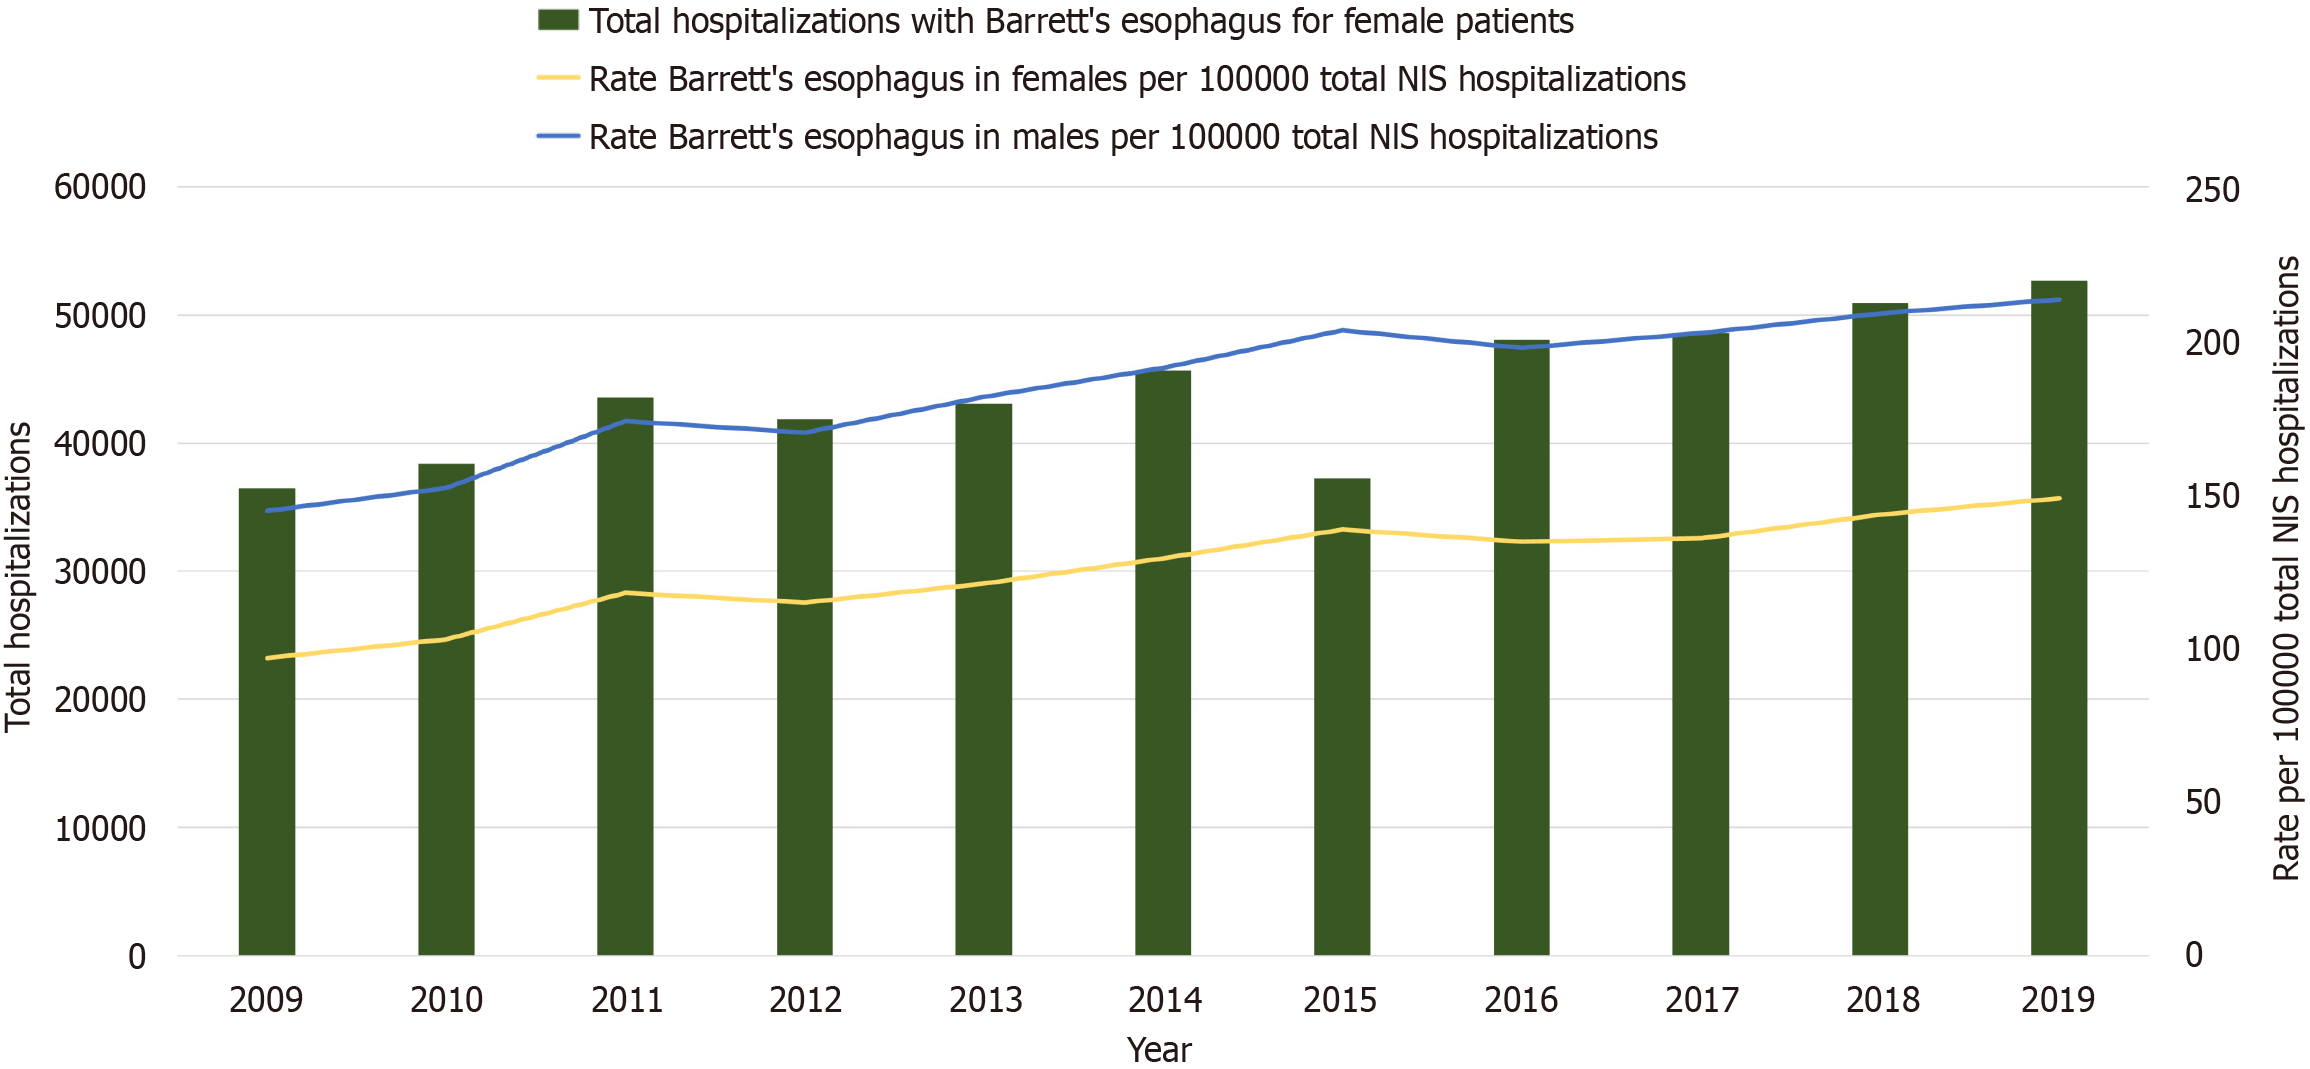
Figure 1 Rate of patients with Barrett's esophagus based on gender per 100000 total National Inpatient Sample hospitalizations.
Bars show the total number of hospitalizations for the study period. The yellow line shows the rate of Barrett's esophagus in females per 100000 total National Inpatient Sample (NIS) hospitalizations. The blue line shows the rate of Barrett's esophagus in males per 100000 total NIS hospitalizations.
- Citation: Fatakhova K, Inayat F, Ali H, Patel P, Rehman AU, Afzal A, Sarfraz M, Sarfraz S, Nawaz G, Chaudhry A, Dhillon R, Dilibe A, Glazebnik B, Jones L, Glazer E. Gender disparities and woman-specific trends in Barrett’s esophagus in the United States: An 11-year nationwide population-based study. World J Methodol 2025; 15(1): 97512
- URL: https://www.wjgnet.com/2222-0682/full/v15/i1/97512.htm
- DOI: https://dx.doi.org/10.5662/wjm.v15.i1.97512


