Copyright
©The Author(s) 2024.
World J Methodol. Sep 20, 2024; 14(3): 92983
Published online Sep 20, 2024. doi: 10.5662/wjm.v14.i3.92983
Published online Sep 20, 2024. doi: 10.5662/wjm.v14.i3.92983
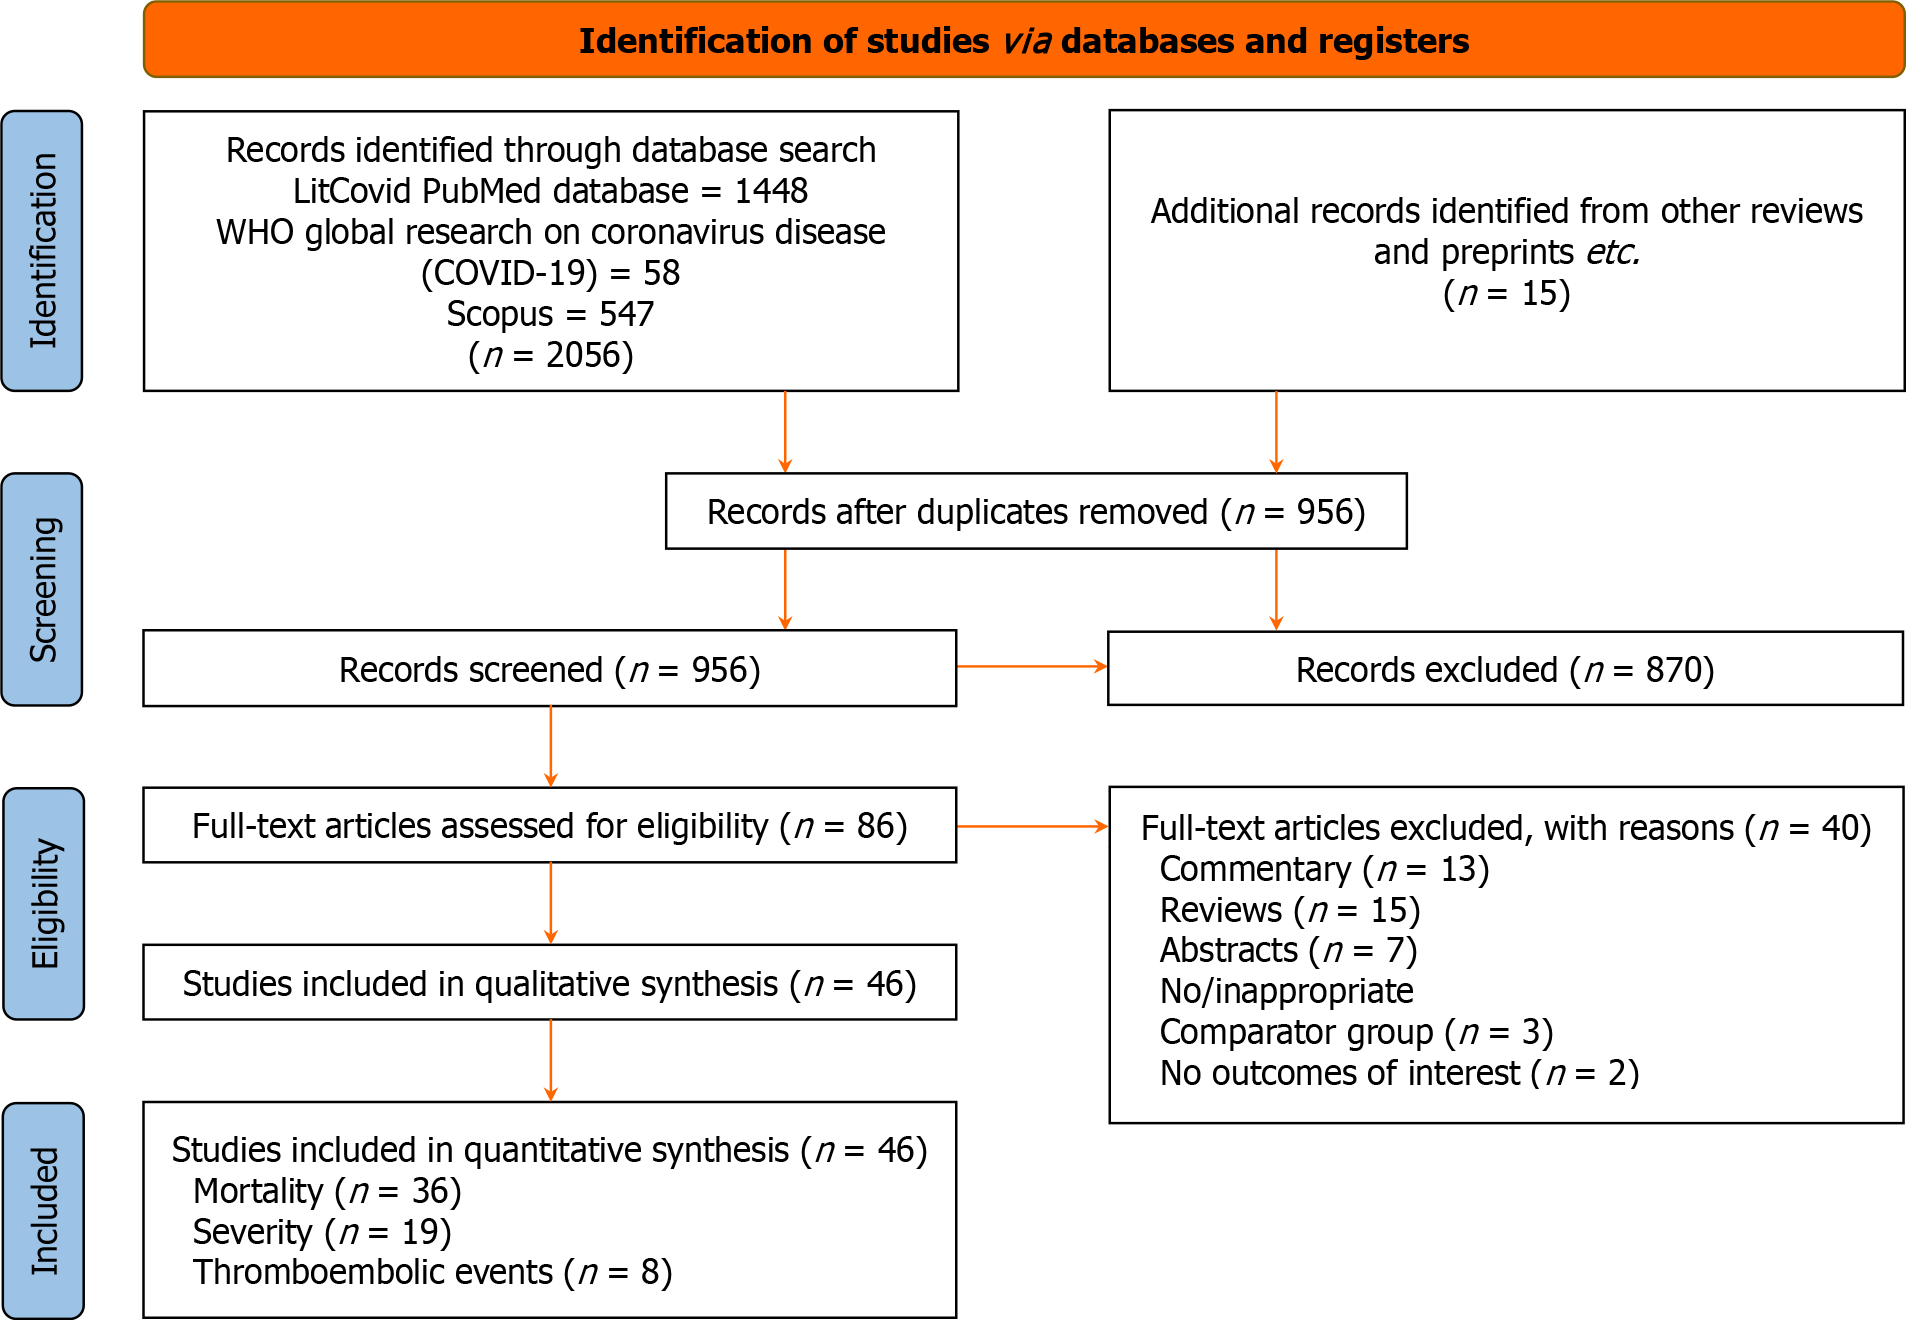
Figure 1
PRISMA flow diagram.
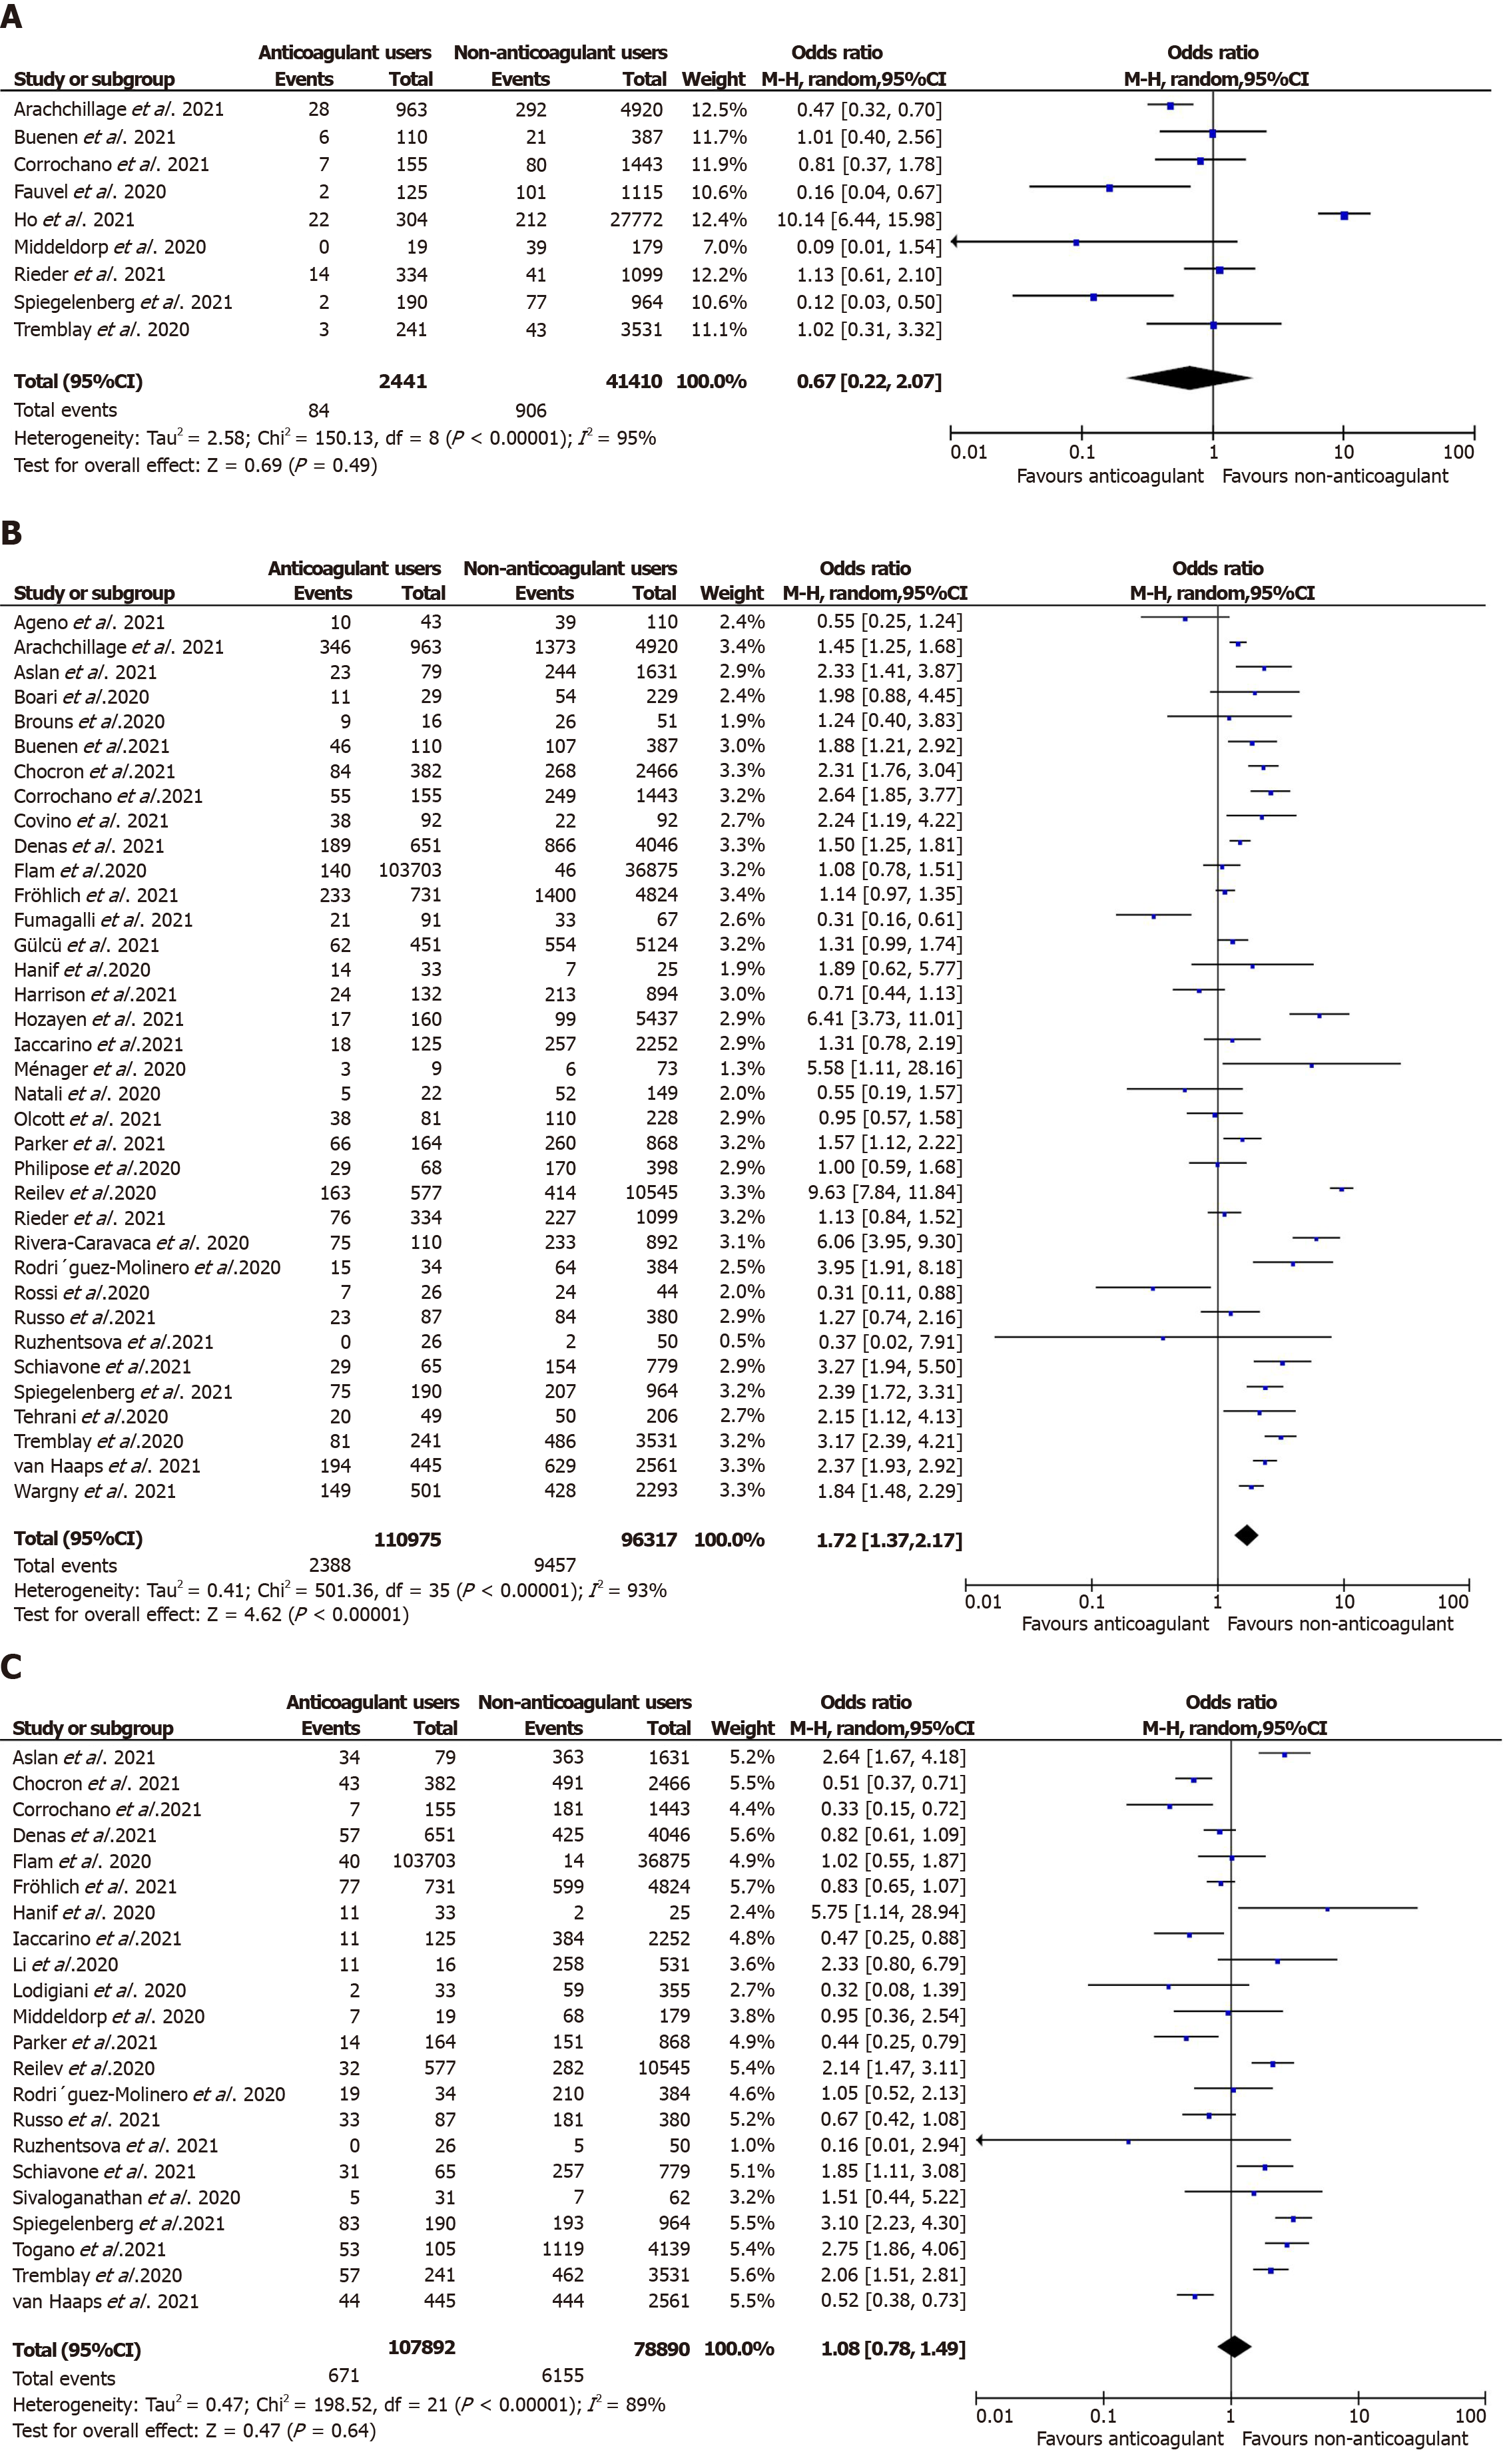
Figure 2 Unadjusted meta-analysis for mortality, severity thromboembolic events in prehospital use of anticoagulants vs control cohort in COVID-19.
A: Unadjusted thromboembolic events in prehospital use of anticoagulants vs control cohort; B: Unadjusted mortality in prehospital use of anticoagulants vs control cohort; C: Unadjusted severity in prehospital use of anticoagulants vs control cohort.
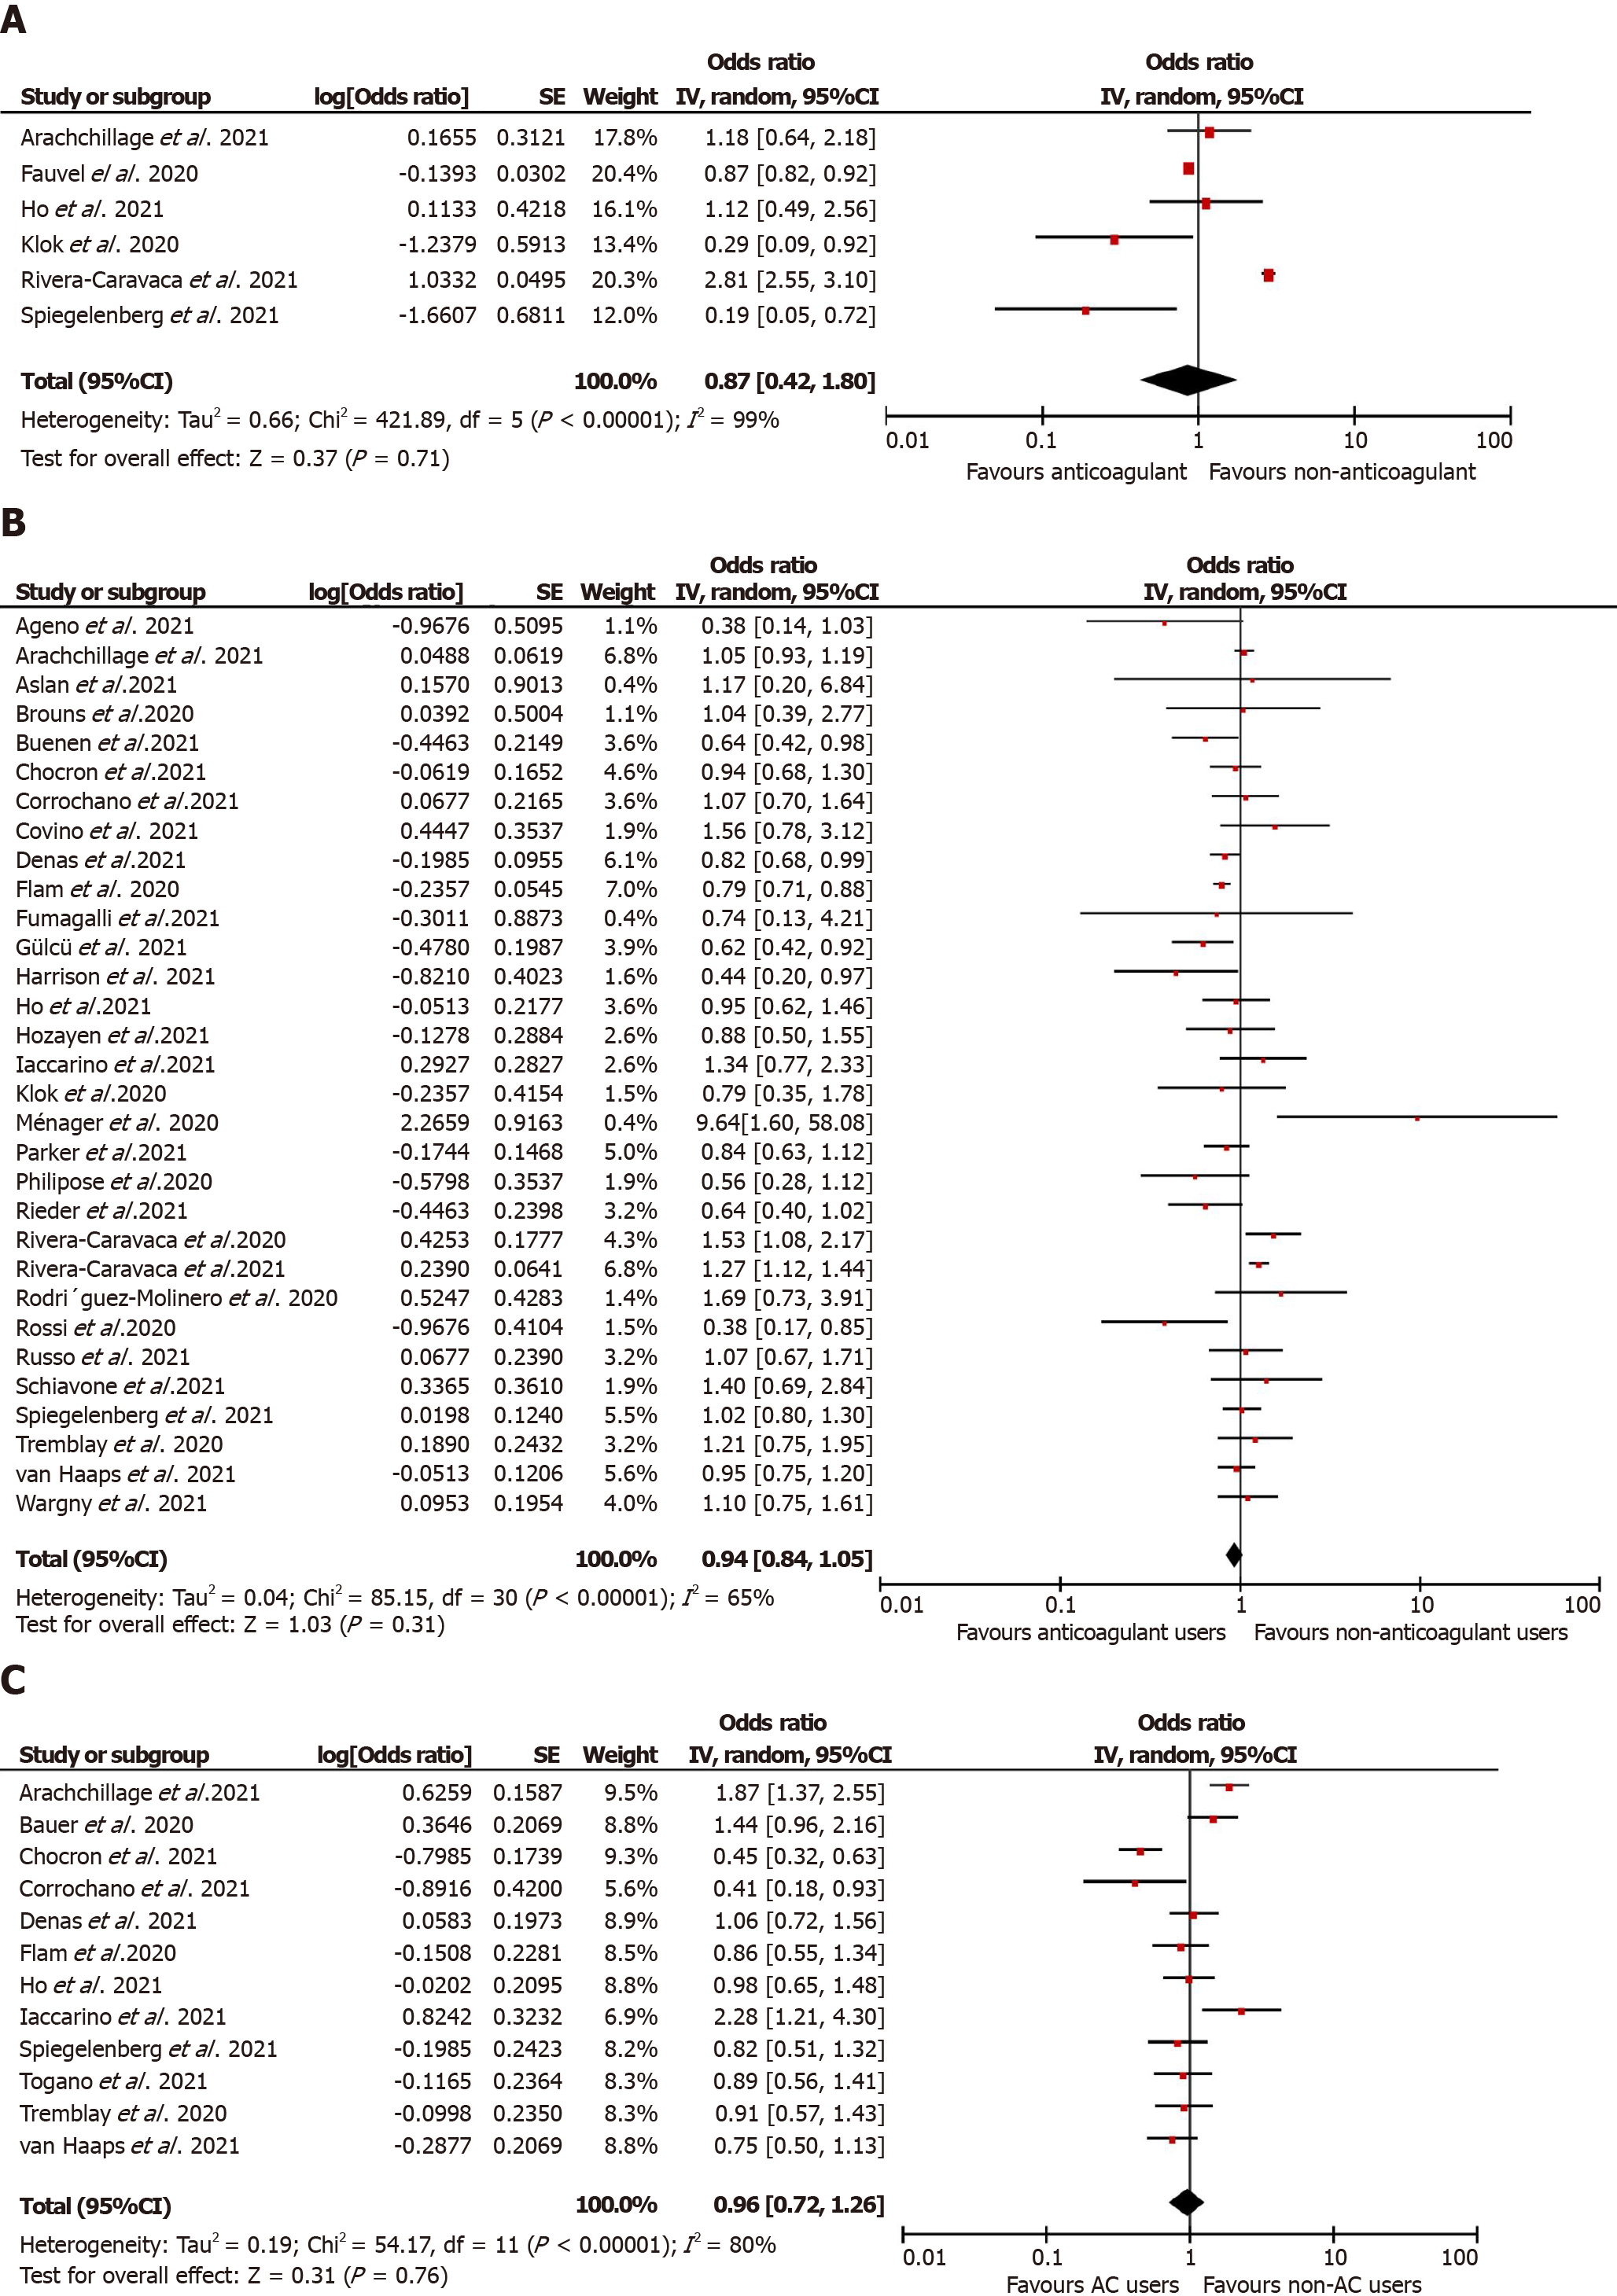
Figure 3 Adjusted meta-analysis for mortality, severity thromboembolic events in prehospital use of anticoagulants vs control cohort in COVID-19.
A: Adjusted thromboembolic events in prehospital use of anticoagulants vs control cohort; B: Adjusted mortality in prehospital use of Anticoagulants vs control cohort; C: Adjusted severity in prehospital use of Anticoagulants vs control cohort.
Figure 4 Meta-regression analyses.
A: Mortality meta-regression analysis; B: Severity meta-regression analysis.
- Citation: Iqbal K, Banga A, Arif TB, Rathore SS, Bhurwal A, Naqvi SKB, Mehdi M, Kumar P, Salklan MM, Iqbal A, Ahmed J, Sharma N, Lal A, Kashyap R, Bansal V, Domecq JP. Anticoagulant use before COVID-19 diagnosis prevent COVID-19 associated acute venous thromboembolism or not: A systematic review and meta-analysis. World J Methodol 2024; 14(3): 92983
- URL: https://www.wjgnet.com/2222-0682/full/v14/i3/92983.htm
- DOI: https://dx.doi.org/10.5662/wjm.v14.i3.92983


