Copyright
©The Author(s) 2024.
World J Methodol. Mar 20, 2024; 14(1): 89853
Published online Mar 20, 2024. doi: 10.5662/wjm.v14.i1.89853
Published online Mar 20, 2024. doi: 10.5662/wjm.v14.i1.89853
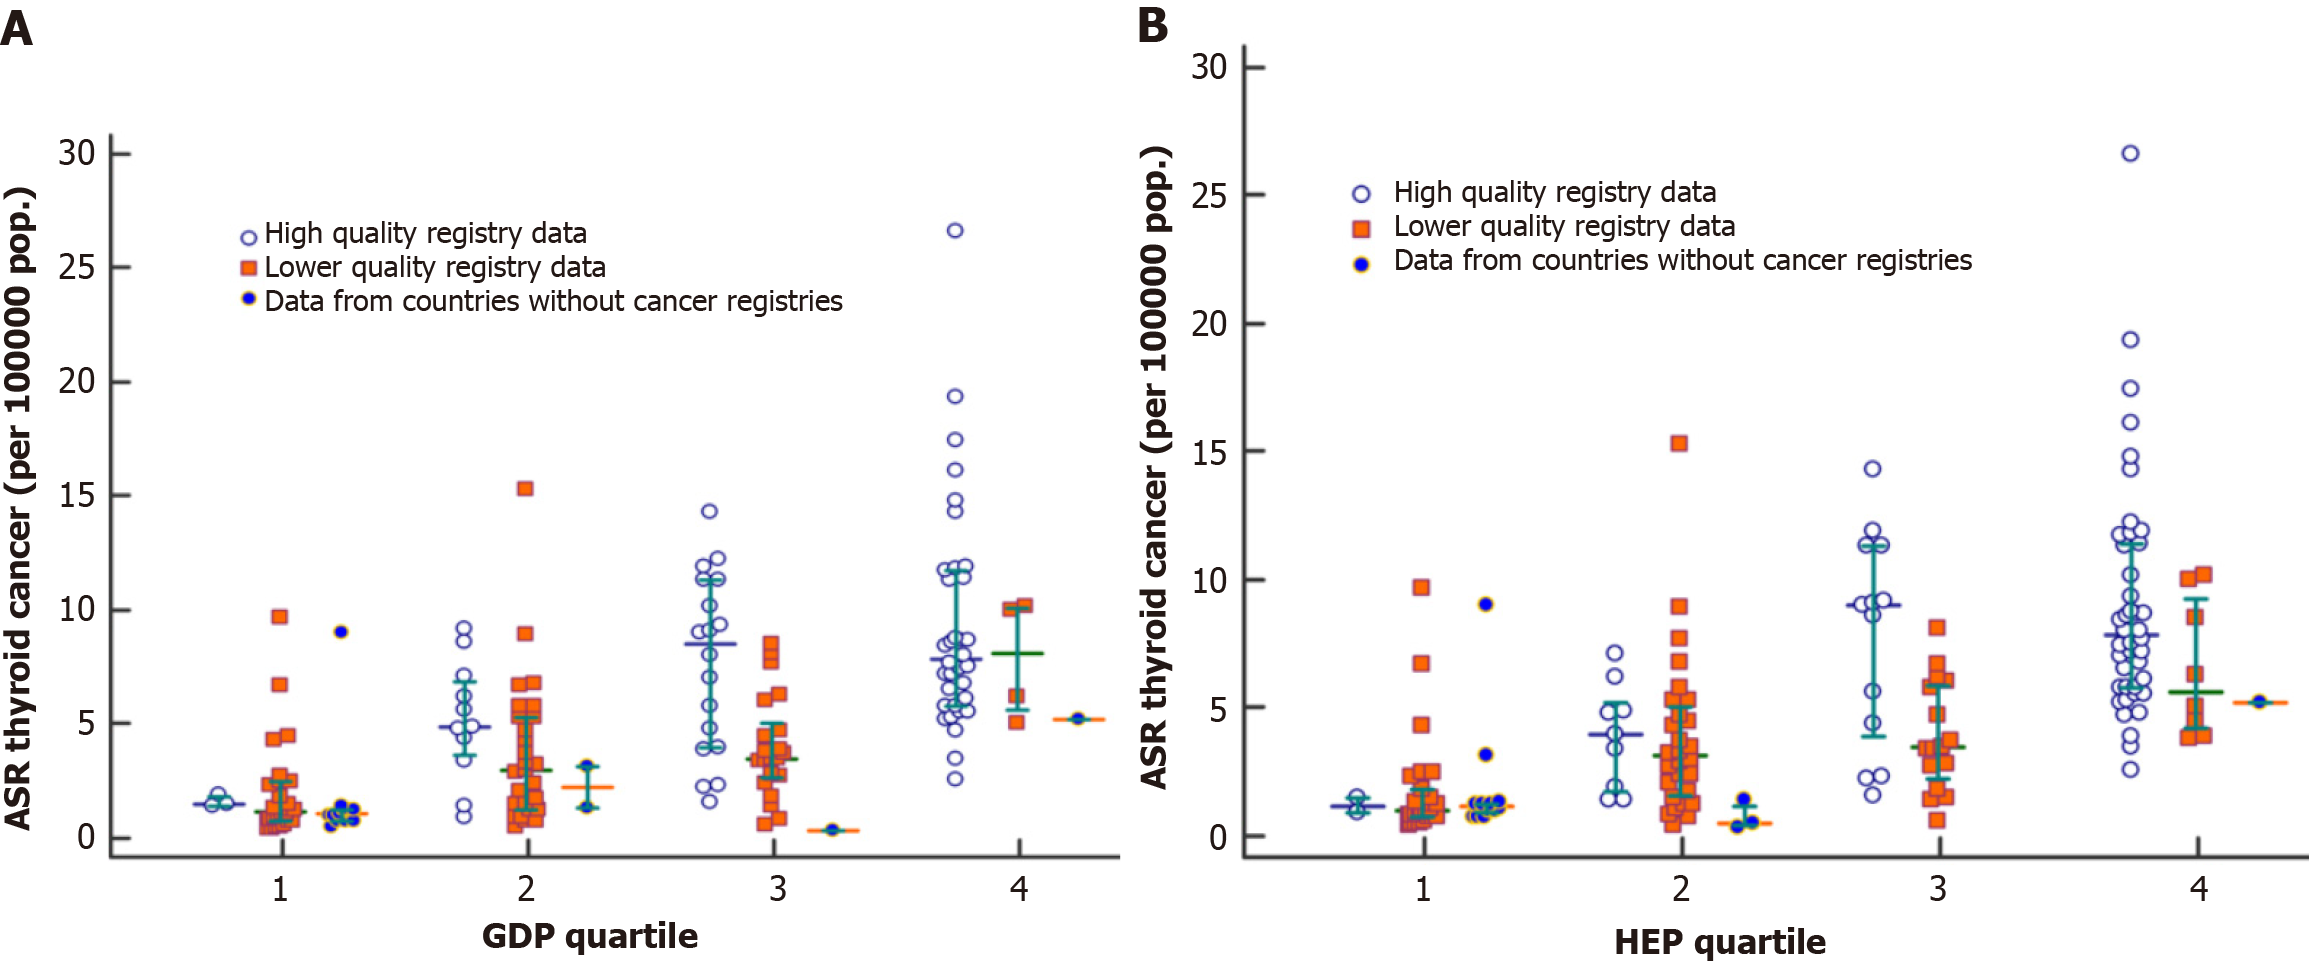
Figure 1 Plots of adjusted standardized rate for thyroid cancer, taking into account quality of cancer registries level.
A: By gross domestic product per person quartile; B: By health expenditure per person quartile; horizontal lines indicate the 25thand 75th percentiles, respectively, with the median in between. GDP: Gross domestic product; HEP: Health expenditure per person.
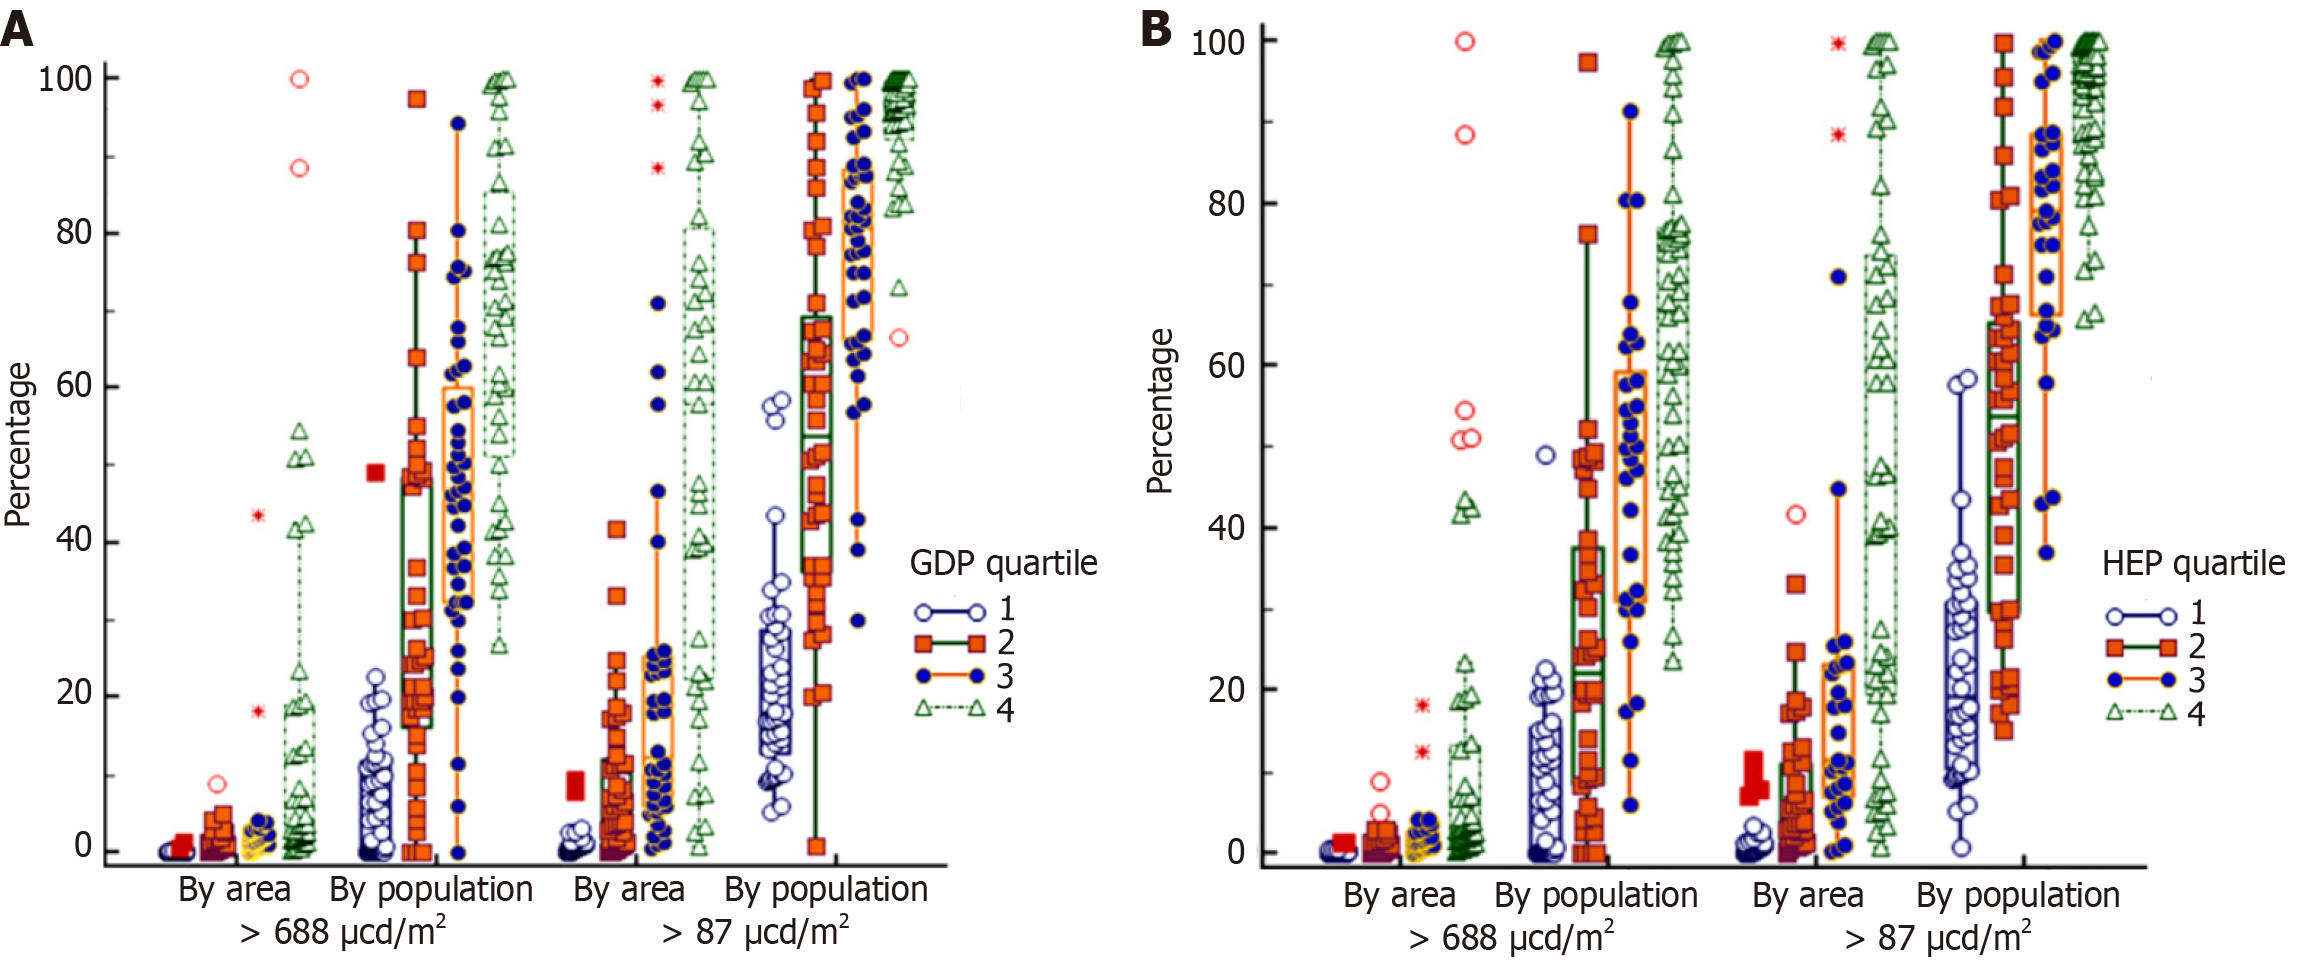
Figure 2 Plots of artificial light at night exposure percentages (vertical scale), by area or population.
A: By gross domestic product per person quartile; B: By health expenditure per person quartile; boxplots are framed by the 25thand 75th percentile. GDP: Gross domestic product; HEP: Health expenditure per person.
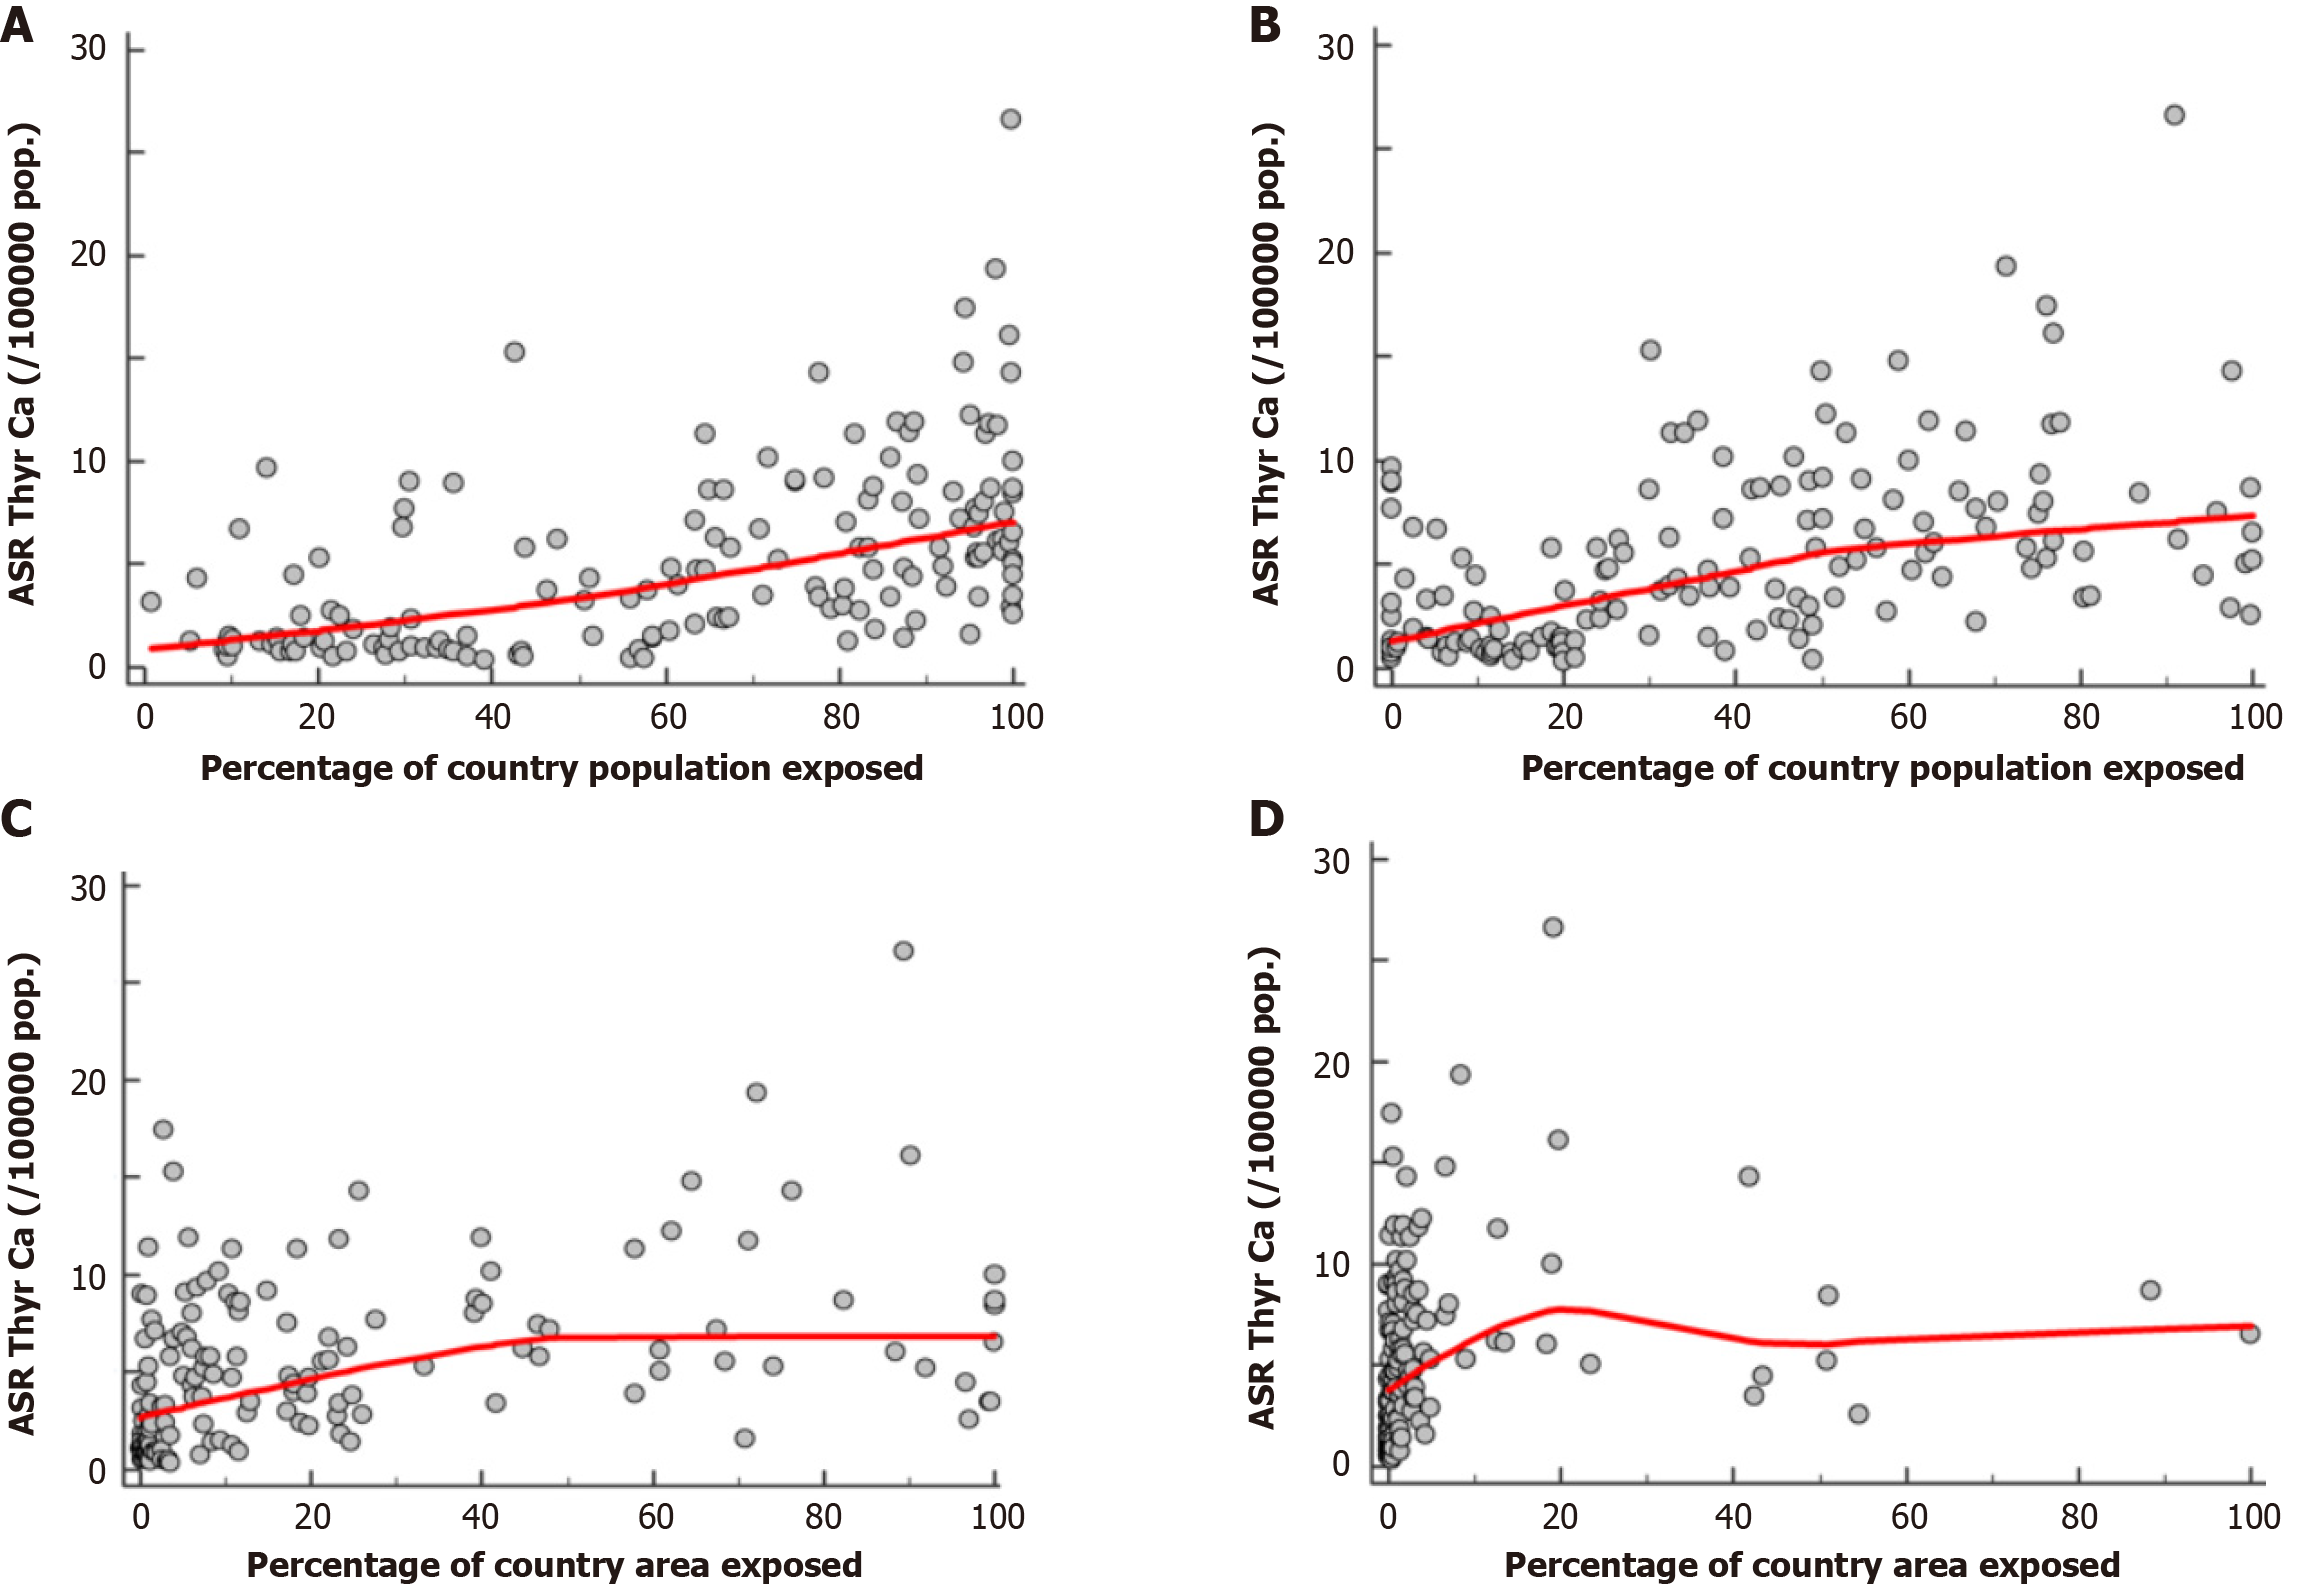
Figure 3 Scatterplots of thyroid cancer incidence by level of exposure to artificial light at night, with locally weighted scatterplot smoothing curves.
A: Thyroid cancer (TC) incidence versus percentage of country population exposed to artificial light at night > 87 μcd/m2; B: TC incidence versus percentage of country population exposed to artificial light at night > 688 μcd/m2; C: TC incidence versus percentage of country area exposed to artificial light at night > 87 μcd/m2; D: TC incidence versus percentage of country area exposed to artificial light at night > 688 μcd/m2; ASR Thyr Ca: Adjusted standardized rate of TC incidence per 100000 population.
- Citation: Tselebis A, Koukkou E, Milionis C, Zabuliene L, Pachi A, Ilias I. Artificial night light and thyroid cancer. World J Methodol 2024; 14(1): 89853
- URL: https://www.wjgnet.com/2222-0682/full/v14/i1/89853.htm
- DOI: https://dx.doi.org/10.5662/wjm.v14.i1.89853


