Copyright
©The Author(s) 2024.
World J Methodol. Mar 20, 2024; 14(1): 89723
Published online Mar 20, 2024. doi: 10.5662/wjm.v14.i1.89723
Published online Mar 20, 2024. doi: 10.5662/wjm.v14.i1.89723
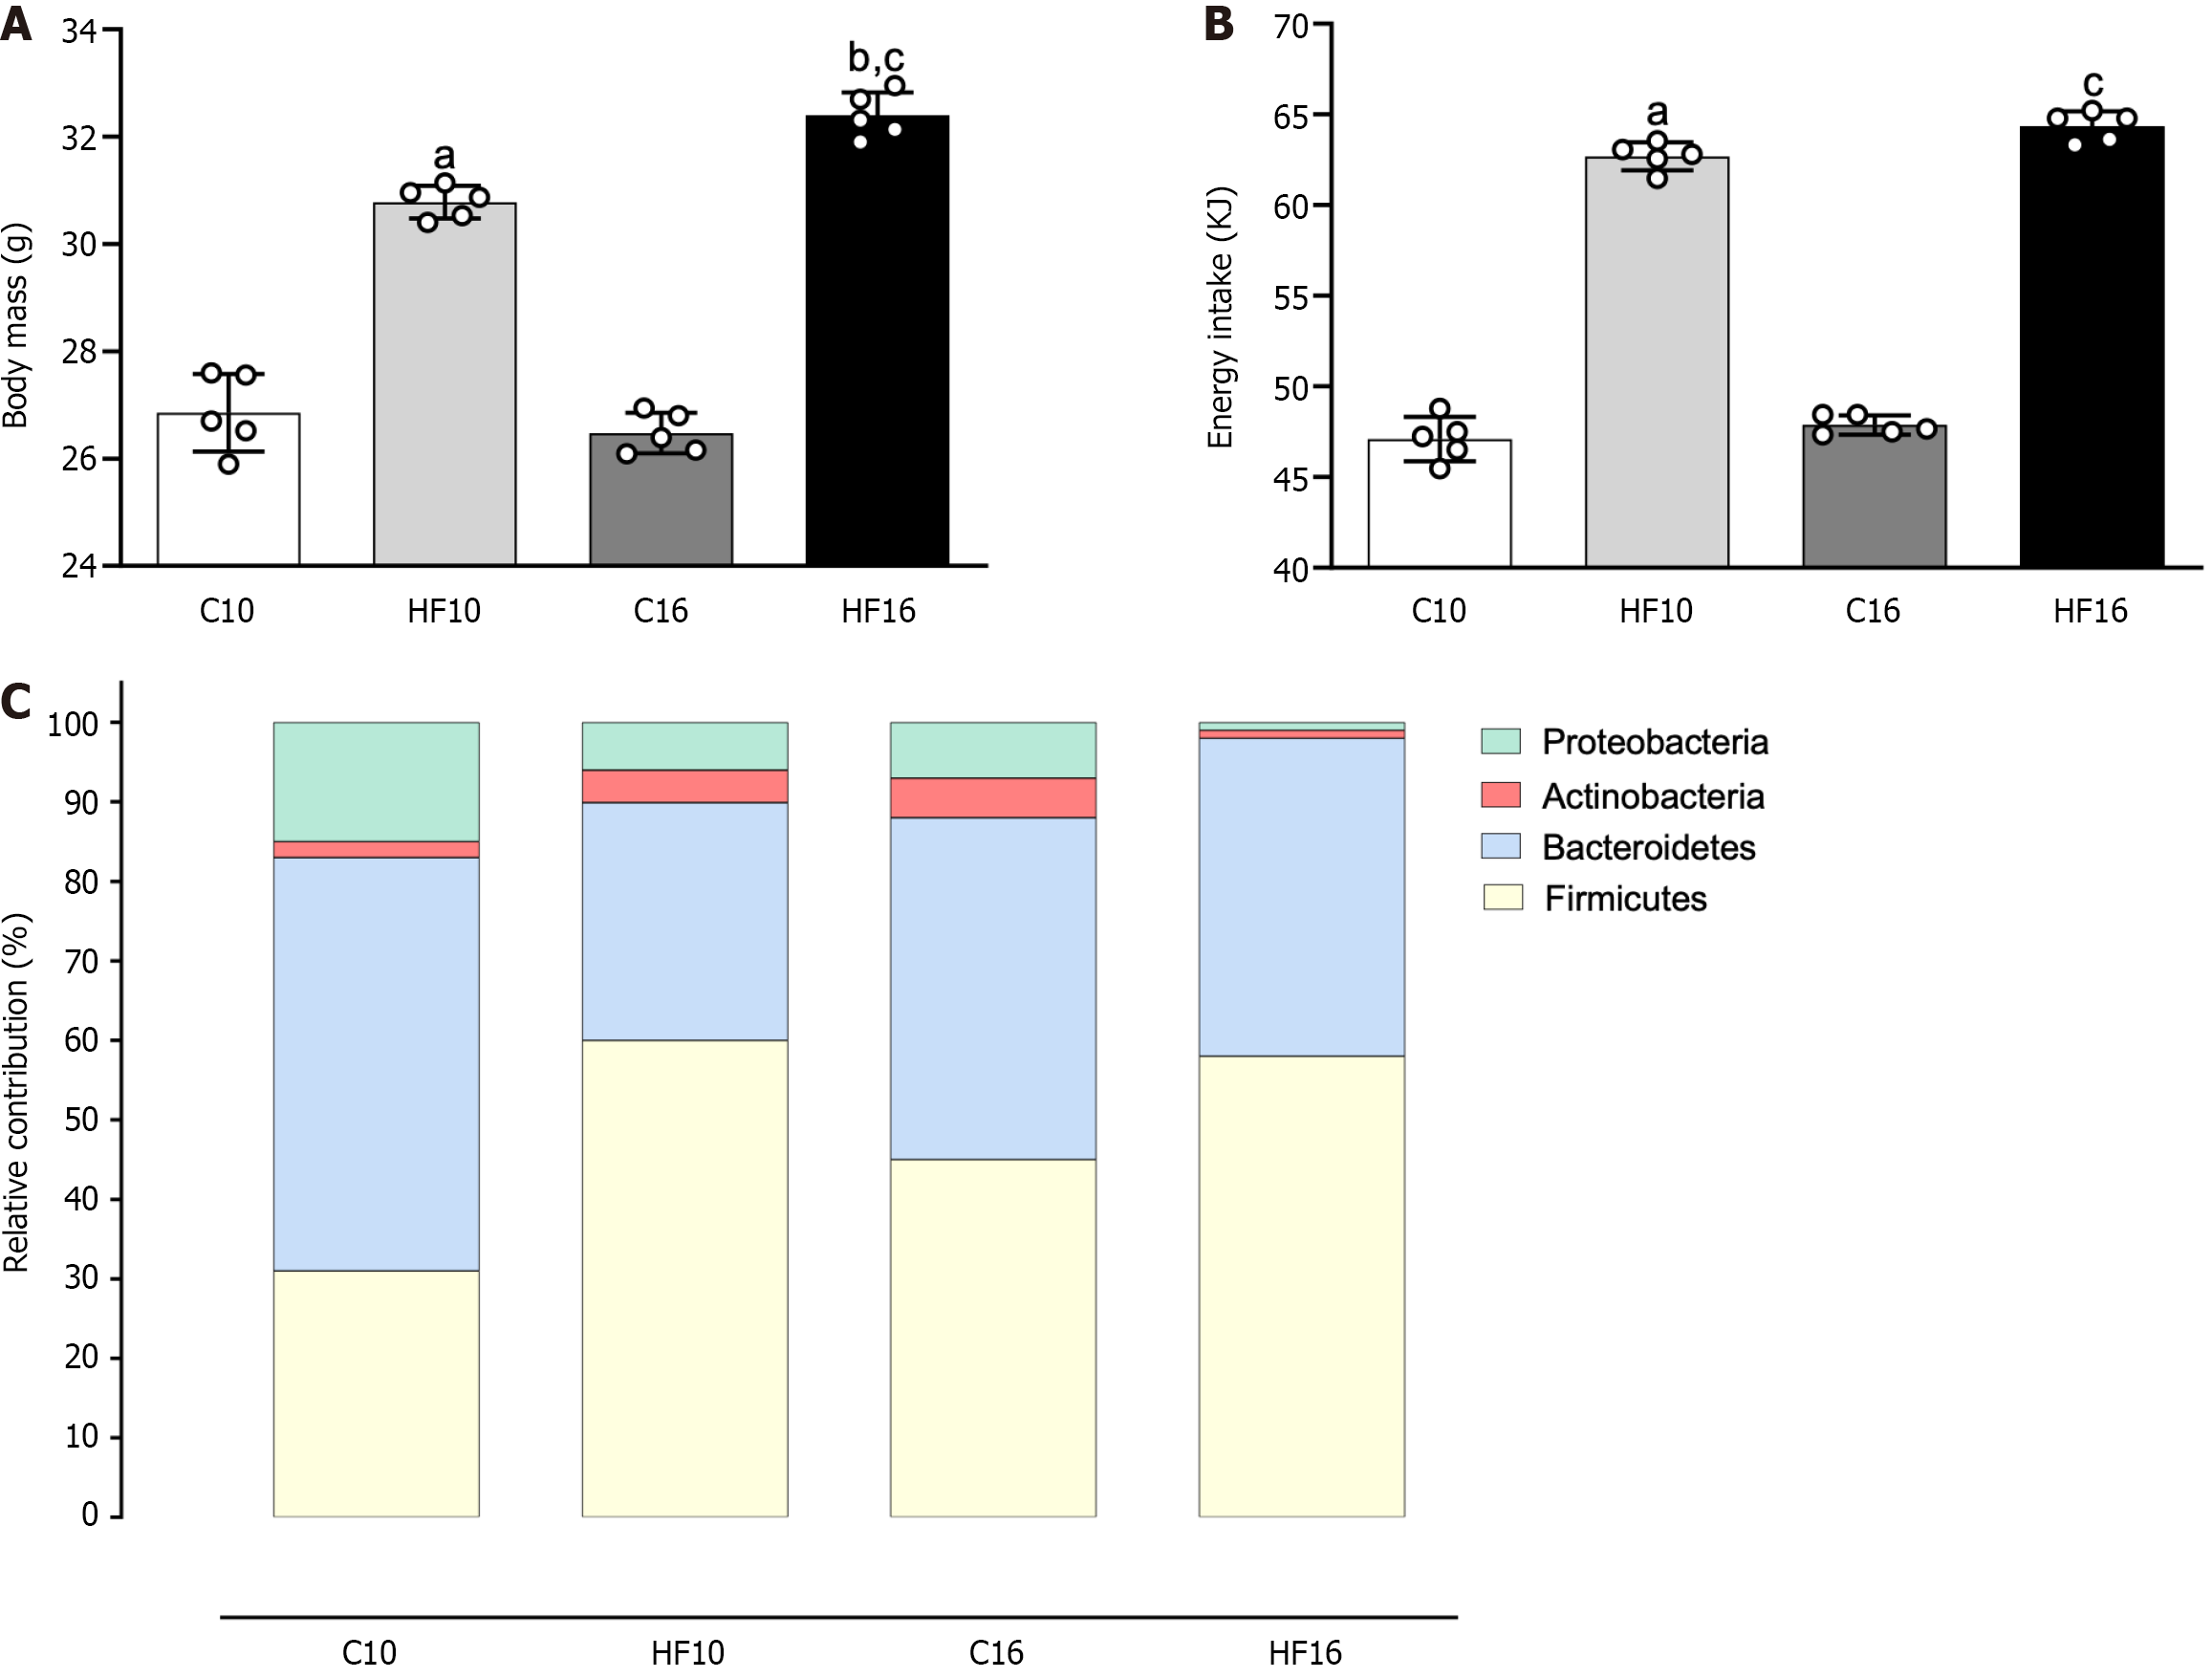
Figure 1 Body mass, energy intake, and phylogenetic microbiota distribution.
A: Body mass; B: Energy intake; C: Phylogenetic microbiota distribution. Brown-Forsythe and Welch one-way ANOVA and Dunnett T3 post hoc test were used (mean ± SD, n = 5). aP < 0.01, compared with control; bP < 0.01, compared with high-fat diet for 10 wk; cP < 0.01 compared with control diet for 16 wk. C10: Control diet for 10 wk; C16: Control diet for 16 wk; HF10: High-fat diet for 10 wk; HF16: High-fat diet for 16 wk.
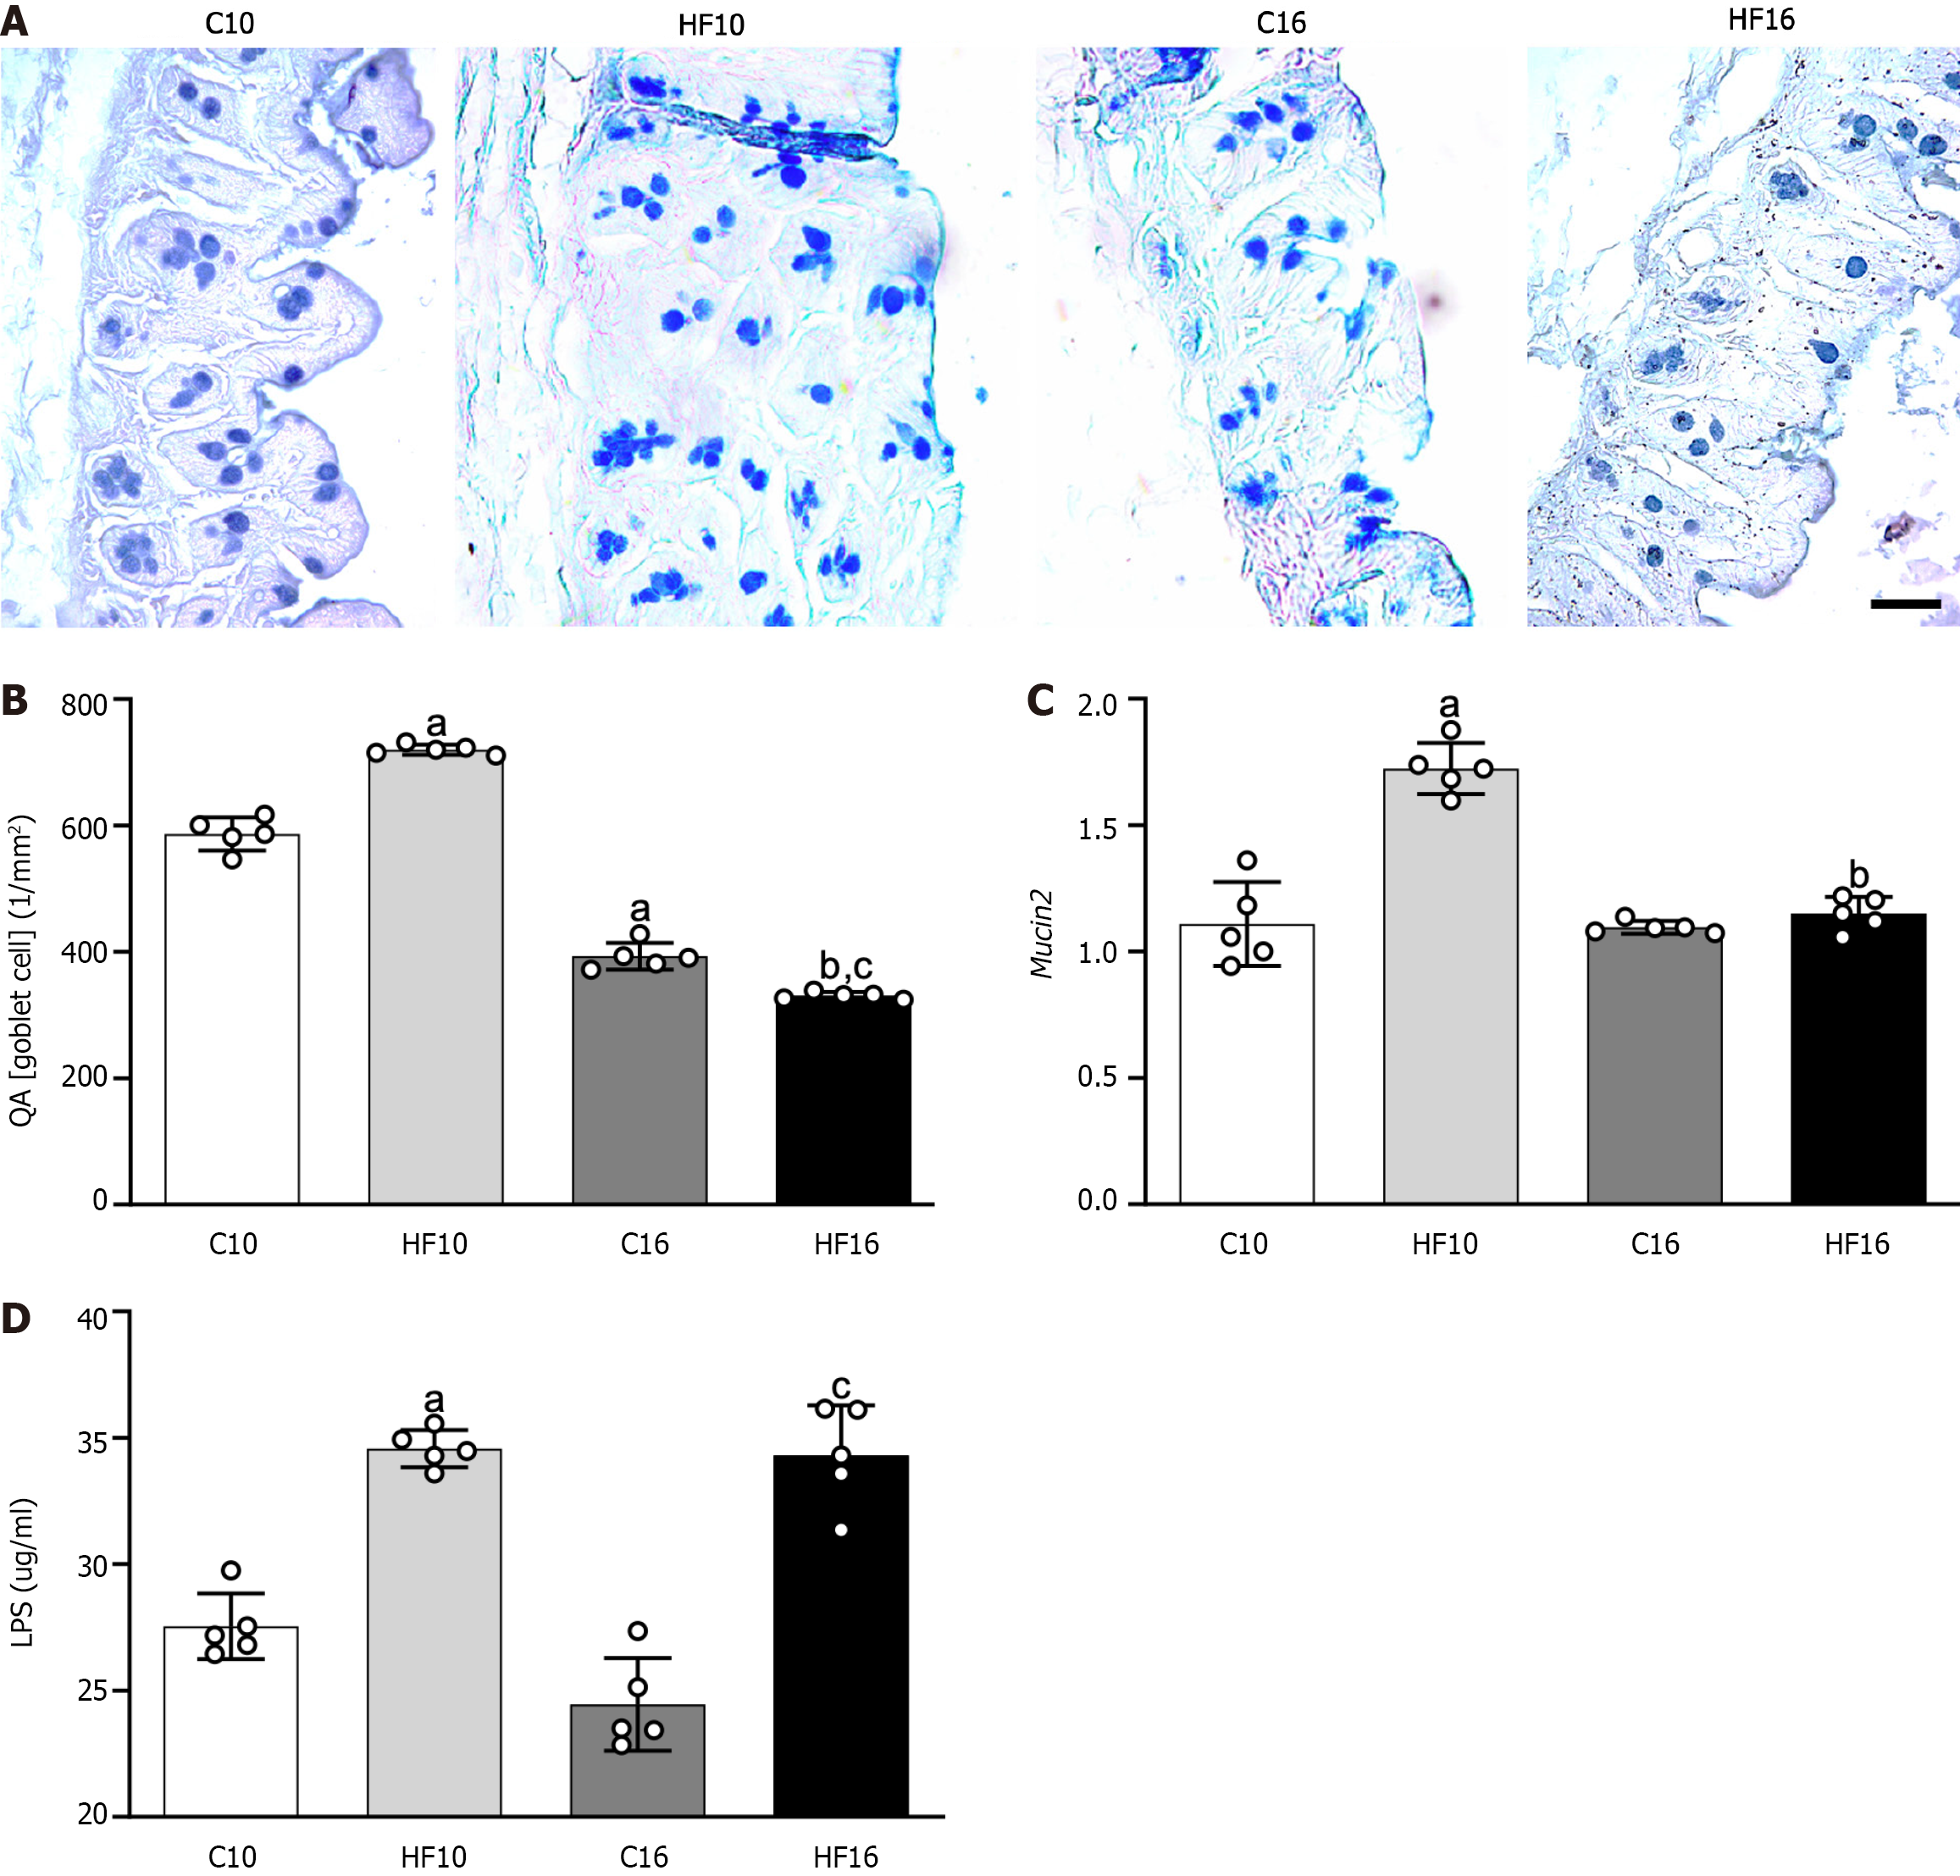
Figure 2 Staining of goblet cells with alcian blue, QA (goblet cells), relative Mucin2 mRNA expression, and plasma lipopolysaccharide concentrations.
A: Large intestine tissue stained with alcian blue and periodic acid-Schiff (PAS), revealing that the goblet cells were stained blue; B: Numerical density of goblet cells per area [QA (goblet cells)]. Alcian blue and PAS stained glycoproteins produced by goblet cells (scale bar = 40 μm) were markedly increased in the high-fat diet for 10 wk group according to stereology [QA (goblet cells)]. ; C: Relative Mucin2 mRNA expression in different groups; D: Plasma lipopolysaccharide concentrations in different groups. Brown-Forsythe and Welch one-way ANOVA and Dunnett T3 post hoc test were used (mean ± SD, n = 5). aP < 0.01, compared with control; bP < 0.01, compared with high-fat diet for 10 wk; cP < 0.01 compared with control diet for 16 wk. C10: Control diet for 10 wk; C16: Control diet for 16 wk; HF10: High-fat diet for 10 wk; HF16: High-fat diet for 16 wk; LPS: Lipopolysaccharide.
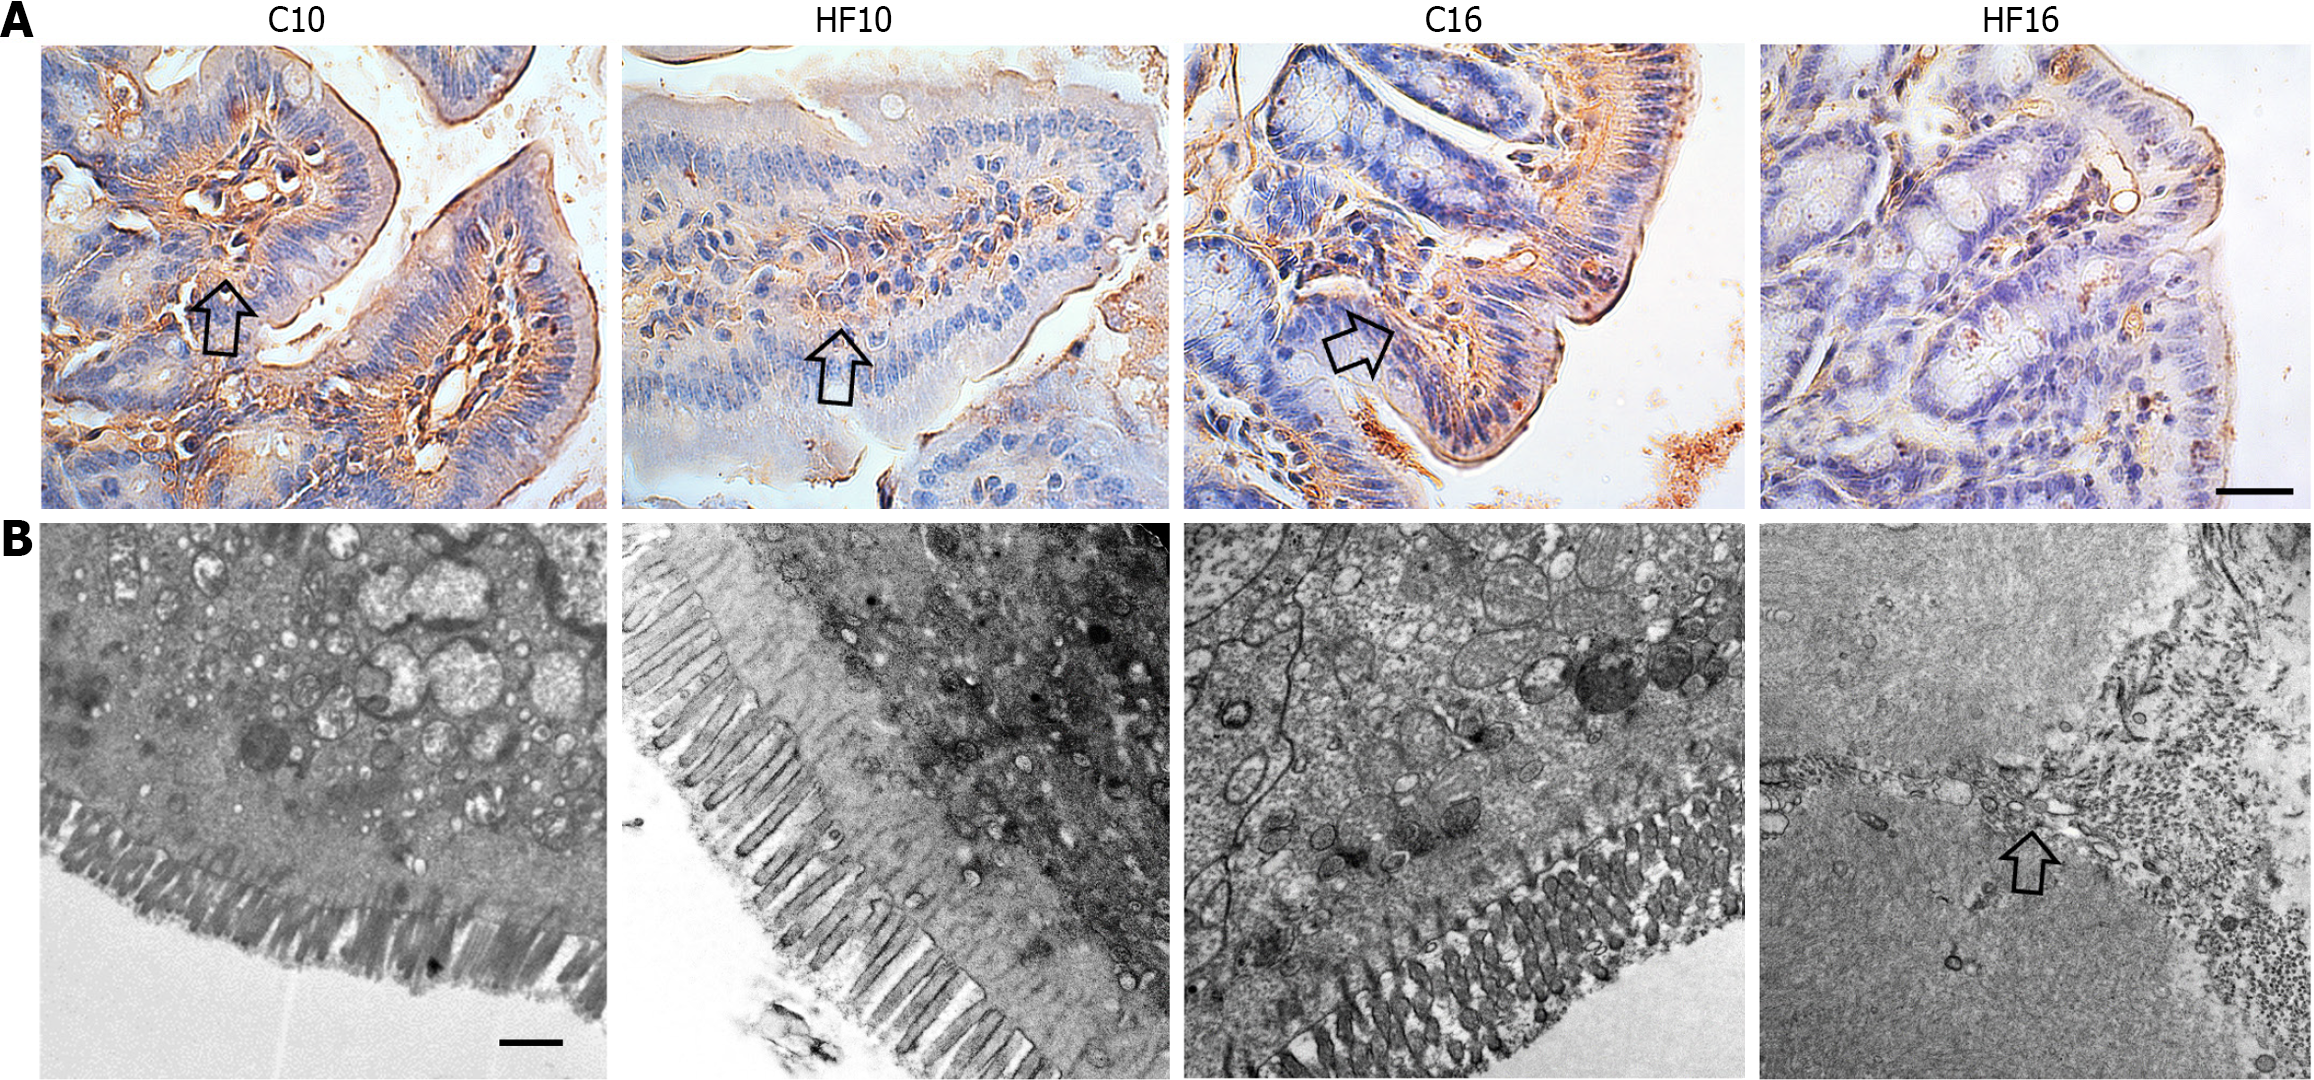
Figure 3 Immunohistochemical staining for occludin in the ileum and transmission electron microscopy of the ileum.
A: Occludin immunostaining is shown in light brown (open arrow) and was decreased in a time-dependent manner in the high-fat (HF)-fed groups. B: Transmission electron microscopy images showing normal ileal ultrastructures in the control diet for 10 wk and control diet for 16 wk groups, with preserved tight junctions (asterisk). In contrast, the HF diet for 10 wk and HF diet for 16 wk groups exhibited disrupted tight junctions (open arrow) in addition to a damaged ultrastructure. C10: Control diet for 10 wk; C16: Control diet for 16 wk; HF10: High-fat diet for 10 wk; HF16: High-fat diet for 16 wk.
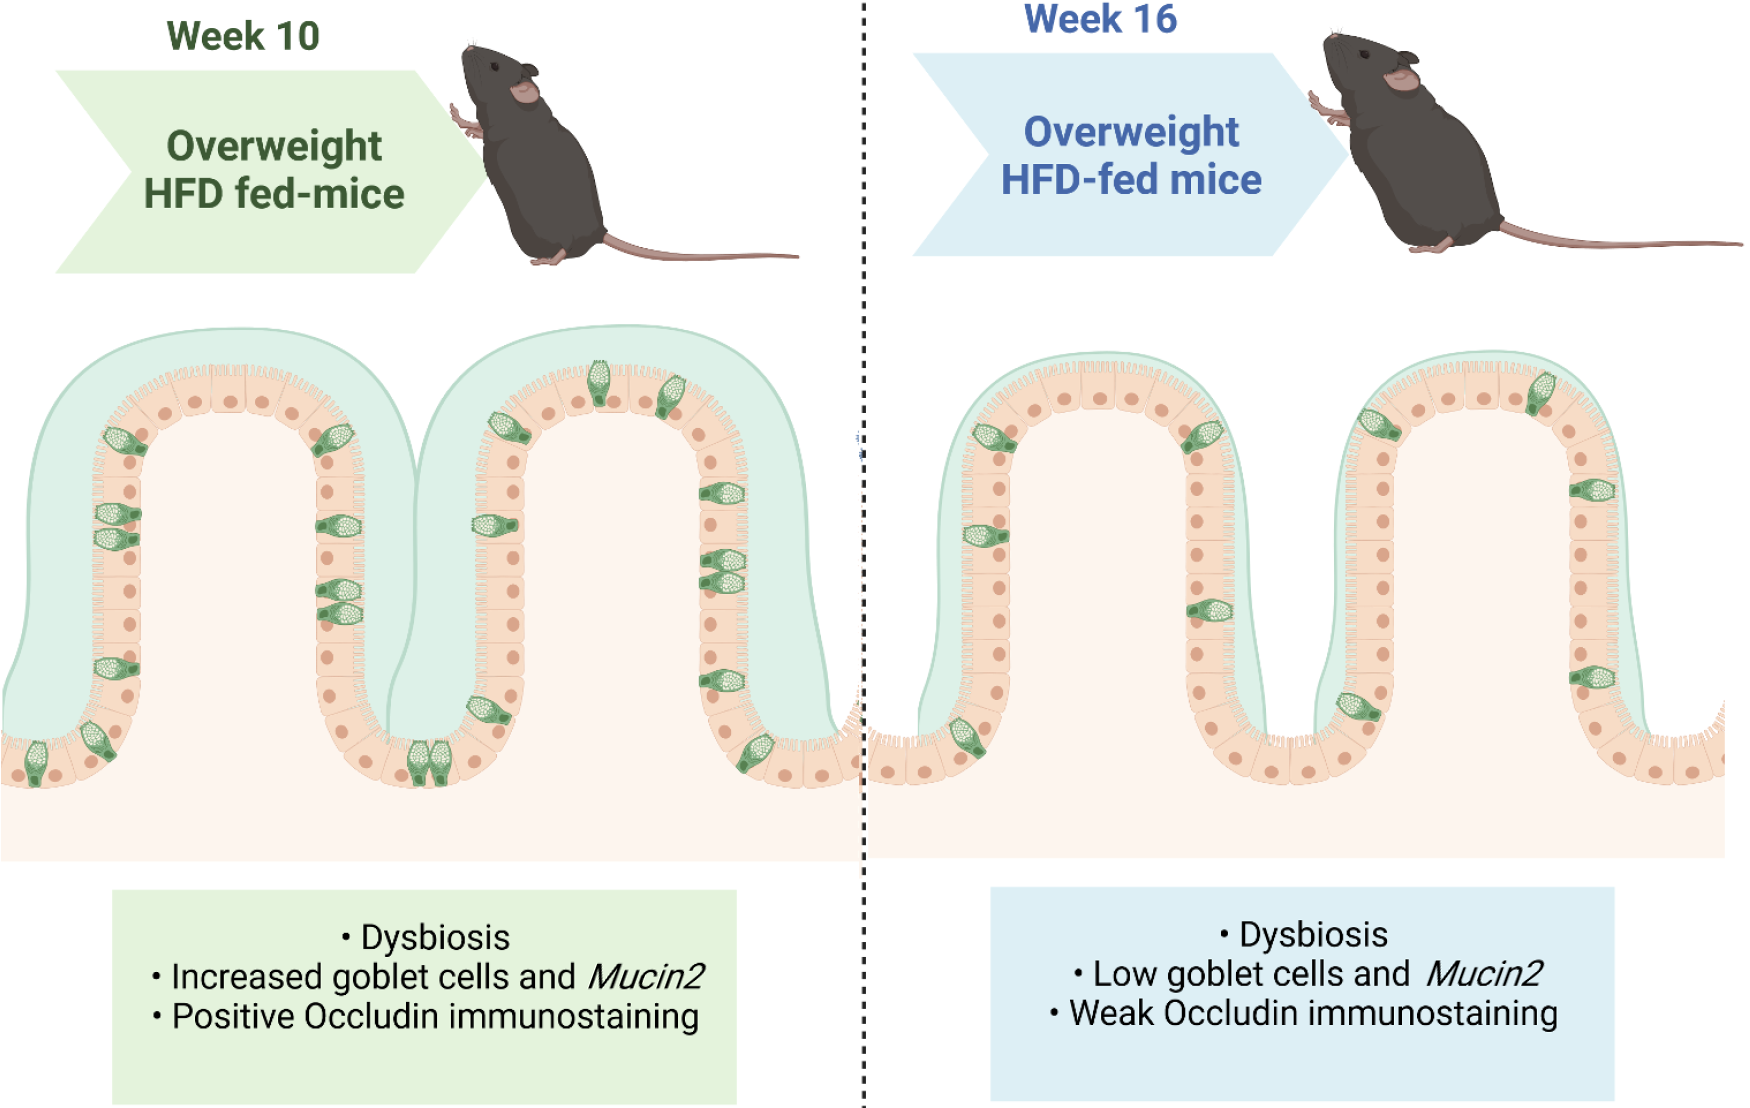
Figure 4 Summary of the main results.
The animals fed the high-fat diet for 10 wk (HF10) had overweight, increased goblet cell numerical density, and Mucin2 expression as a compensatory mechanism to prevent injury from the HFD. However, after 16 wk, HFD-fed mice remained overweight and had a greater body mass than the HF10 group but had a decreased goblet cell number and Mucin2 expression. Therefore, HF16 mice exhibited a completely disarranged intestinal ultrastructure, with damaged tight junctions and negative occludin immunostaining. Created with Biorender (www.biorender.com). HFD: High-fat diet.
- Citation: Miranda CS, Santana-Oliveira DA, Vasques-Monteiro IL, Dantas-Miranda NS, Glauser JSO, Silva-Veiga FM, Souza-Mello V. Time-dependent impact of a high-fat diet on the intestinal barrier of male mice. World J Methodol 2024; 14(1): 89723
- URL: https://www.wjgnet.com/2222-0682/full/v14/i1/89723.htm
- DOI: https://dx.doi.org/10.5662/wjm.v14.i1.89723


