Copyright
©The Author(s) 2022.
World J Methodol. Jul 20, 2022; 12(4): 319-330
Published online Jul 20, 2022. doi: 10.5662/wjm.v12.i4.319
Published online Jul 20, 2022. doi: 10.5662/wjm.v12.i4.319
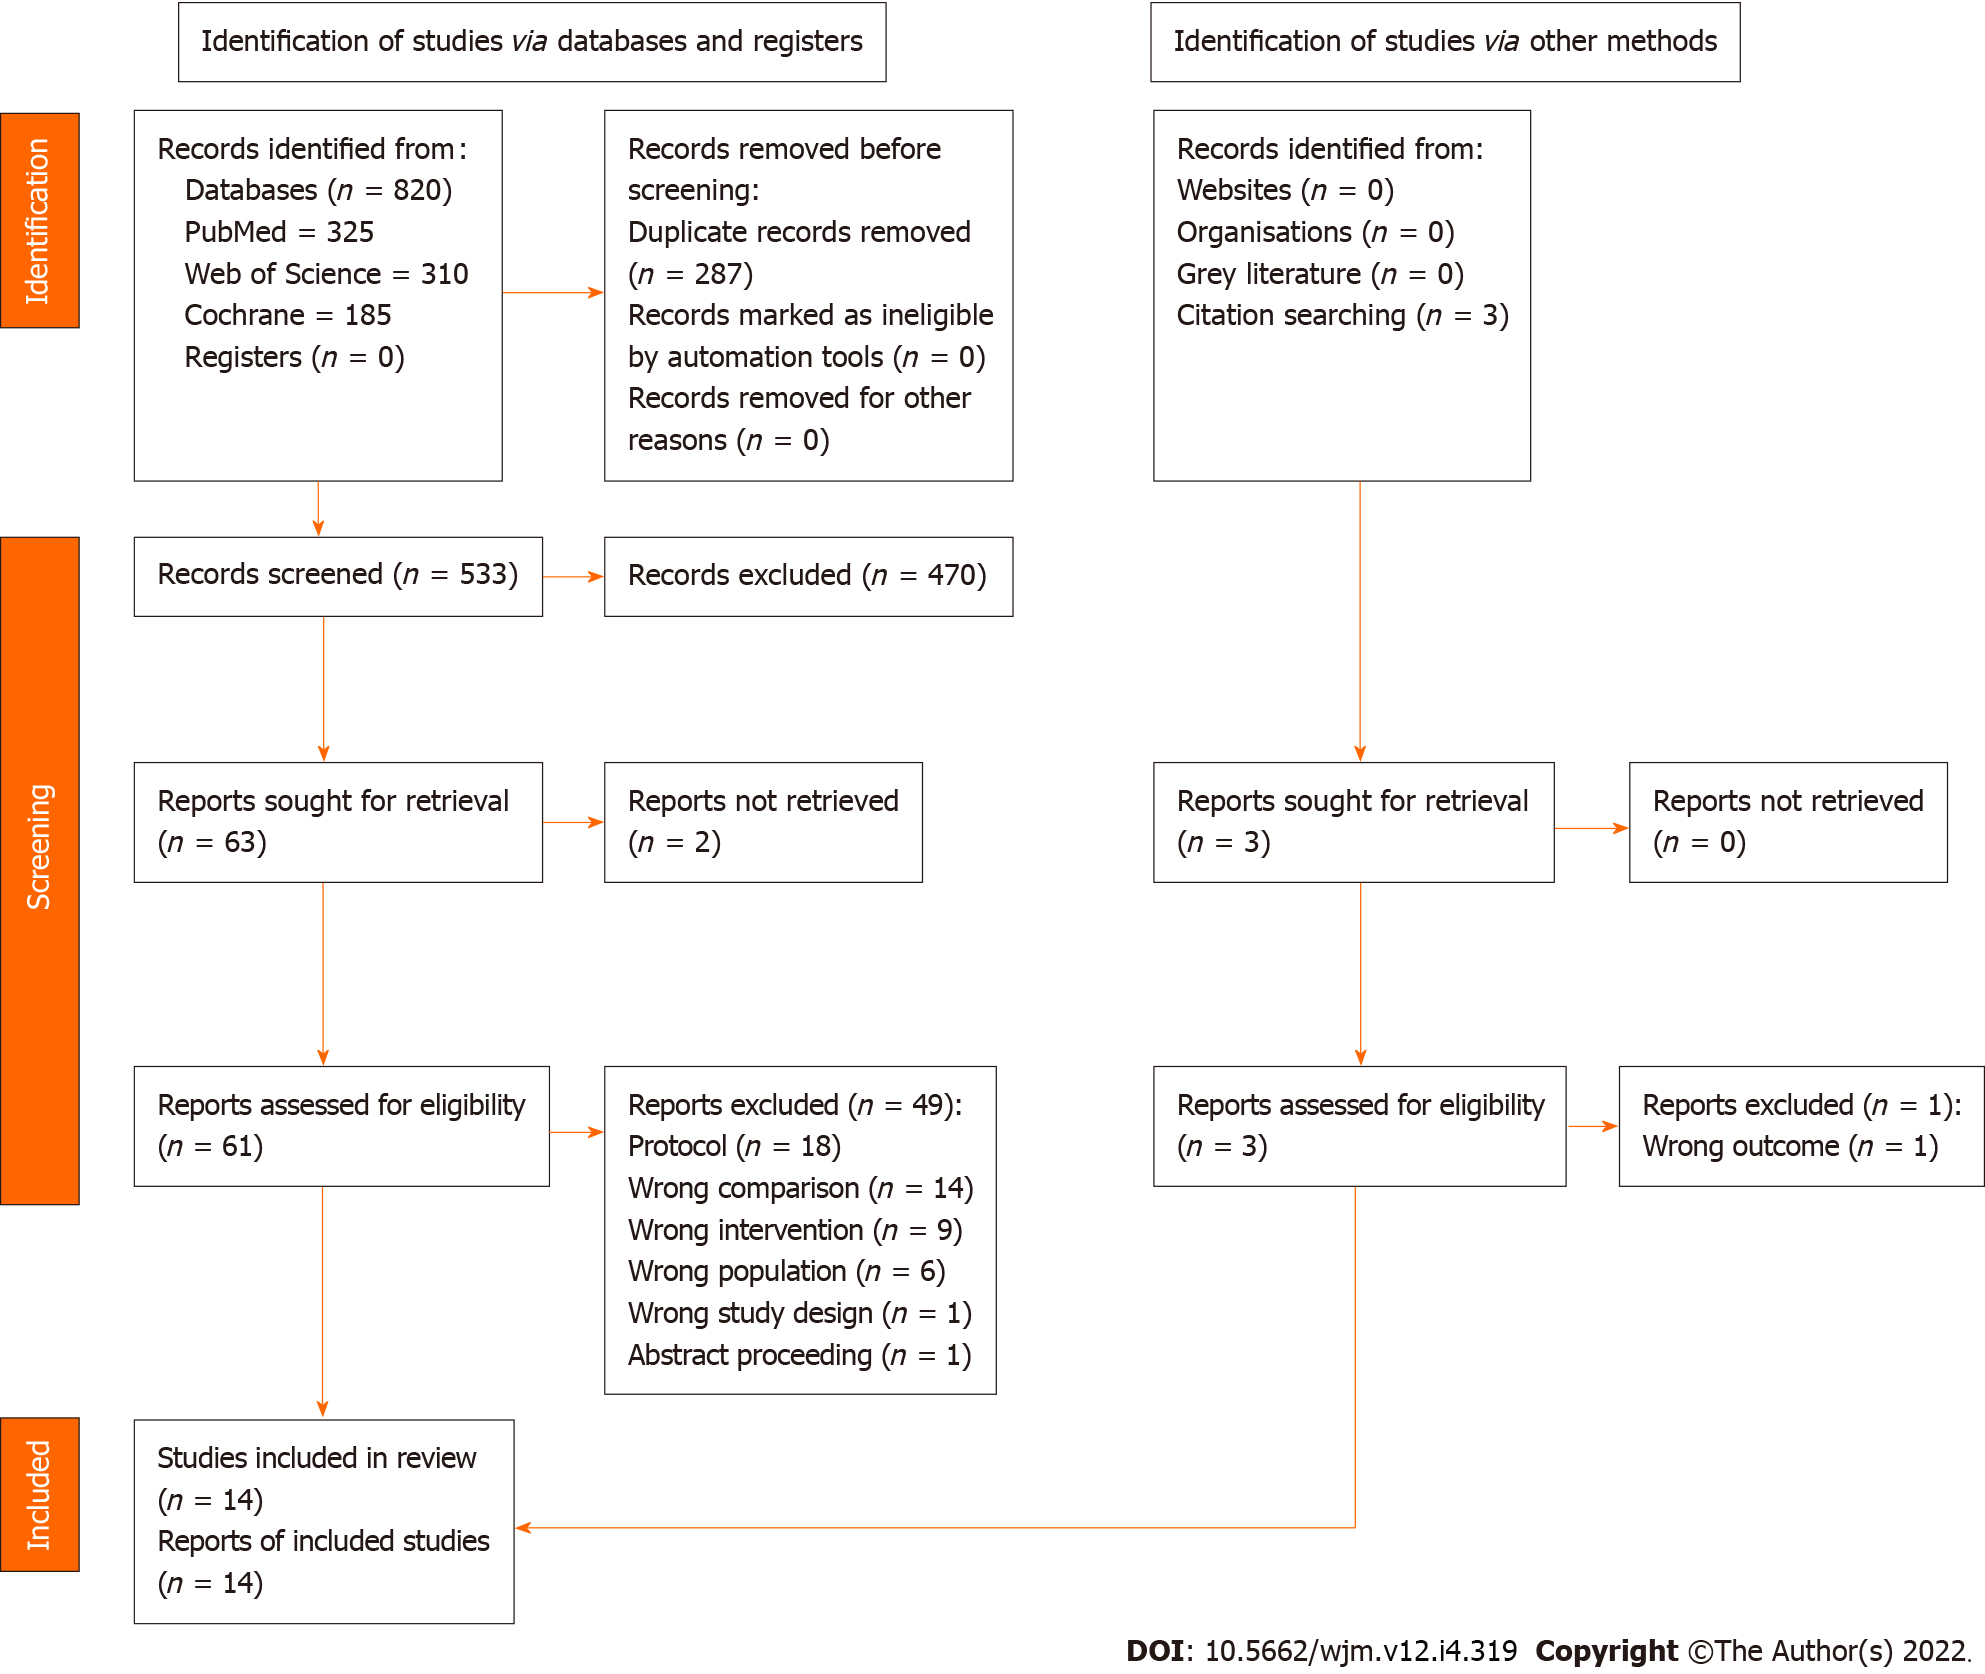
Figure 1
PRISMA flow chart of study selection.
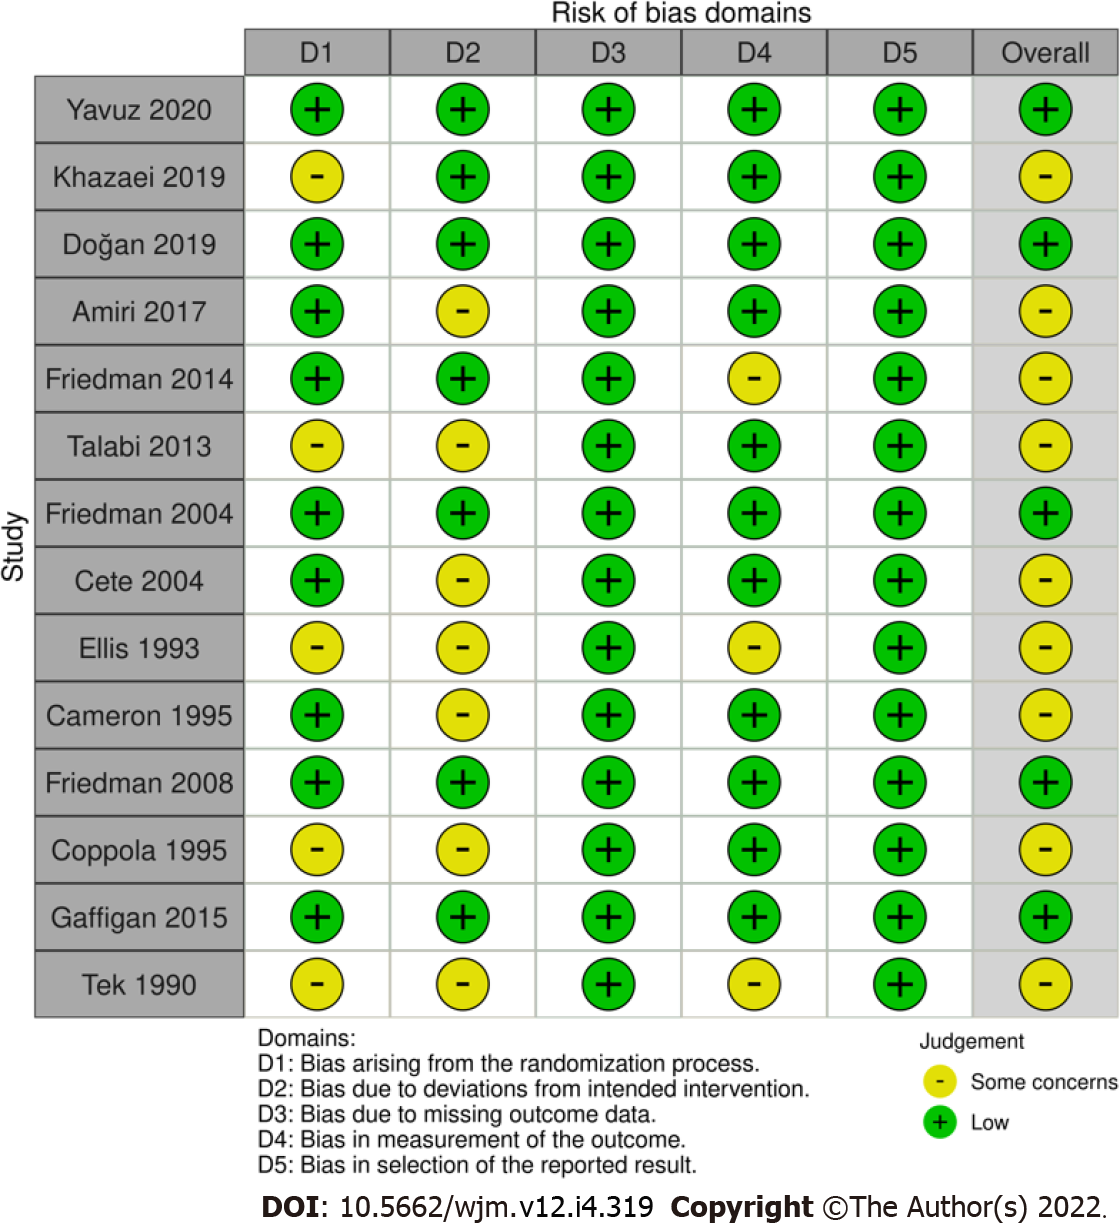
Figure 2
Cochrane risk of bias assessment of included studies.
Figure 3
Details of each domain of Cochrane risk of bias assessment.
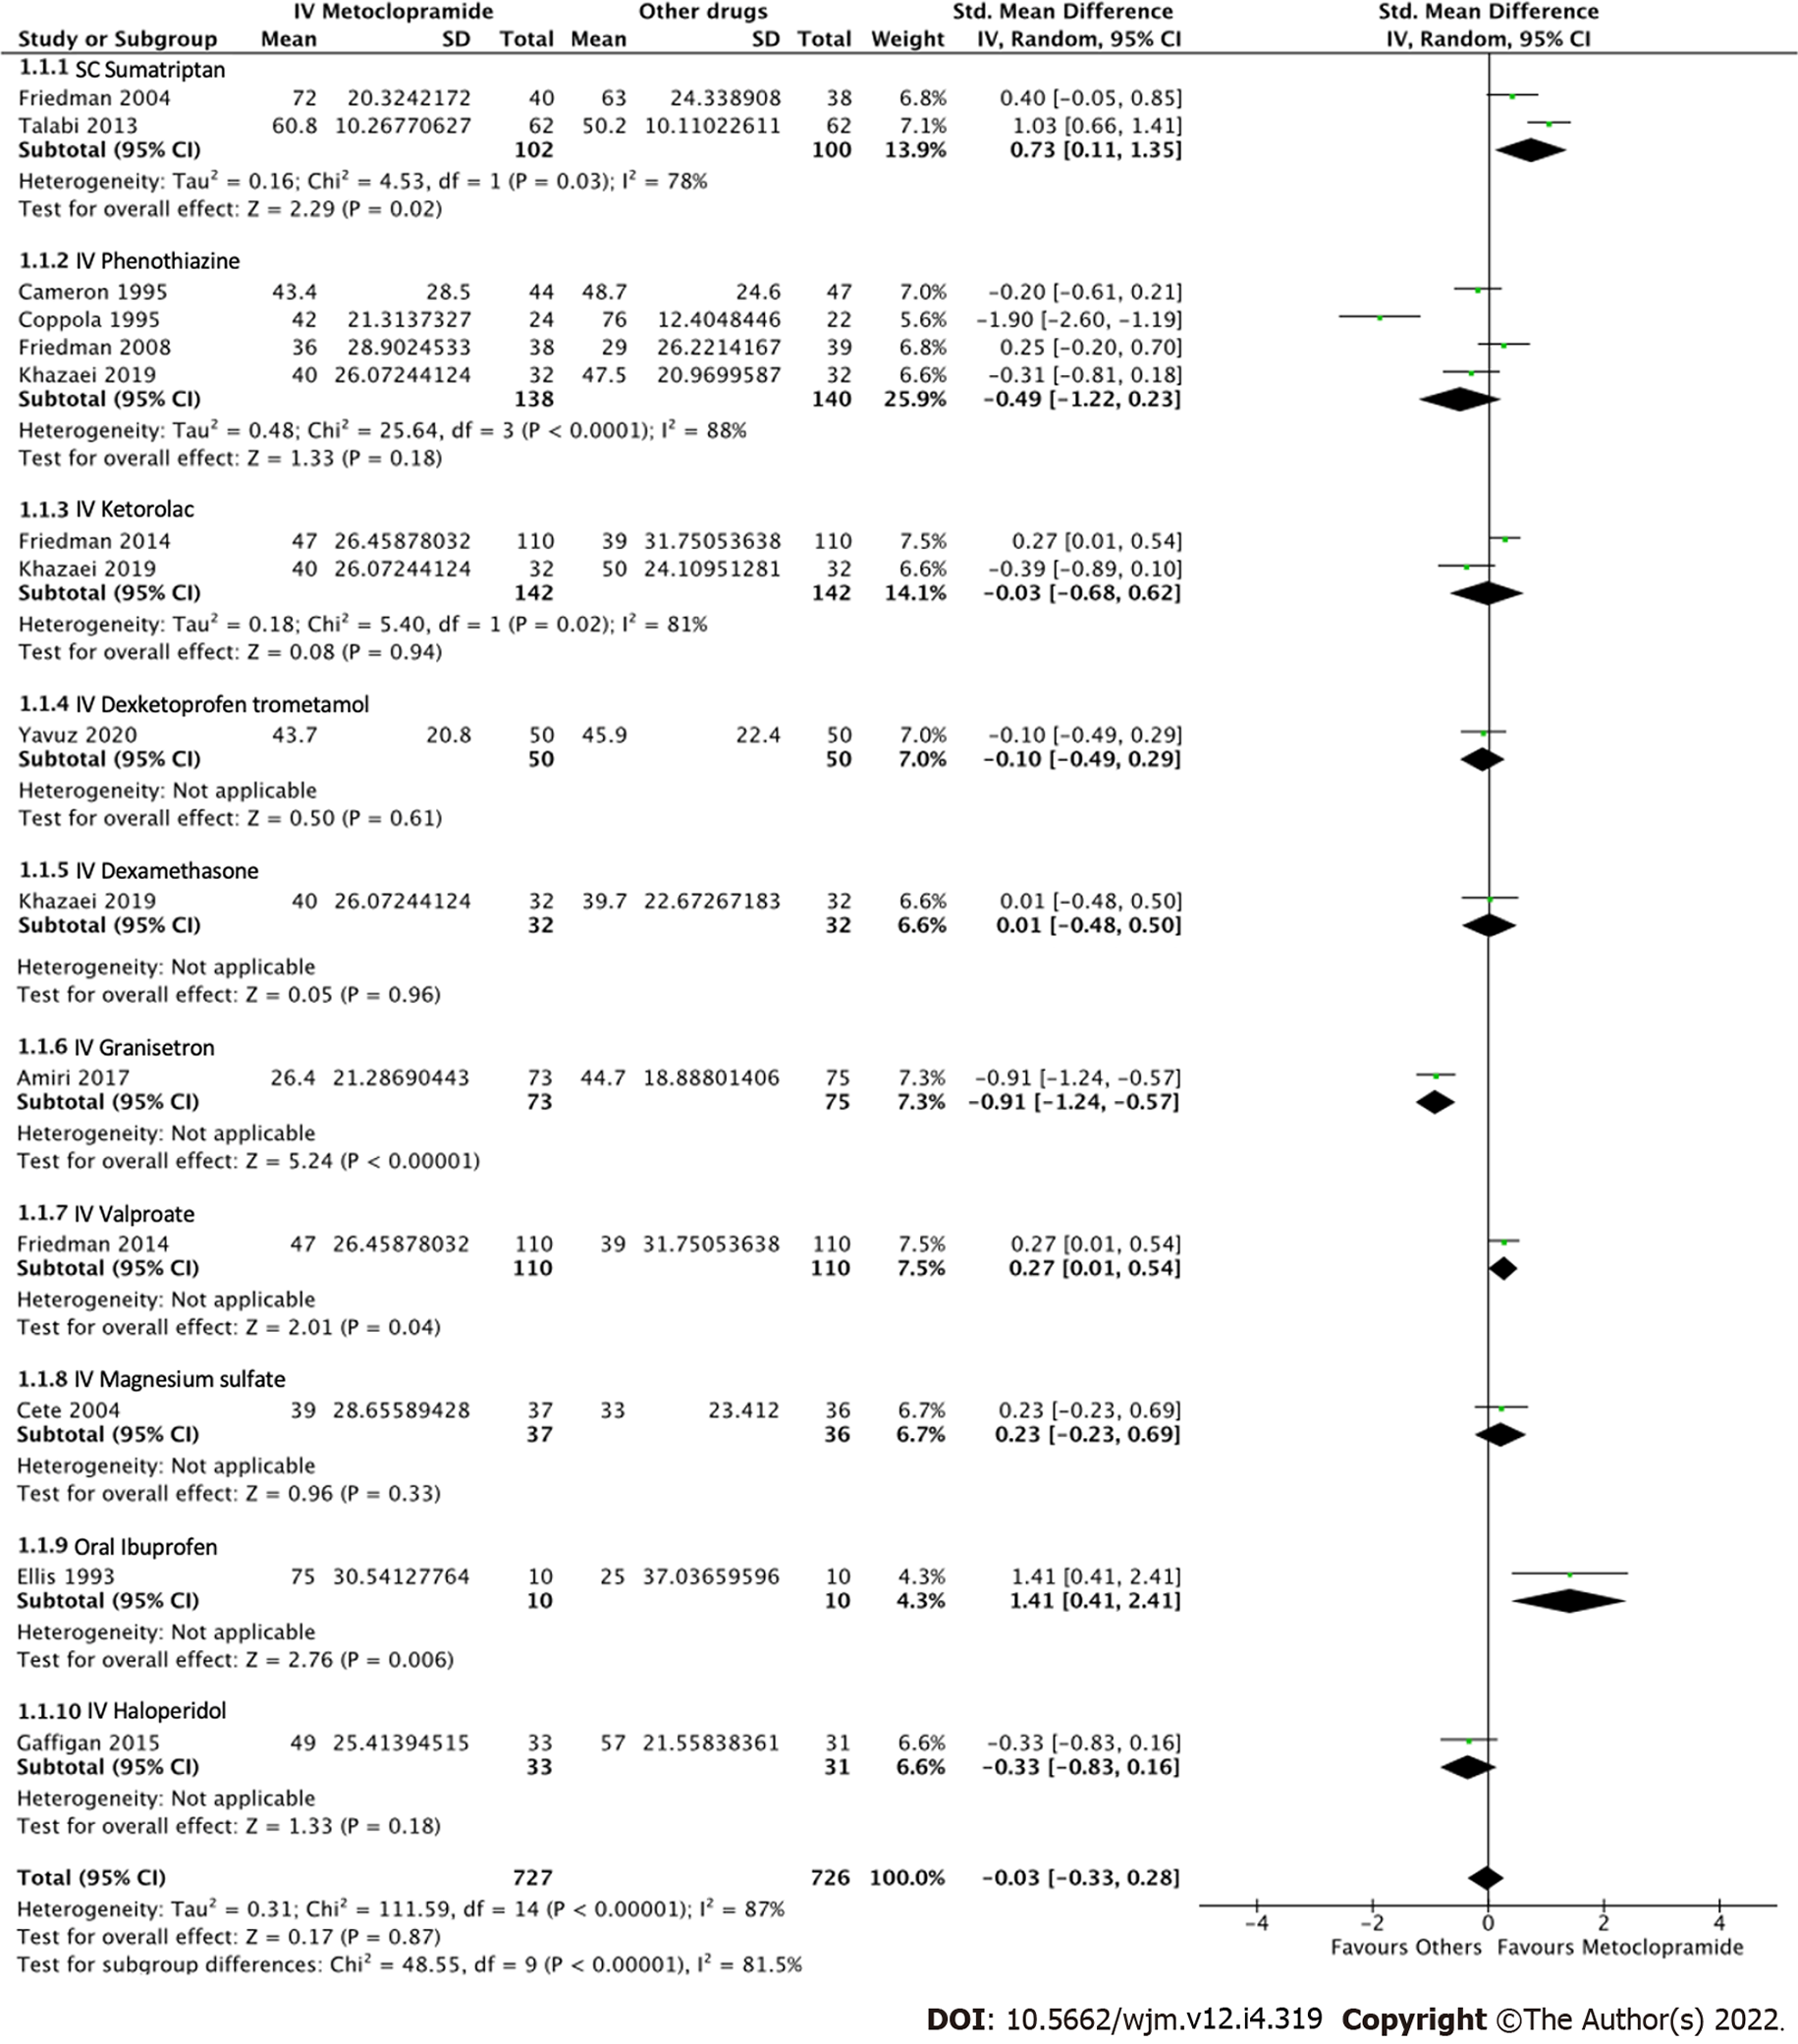
Figure 4 Forest plot comparing pain reduction at 60 min between intravenous metoclopramide and other drugs.
CI: Confidence interval; IV: Intravenous; SC: Subcutaneous.
Figure 5 Forest plot comparing pain reduction at 60 min between intravenous metoclopramide and placebo.
CI: Confidence interval; IV: Intravenous.
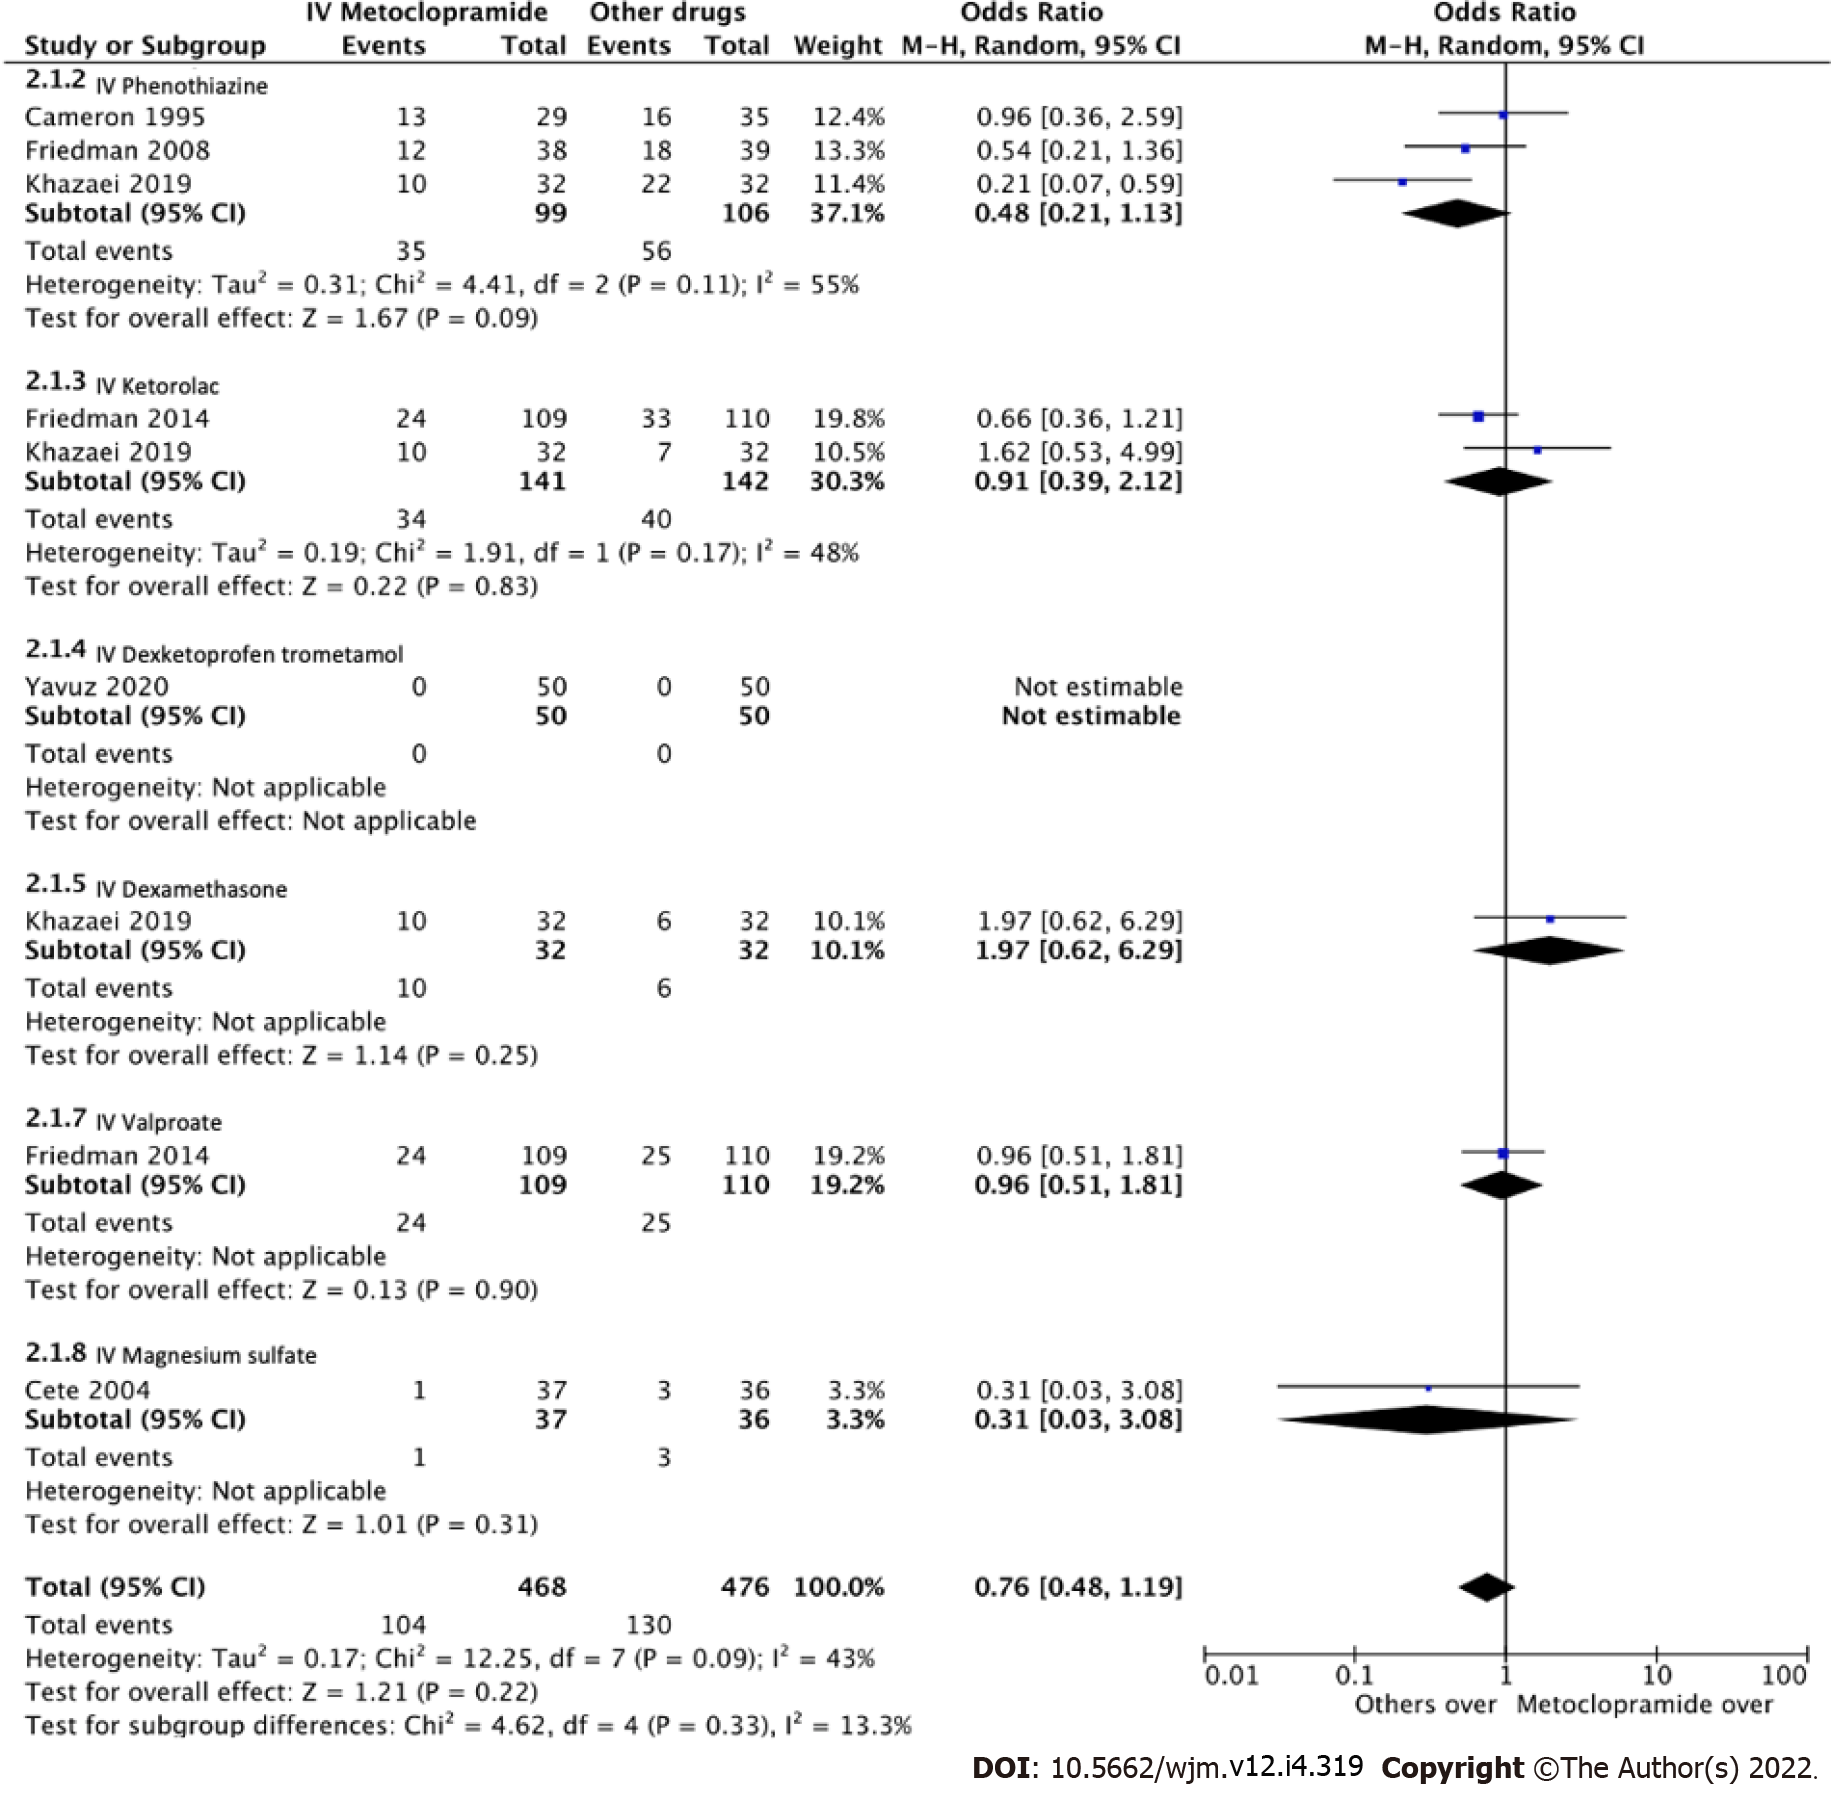
Figure 6 Forest plot comparing odds ratios of adverse effects between intravenous metoclopramide and other drugs.
CI: Confidence interval; IV: Intravenous.
Figure 7 Forest plot comparing odds ratios of adverse effects between intravenous metoclopramide and placebo.
CI: Confidence interval; IV: Intravenous.
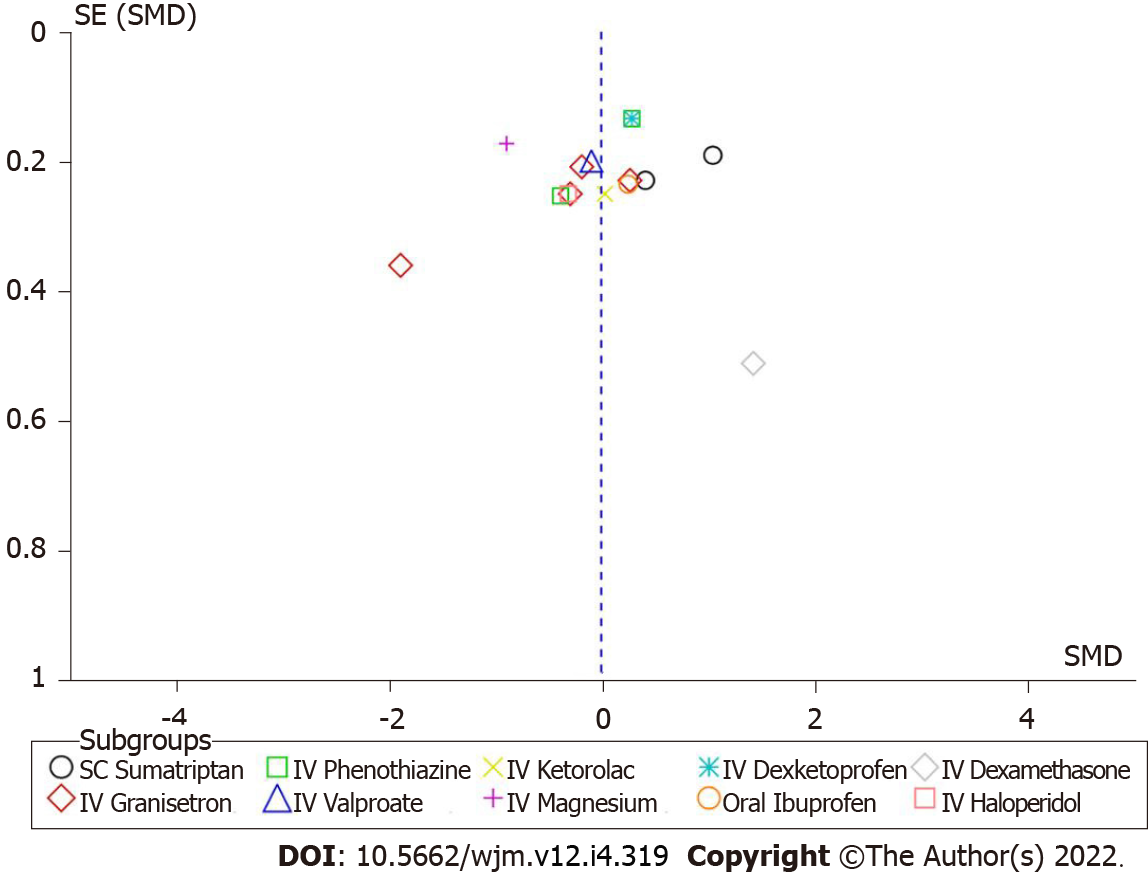
Figure 8 Funnel plot of pain reduction at 60 min between intravenous metoclopramide and other drugs.
IV: Intravenous; SC: Subcutaneous; SE: Standard error; SMD: Standard mean difference.
- Citation: Ungrungseesopon N, Wongtanasarasin W. Pain reduction and adverse effects of intravenous metoclopramide for acute migraine attack: A systematic review and meta-analysis of randomized-controlled trials. World J Methodol 2022; 12(4): 319-330
- URL: https://www.wjgnet.com/2222-0682/full/v12/i4/319.htm
- DOI: https://dx.doi.org/10.5662/wjm.v12.i4.319


