Copyright
©2013 Baishideng.
World J Transl Med. Aug 12, 2013; 2(2): 22-26
Published online Aug 12, 2013. doi: 10.5528/wjtm.v2.i2.22
Published online Aug 12, 2013. doi: 10.5528/wjtm.v2.i2.22
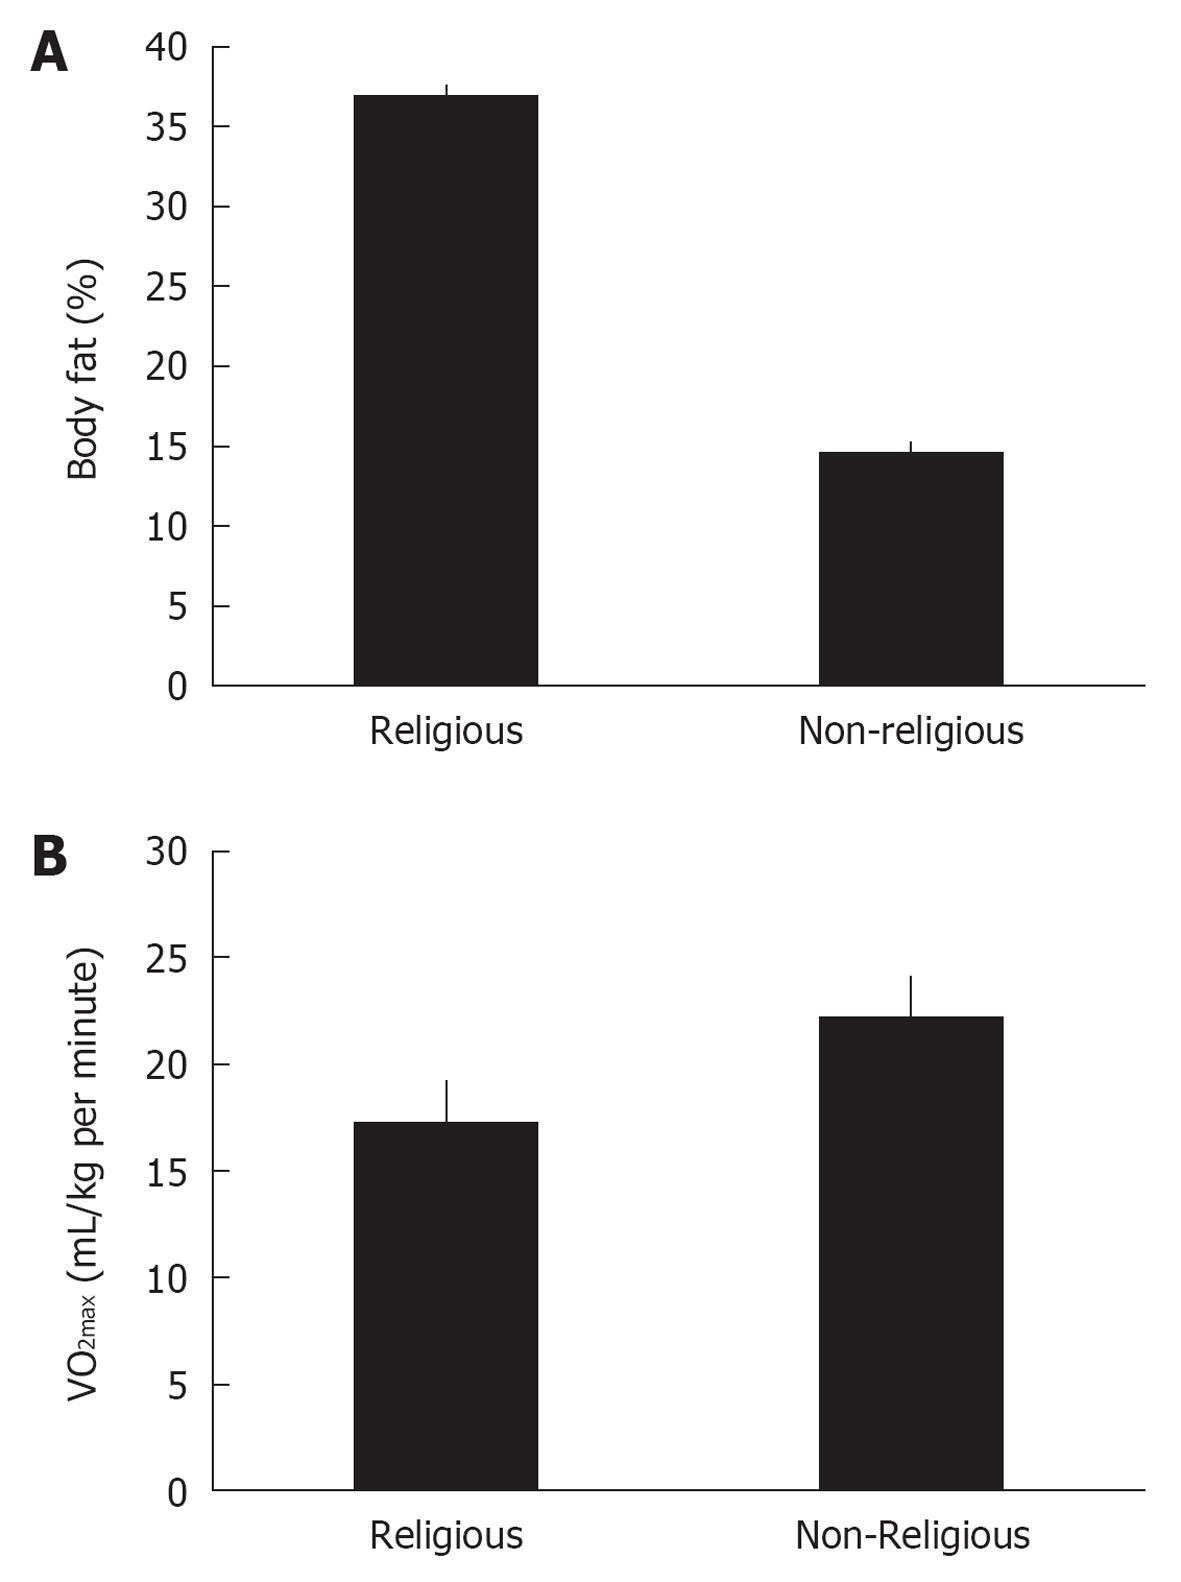
Figure 1 VO2max and body composition results.
A: Body fat percent; B: VO2max. Values are mean ± SE.
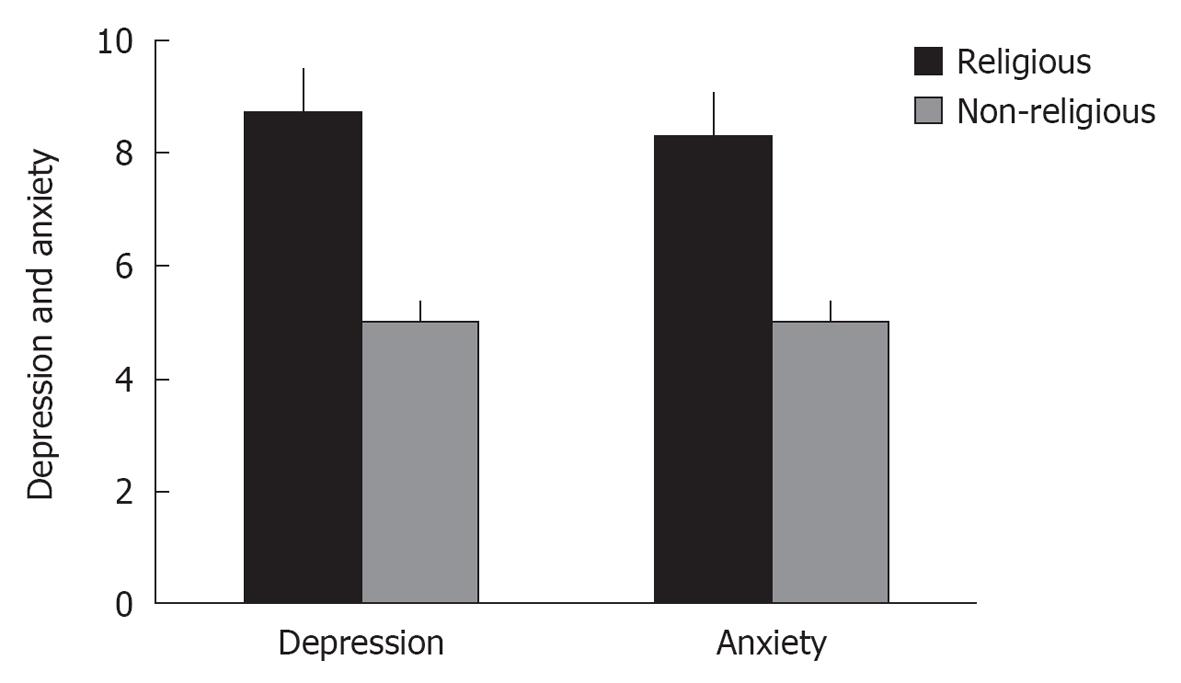
Figure 2 Depression and anxiety scores.
Values are mean ± SE, on a 10-point scale.
- Citation: Wonders KY, Loy H, Holt B, Bohachek K, Wise R. Examining the relationship between physical fitness and spiritual fitness in cancer patients: A pilot study. World J Transl Med 2013; 2(2): 22-26
- URL: https://www.wjgnet.com/2220-6132/full/v2/i2/22.htm
- DOI: https://dx.doi.org/10.5528/wjtm.v2.i2.22


