Copyright
©The Author(s) 2022.
World J Transl Med. Aug 6, 2022; 10(2): 14-28
Published online Aug 6, 2022. doi: 10.5528/wjtm.v10.i2.14
Published online Aug 6, 2022. doi: 10.5528/wjtm.v10.i2.14
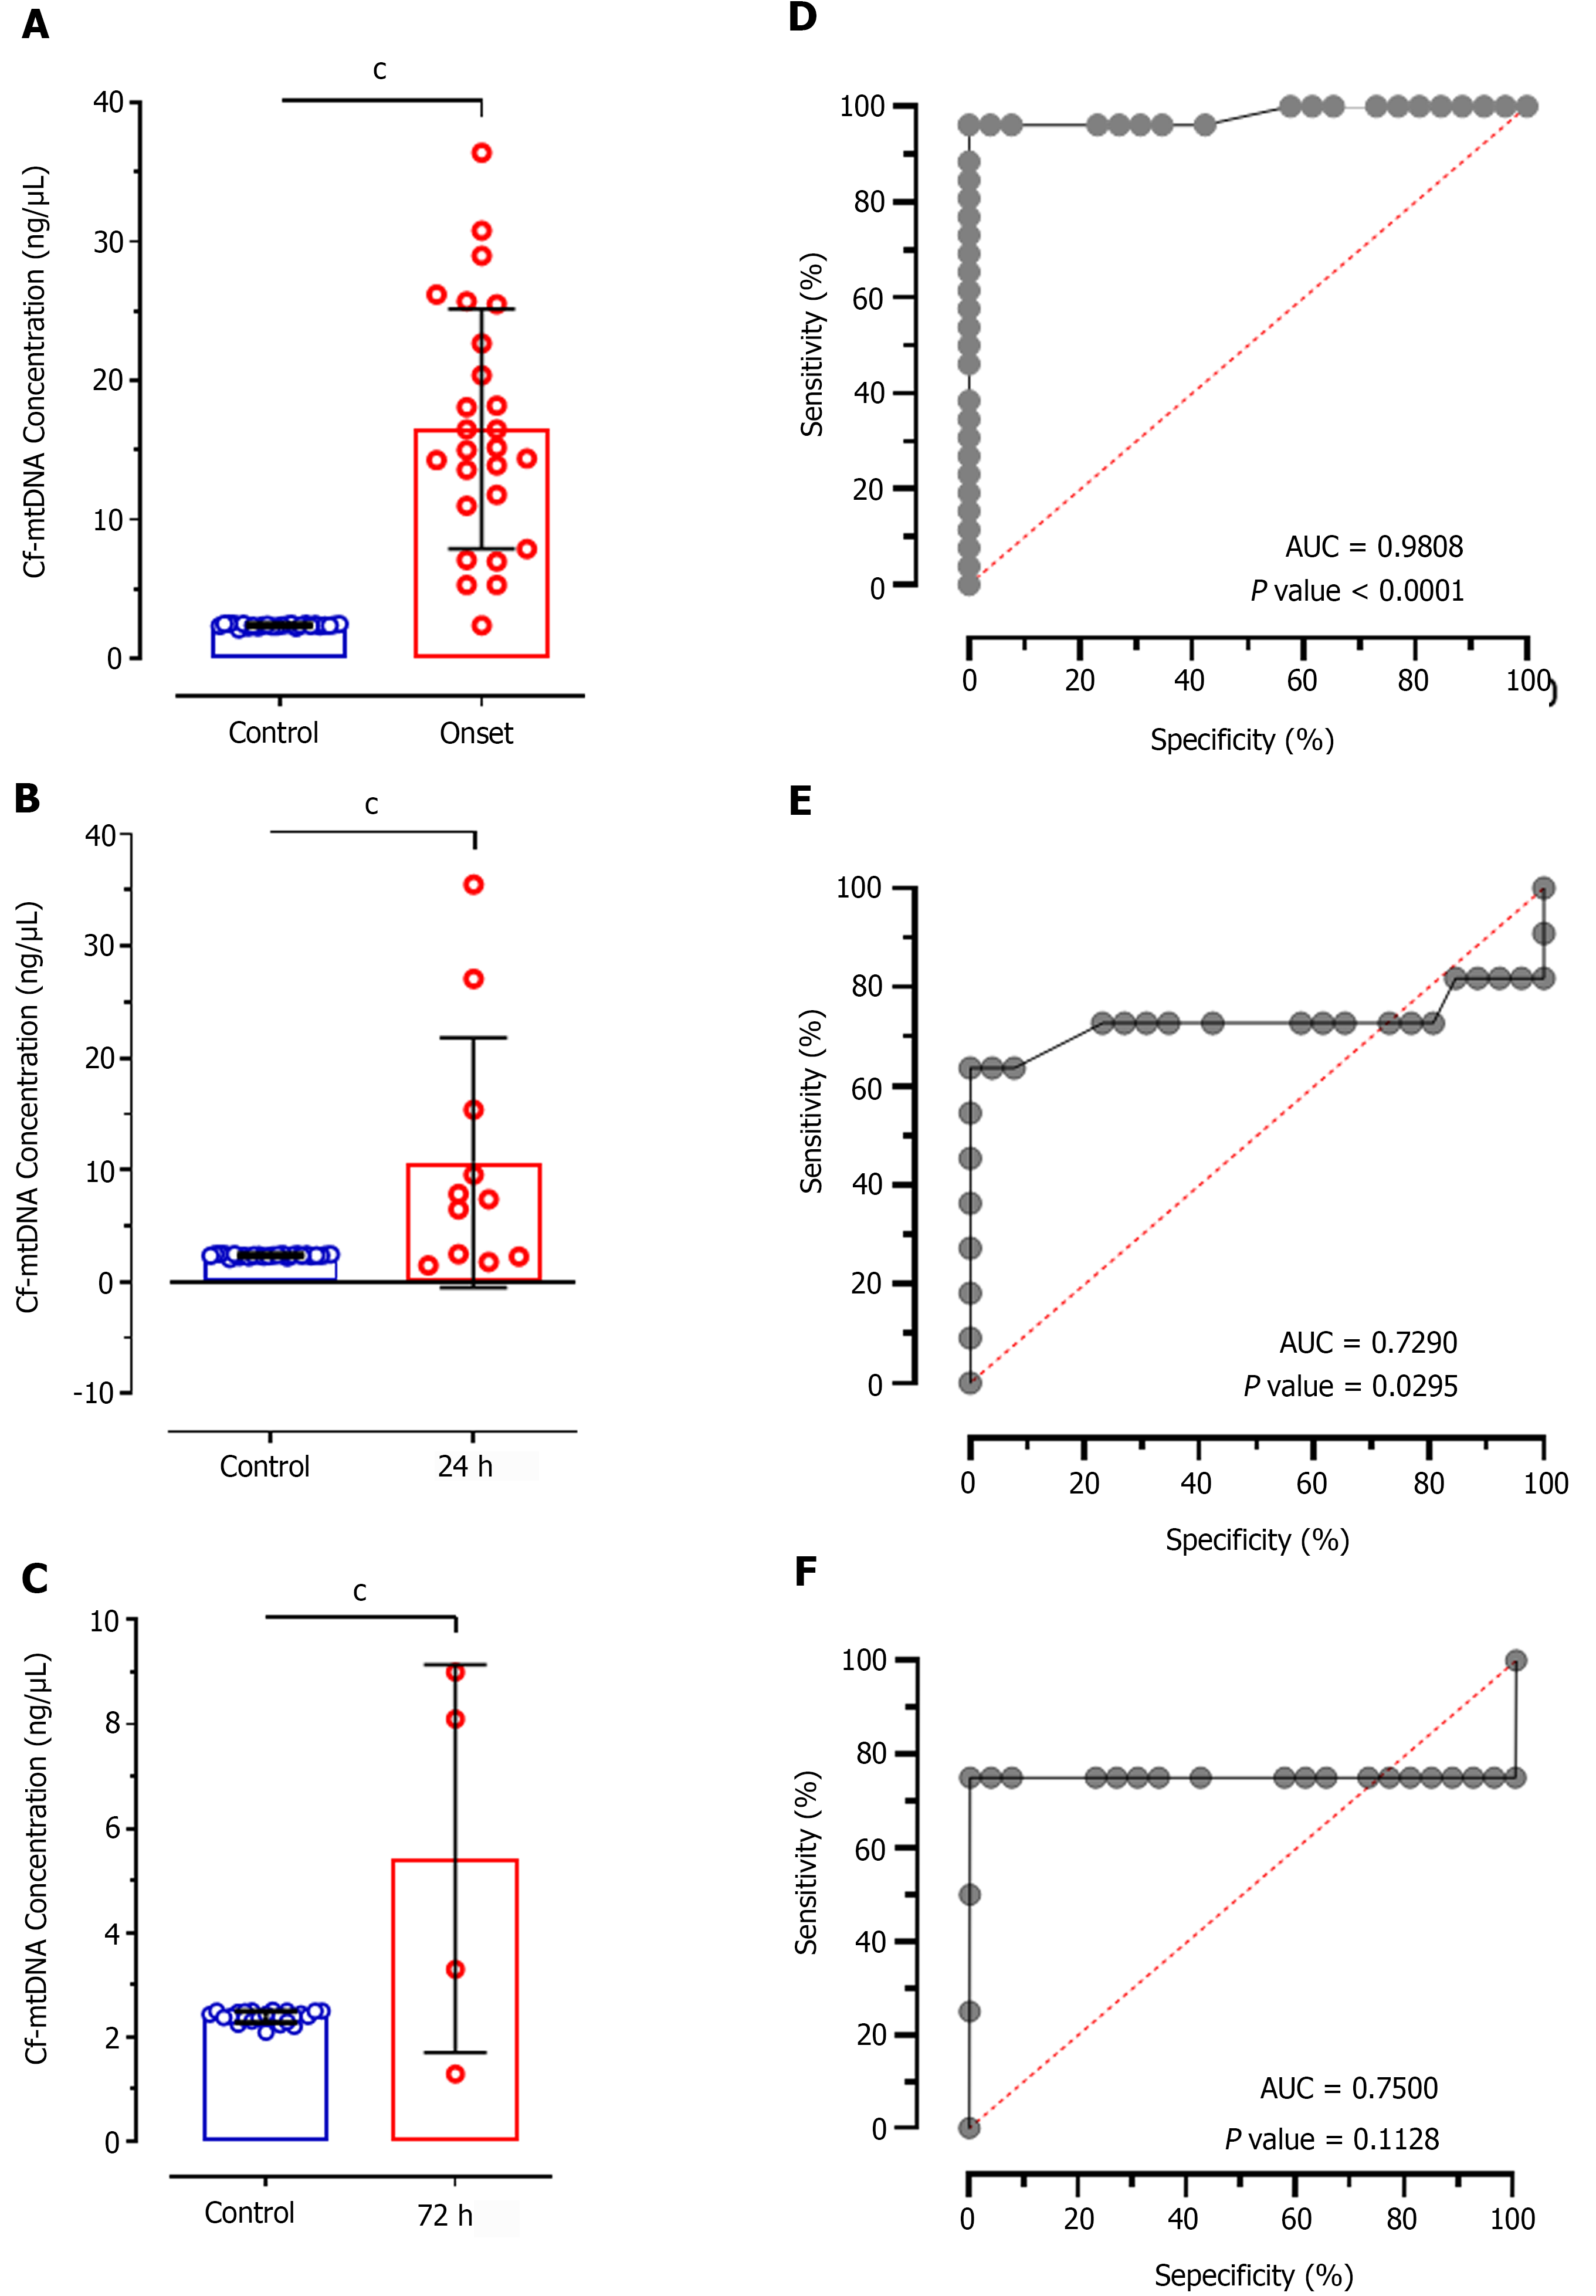
Figure 1 Difference in cell-free mitochondrial DNA concentrations and their diagnostic value in patients after treatment.
A-C: Significantly increased levels of cell-free mitochondrial DNA (cf-mtDNA) were observed in patients at disease onset 24 h of treatment and 72 h of treatment compared to control individuals; D-F: Relative operative curve plots showing the diagnostic value of cf-mtDNA concentrations for discriminating the patients at disease onset 24 h of treatment, and 72 h of treatment. cP < 0.0001. AUC: Area under curve; cf-mtDNA: Cell-free mitochondrial DNA; ROC: Receiver operating characteristic.
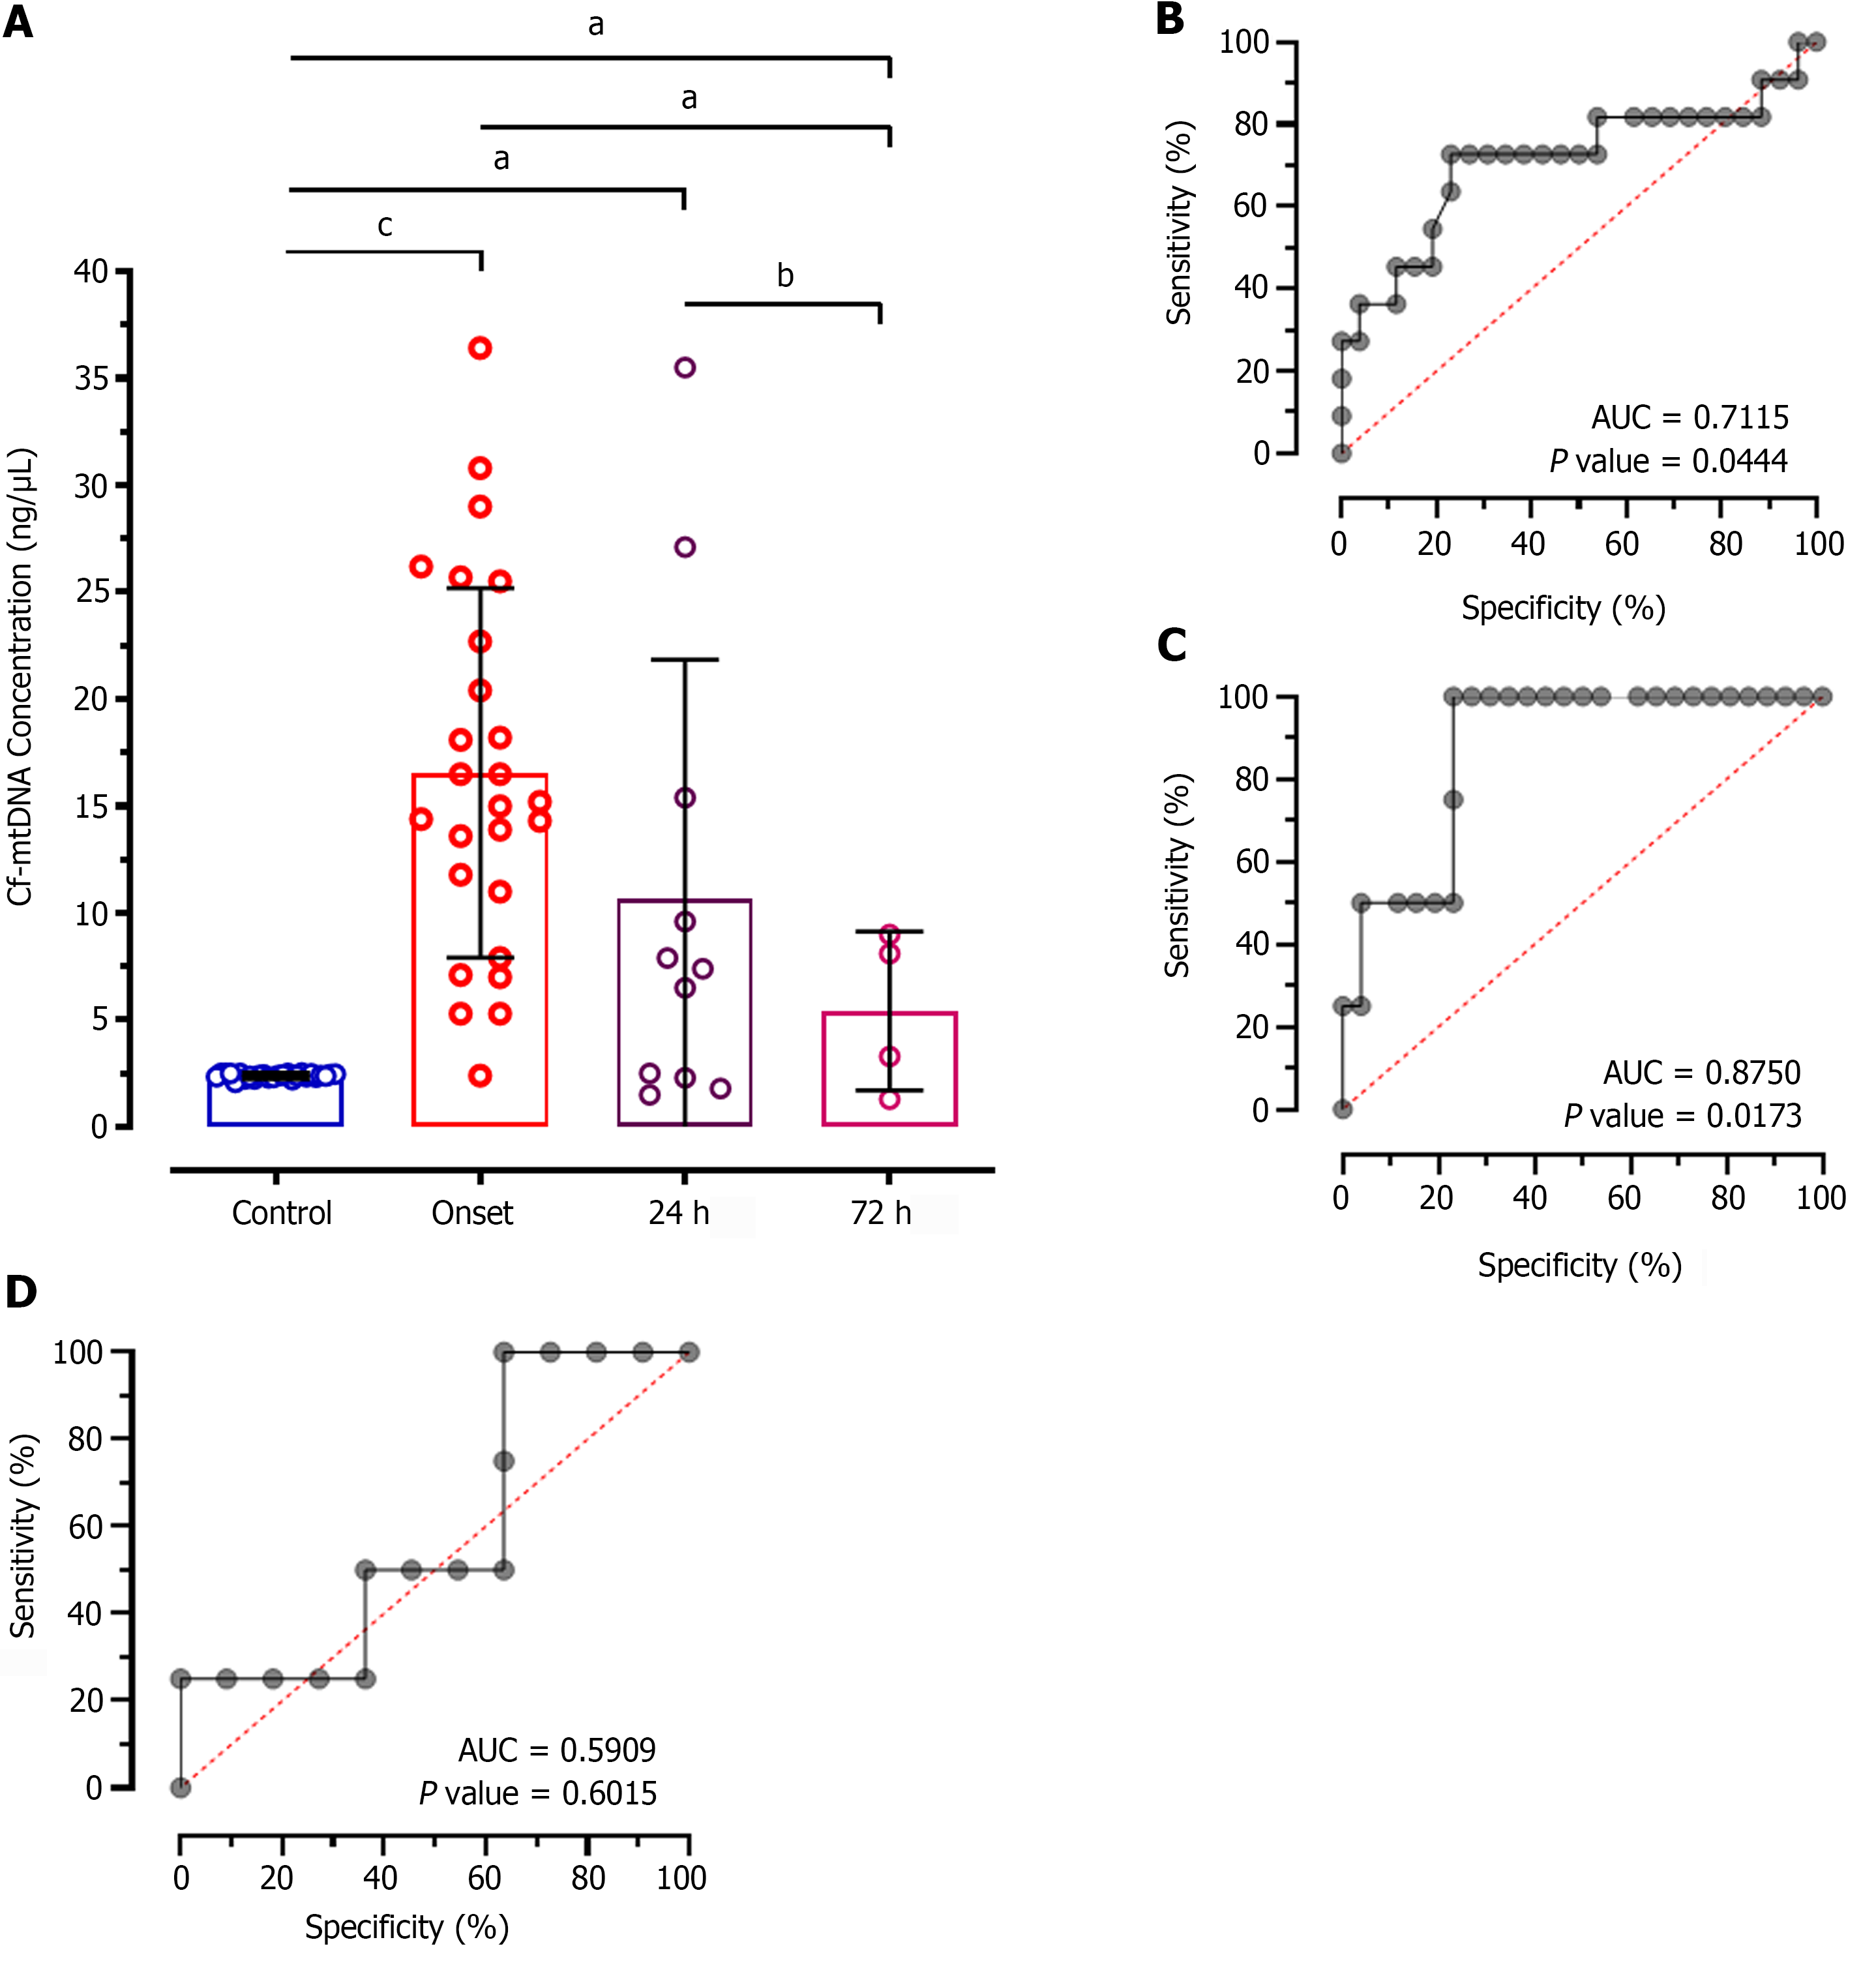
Figure 2 Intergroup differences in cell-free mitochondrial DNA concentrations and their diagnostic value in patients at disease onset and treatment.
A: Significantly decreased cell-free mitochondrial DNA (cf-mtDNA) concentration was observed after 72 h of treatment compared to patients at disease onset aP < 0.01; B-D: Receiver operating characteristic plots showing the diagnostic significance of cf-mtDNA concentrations for discriminating patients at disease onset with 24 h of treatment, and 72 h of treatment. bP < 0.001; cP < 0.0001. AUC: Area under curve; cf-mtDNA: Cell-free mitochondrial DNA; ROC: Receiver operating characteristic.
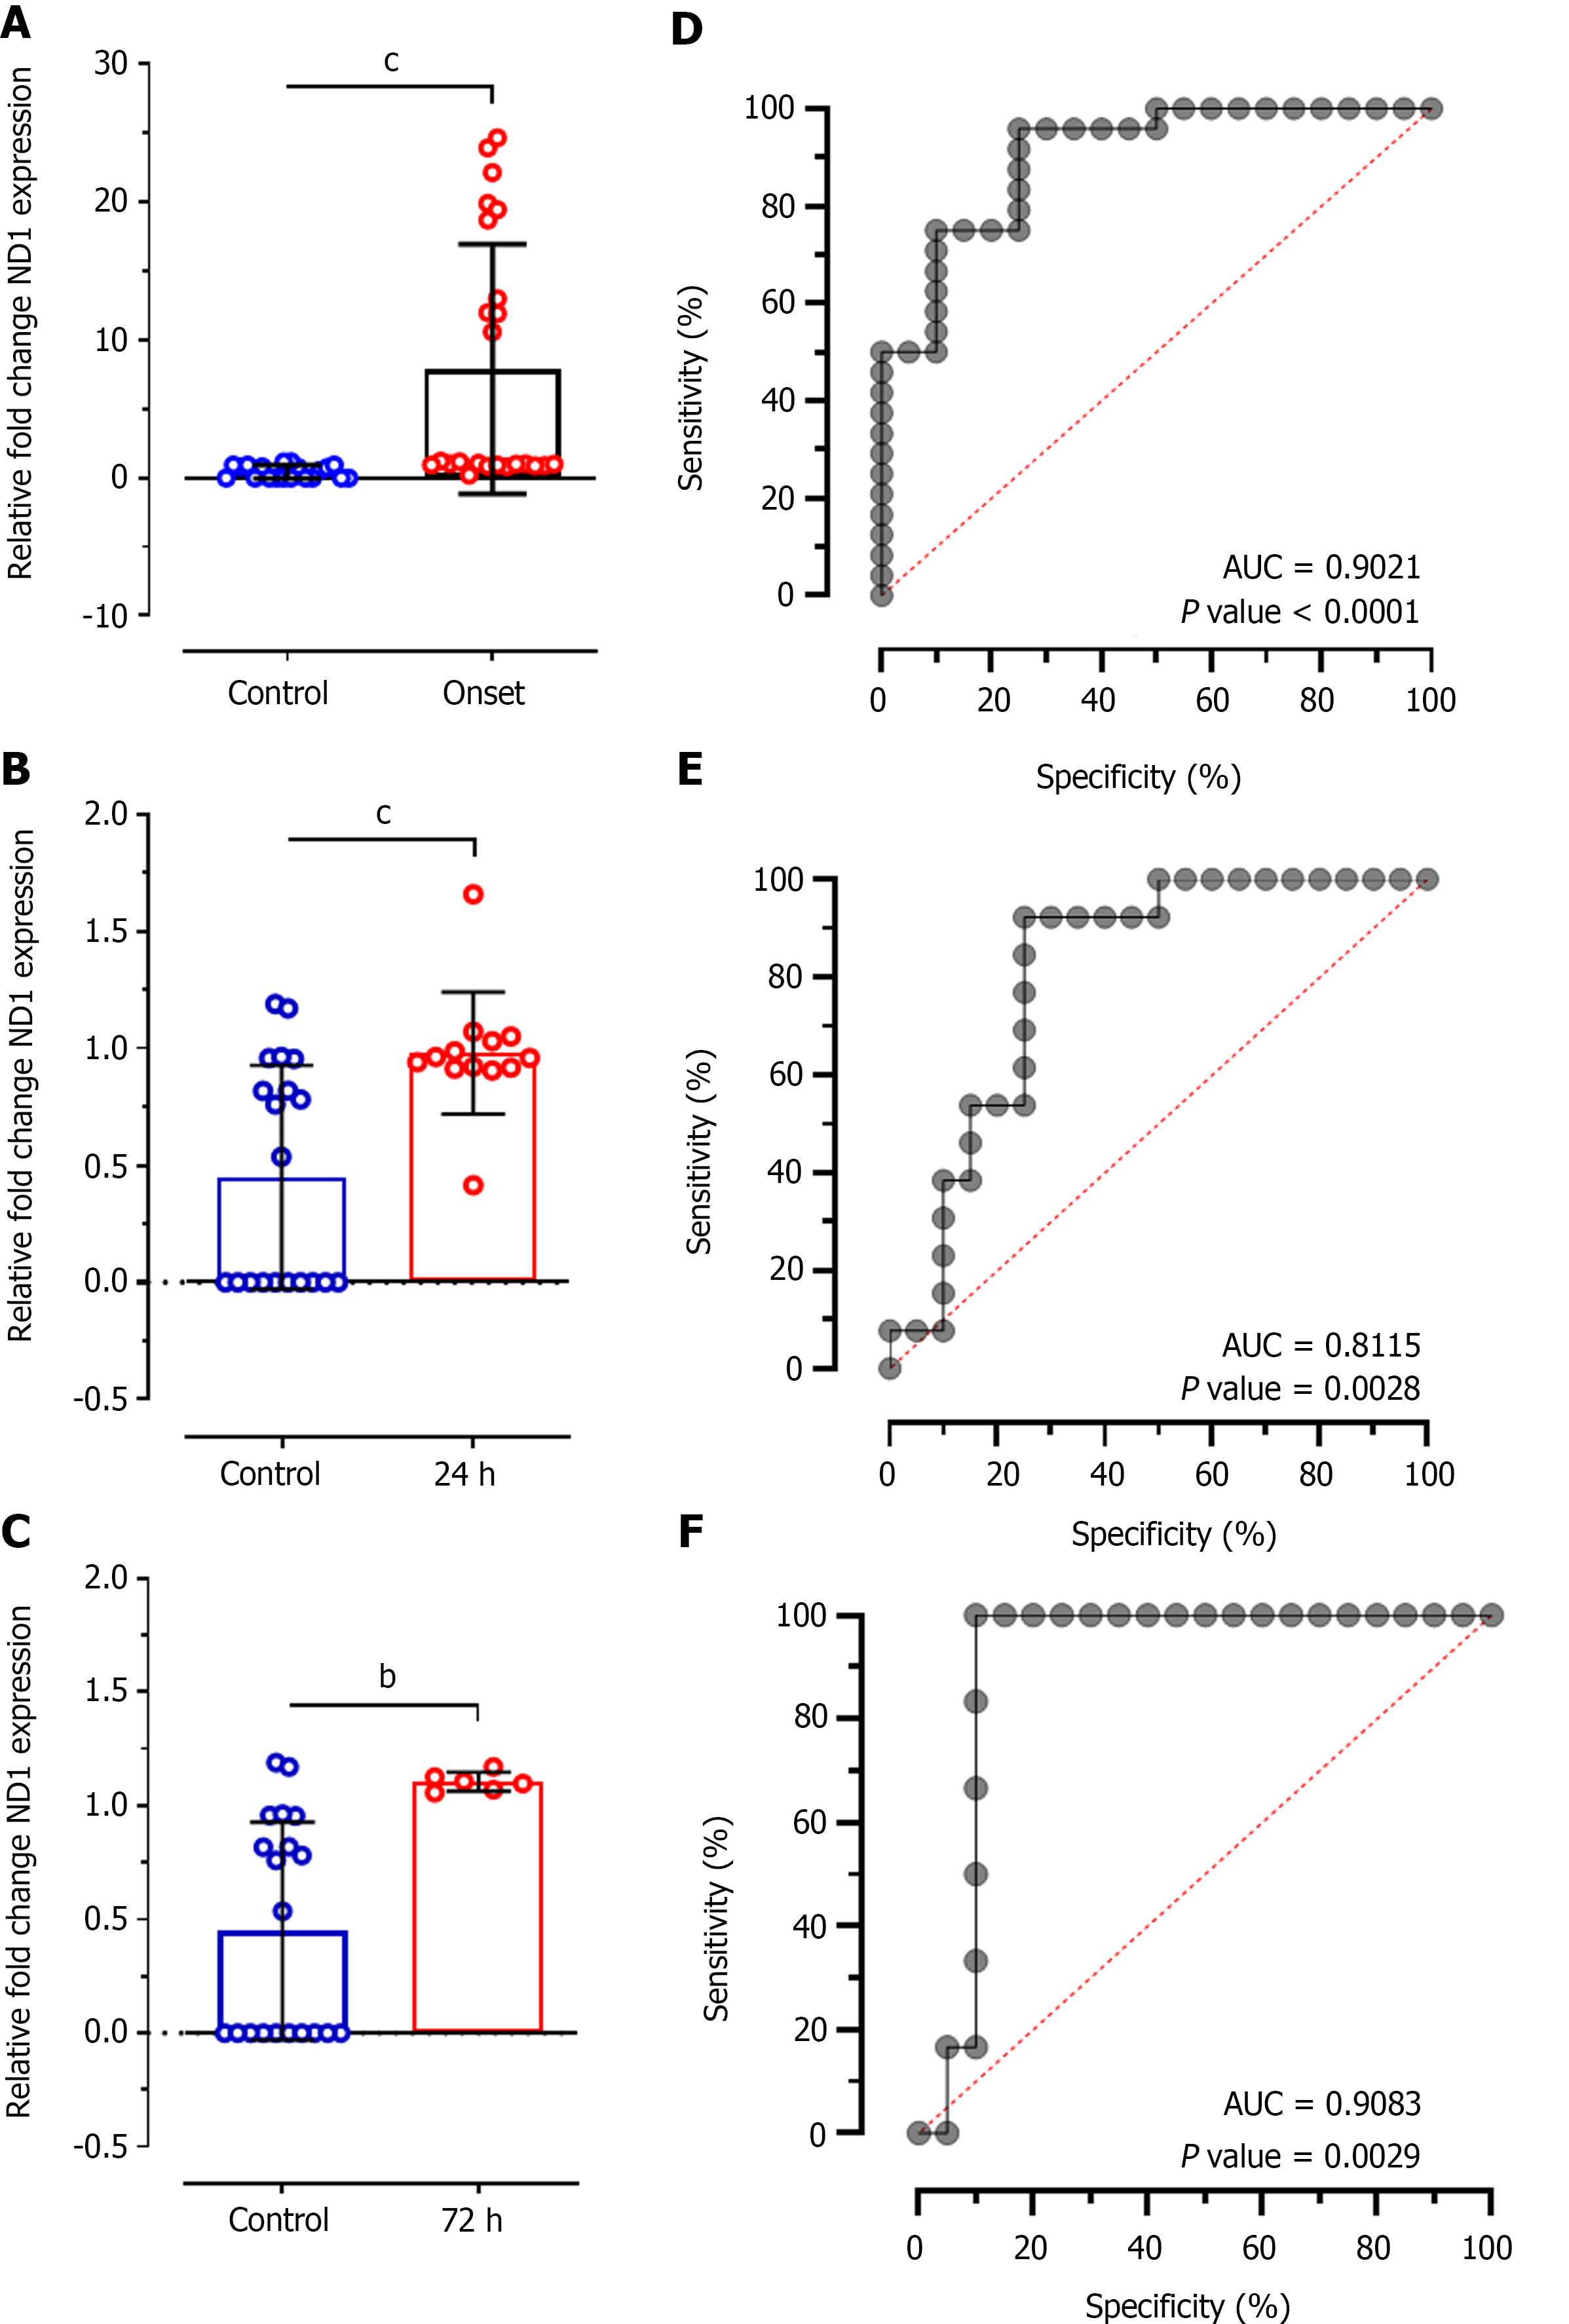
Figure 3 Intergroup differences in cell-free mitochondrial DNA concentrations.
A-C: Changes in relative expression levels of NADH-ubiquinone oxidoreductase chain 1 (ND1) compared to 12S expression between control individuals and patients at disease onset, 24 h of treatment, and 72 h of treatment; D-F: Receiver operating characteristic plot showing the diagnostic significance of ND1 relative expression levels in patients at disease onset, 24 h of treatment, and 72 h of treatment. bP < 0.001; cP < 0.0001. AUC: Area under curve; cf-mtDNA: Cell-free mitochondrial DNA; ROC: Receiver operating characteristic.
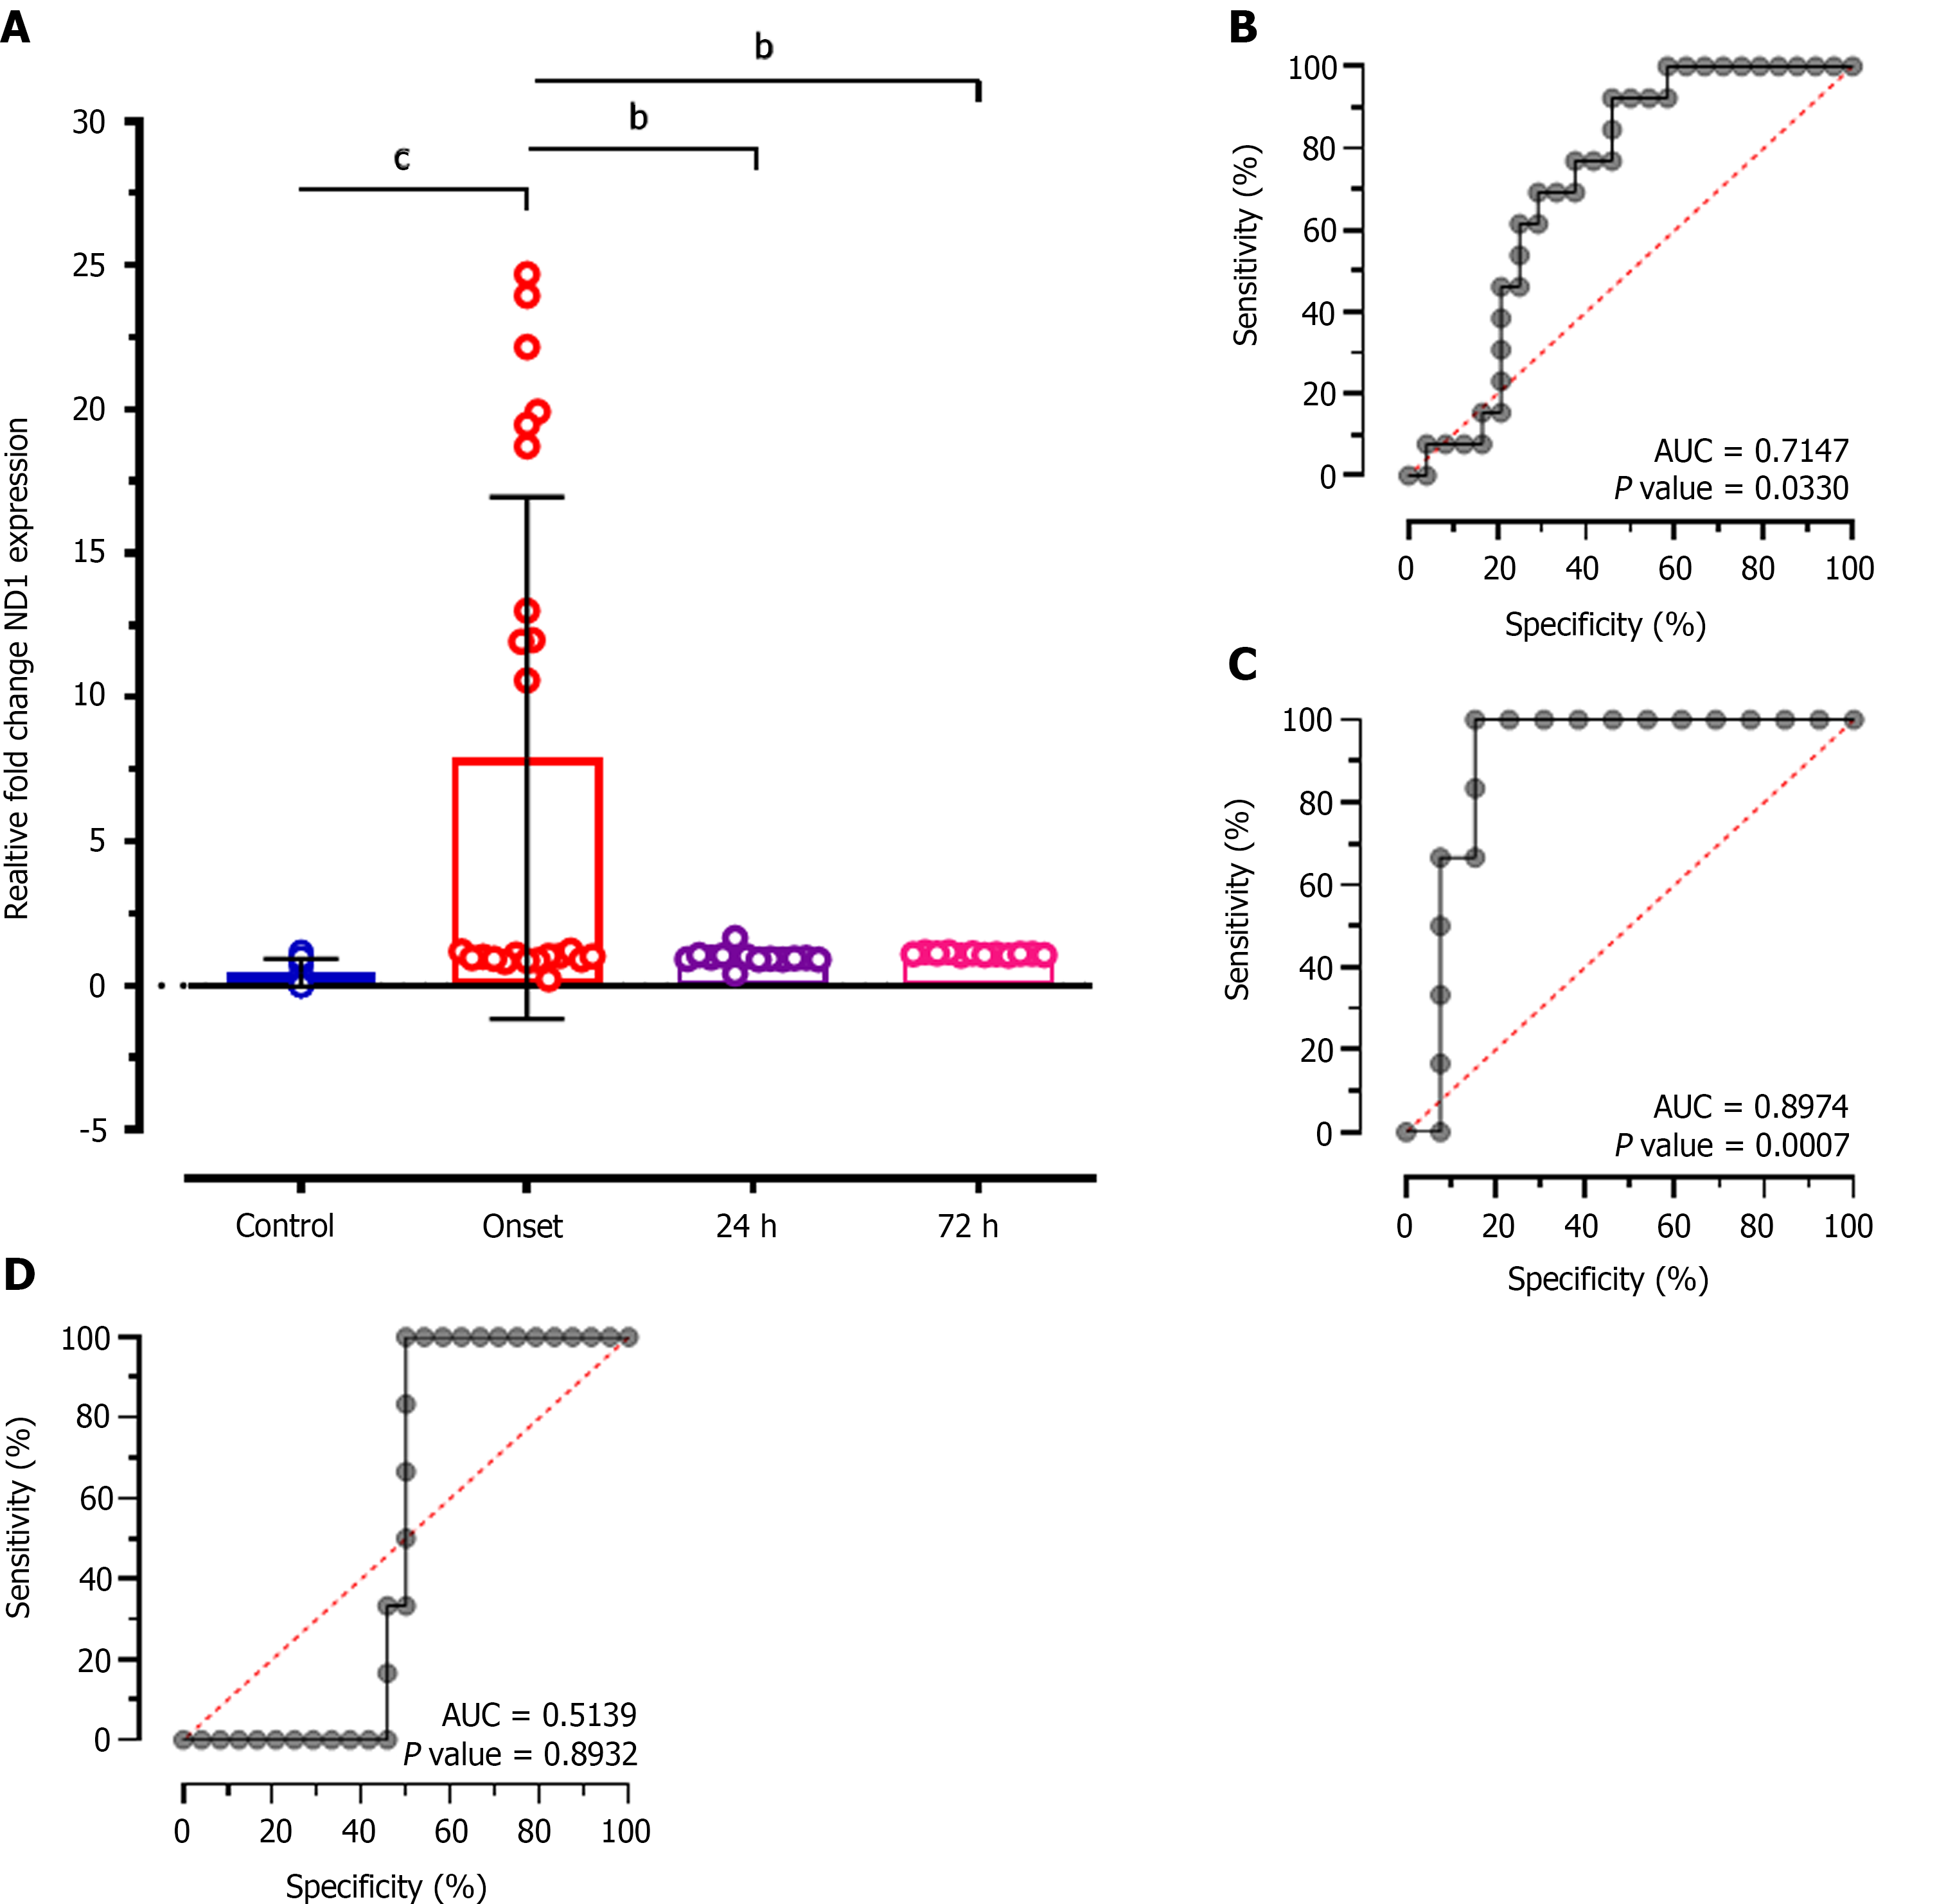
Figure 4 Multiple comparison test showing intergroup differences in NADH dehydrogenase 1 relative expression levels and its diagnostic significance.
A: Significantly decreased NADH dehydrogenase 1 (ND1) relative expression levels were observed after 24 h and 72 h of treatment compared to patients at disease onset (bP < 0.001) and were comparable to controls; B-D: Receiver operating characteristic plots show the association of ND1 expression levels between patients at disease onset, 24 h of treatment, and 72 h of treatment. bP < 0.001; cP < 0.0001. AUC: Area under curve; ND1: NADH dehydrogenase 1; ROC: Receiver operating characteristic.
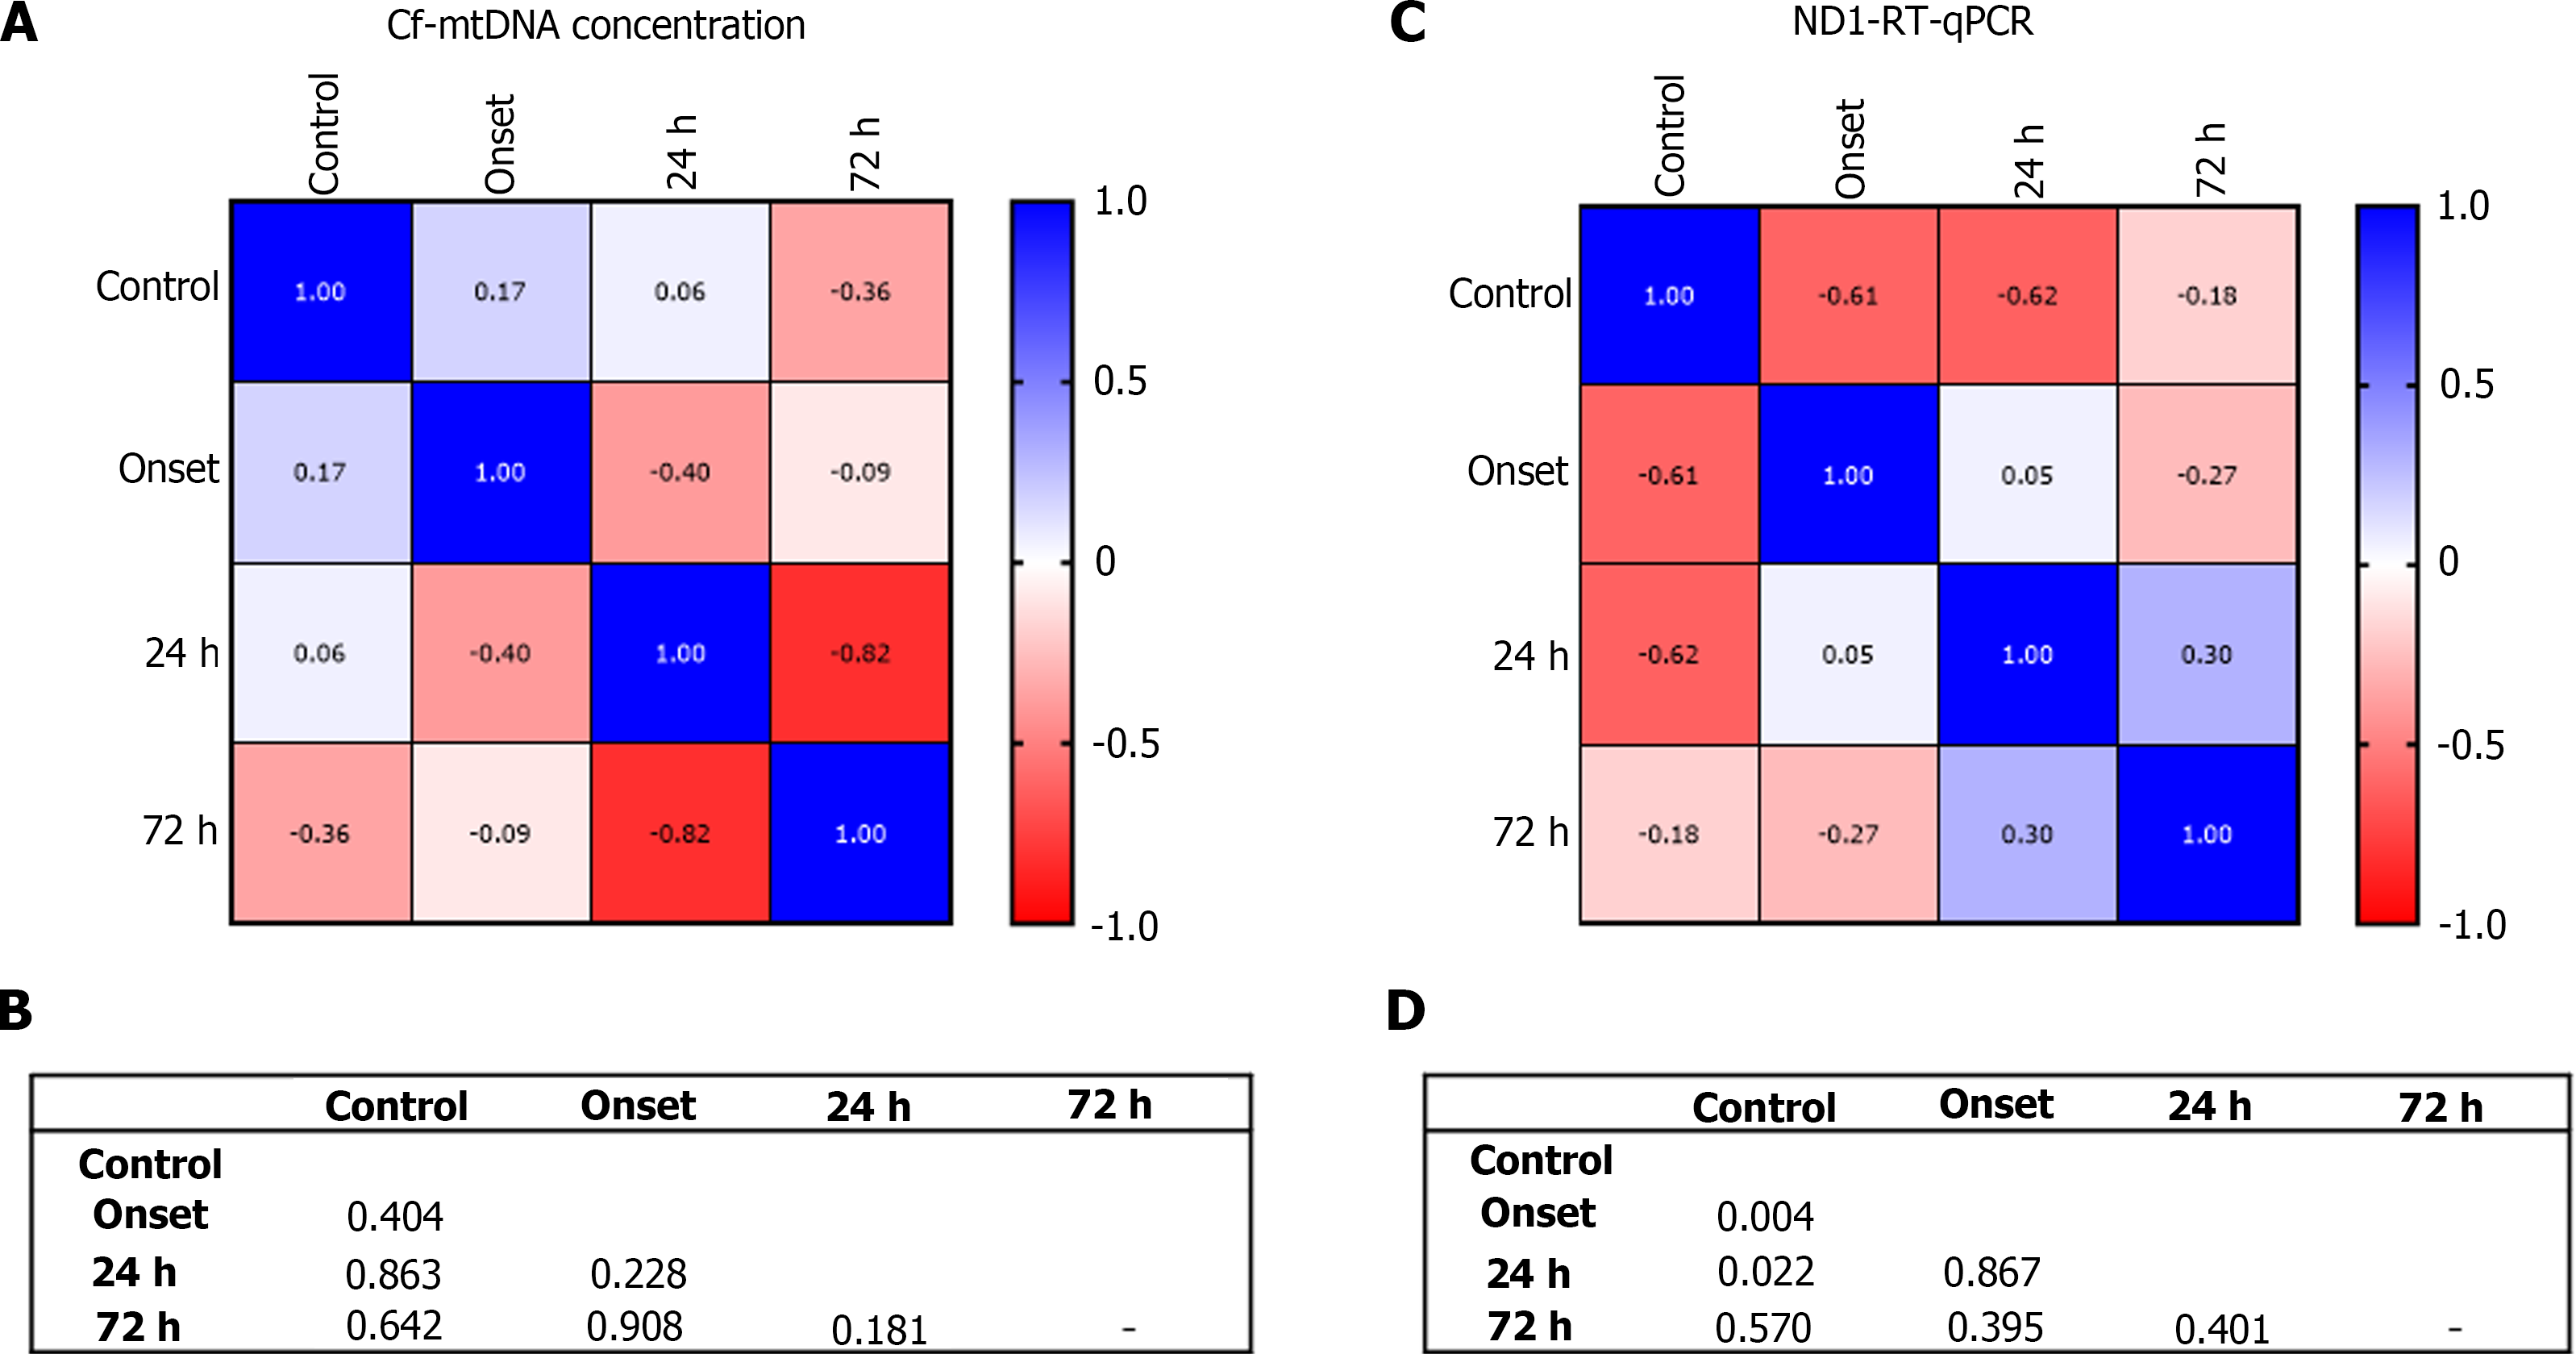
Figure 5 Correlation analysis showing differences in cell-free mitochondrial DNA concentration and relative expression levels of NADH dehydrogenase 1 among different groups.
A: Heat map showing correlation coefficient r values represented within the heat map; B: P values showing differences in the association of cell-free mitochondrial DNA concentration among different groups; C: Heat map showing correlation coefficient r values represented within the heat map of ND1 relative expression; D: P values showing differences in the association of relative ND1 expression levels among different groups. Cf-mtDNA: Cell-free mitochondrial DNA; ND1: NADH dehydrogenase 1.
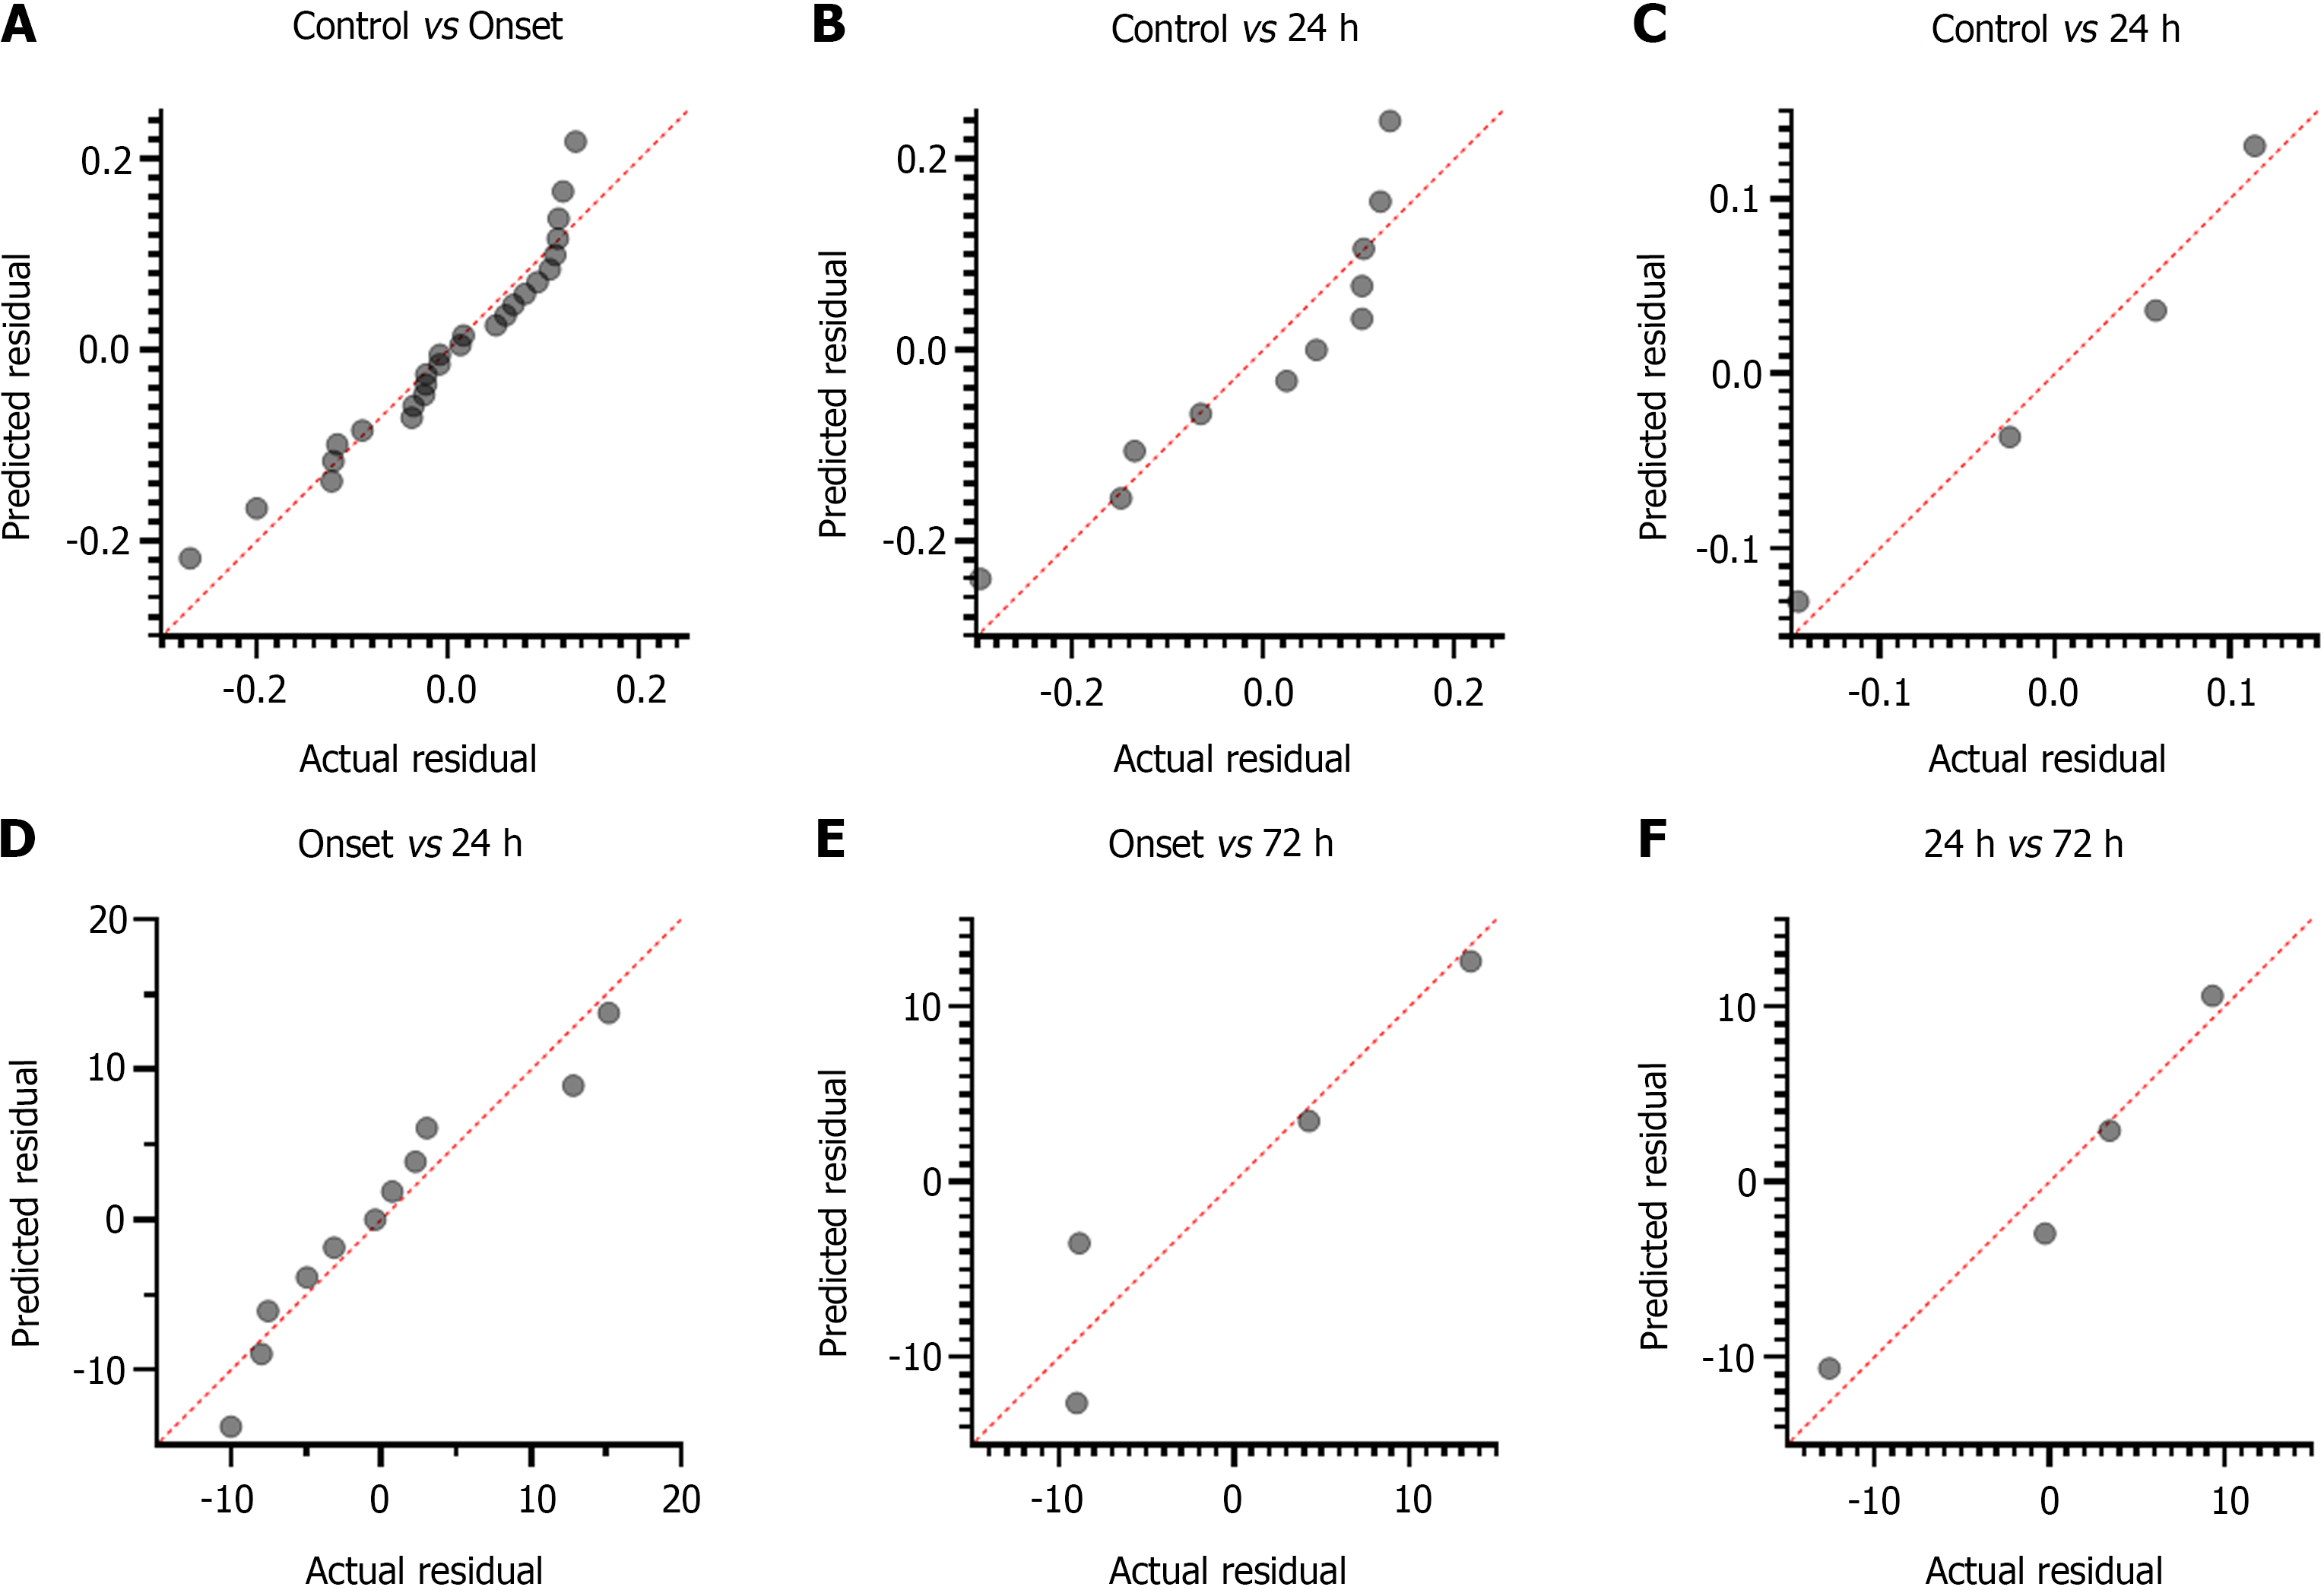
Figure 6 Multiple linear regression analysis.
A-F: Multiple linear regression analysis of cf-mtDNA concentration between different groups showing their deviation and relationship with linear response. Cf-mtDNA: Cell-free mitochondrial DNA.
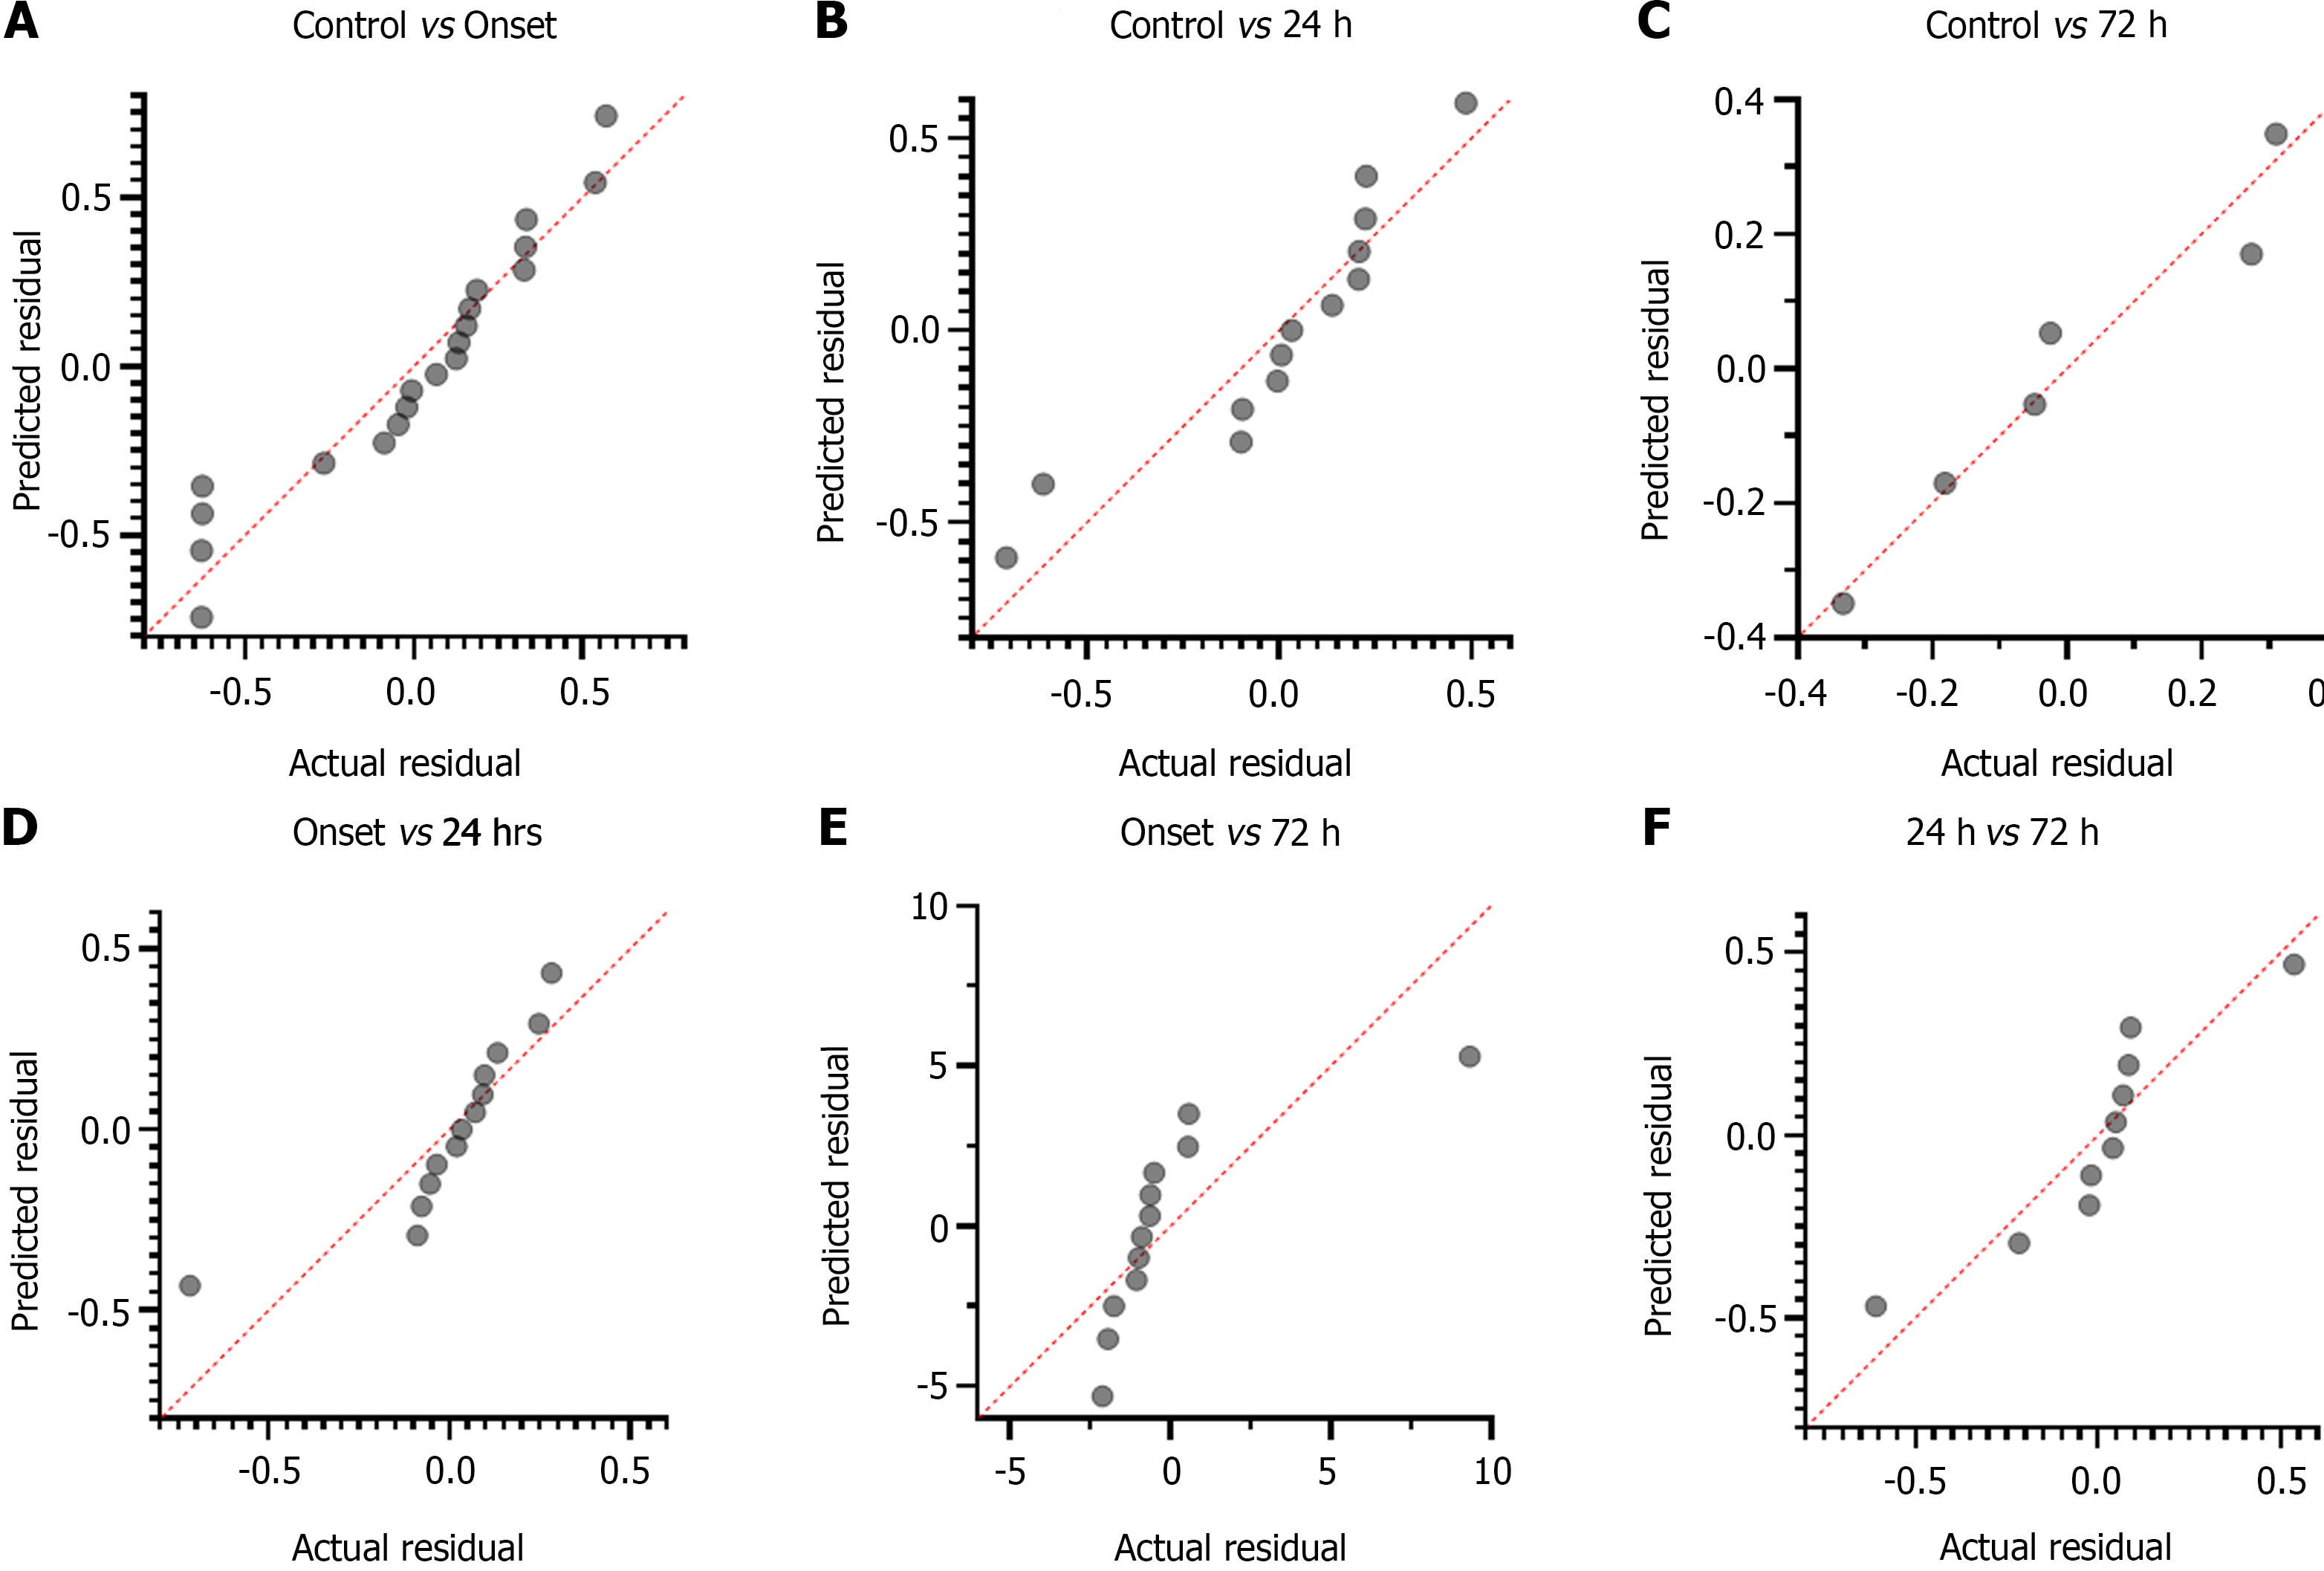
Figure 7 Multiple linear regression analysis.
A-F: Multiple linear regression analysis of ND1 relative expression levels between different groups showing their deviation and relationship with linear response. ND1: NADH dehydrogenase 1.
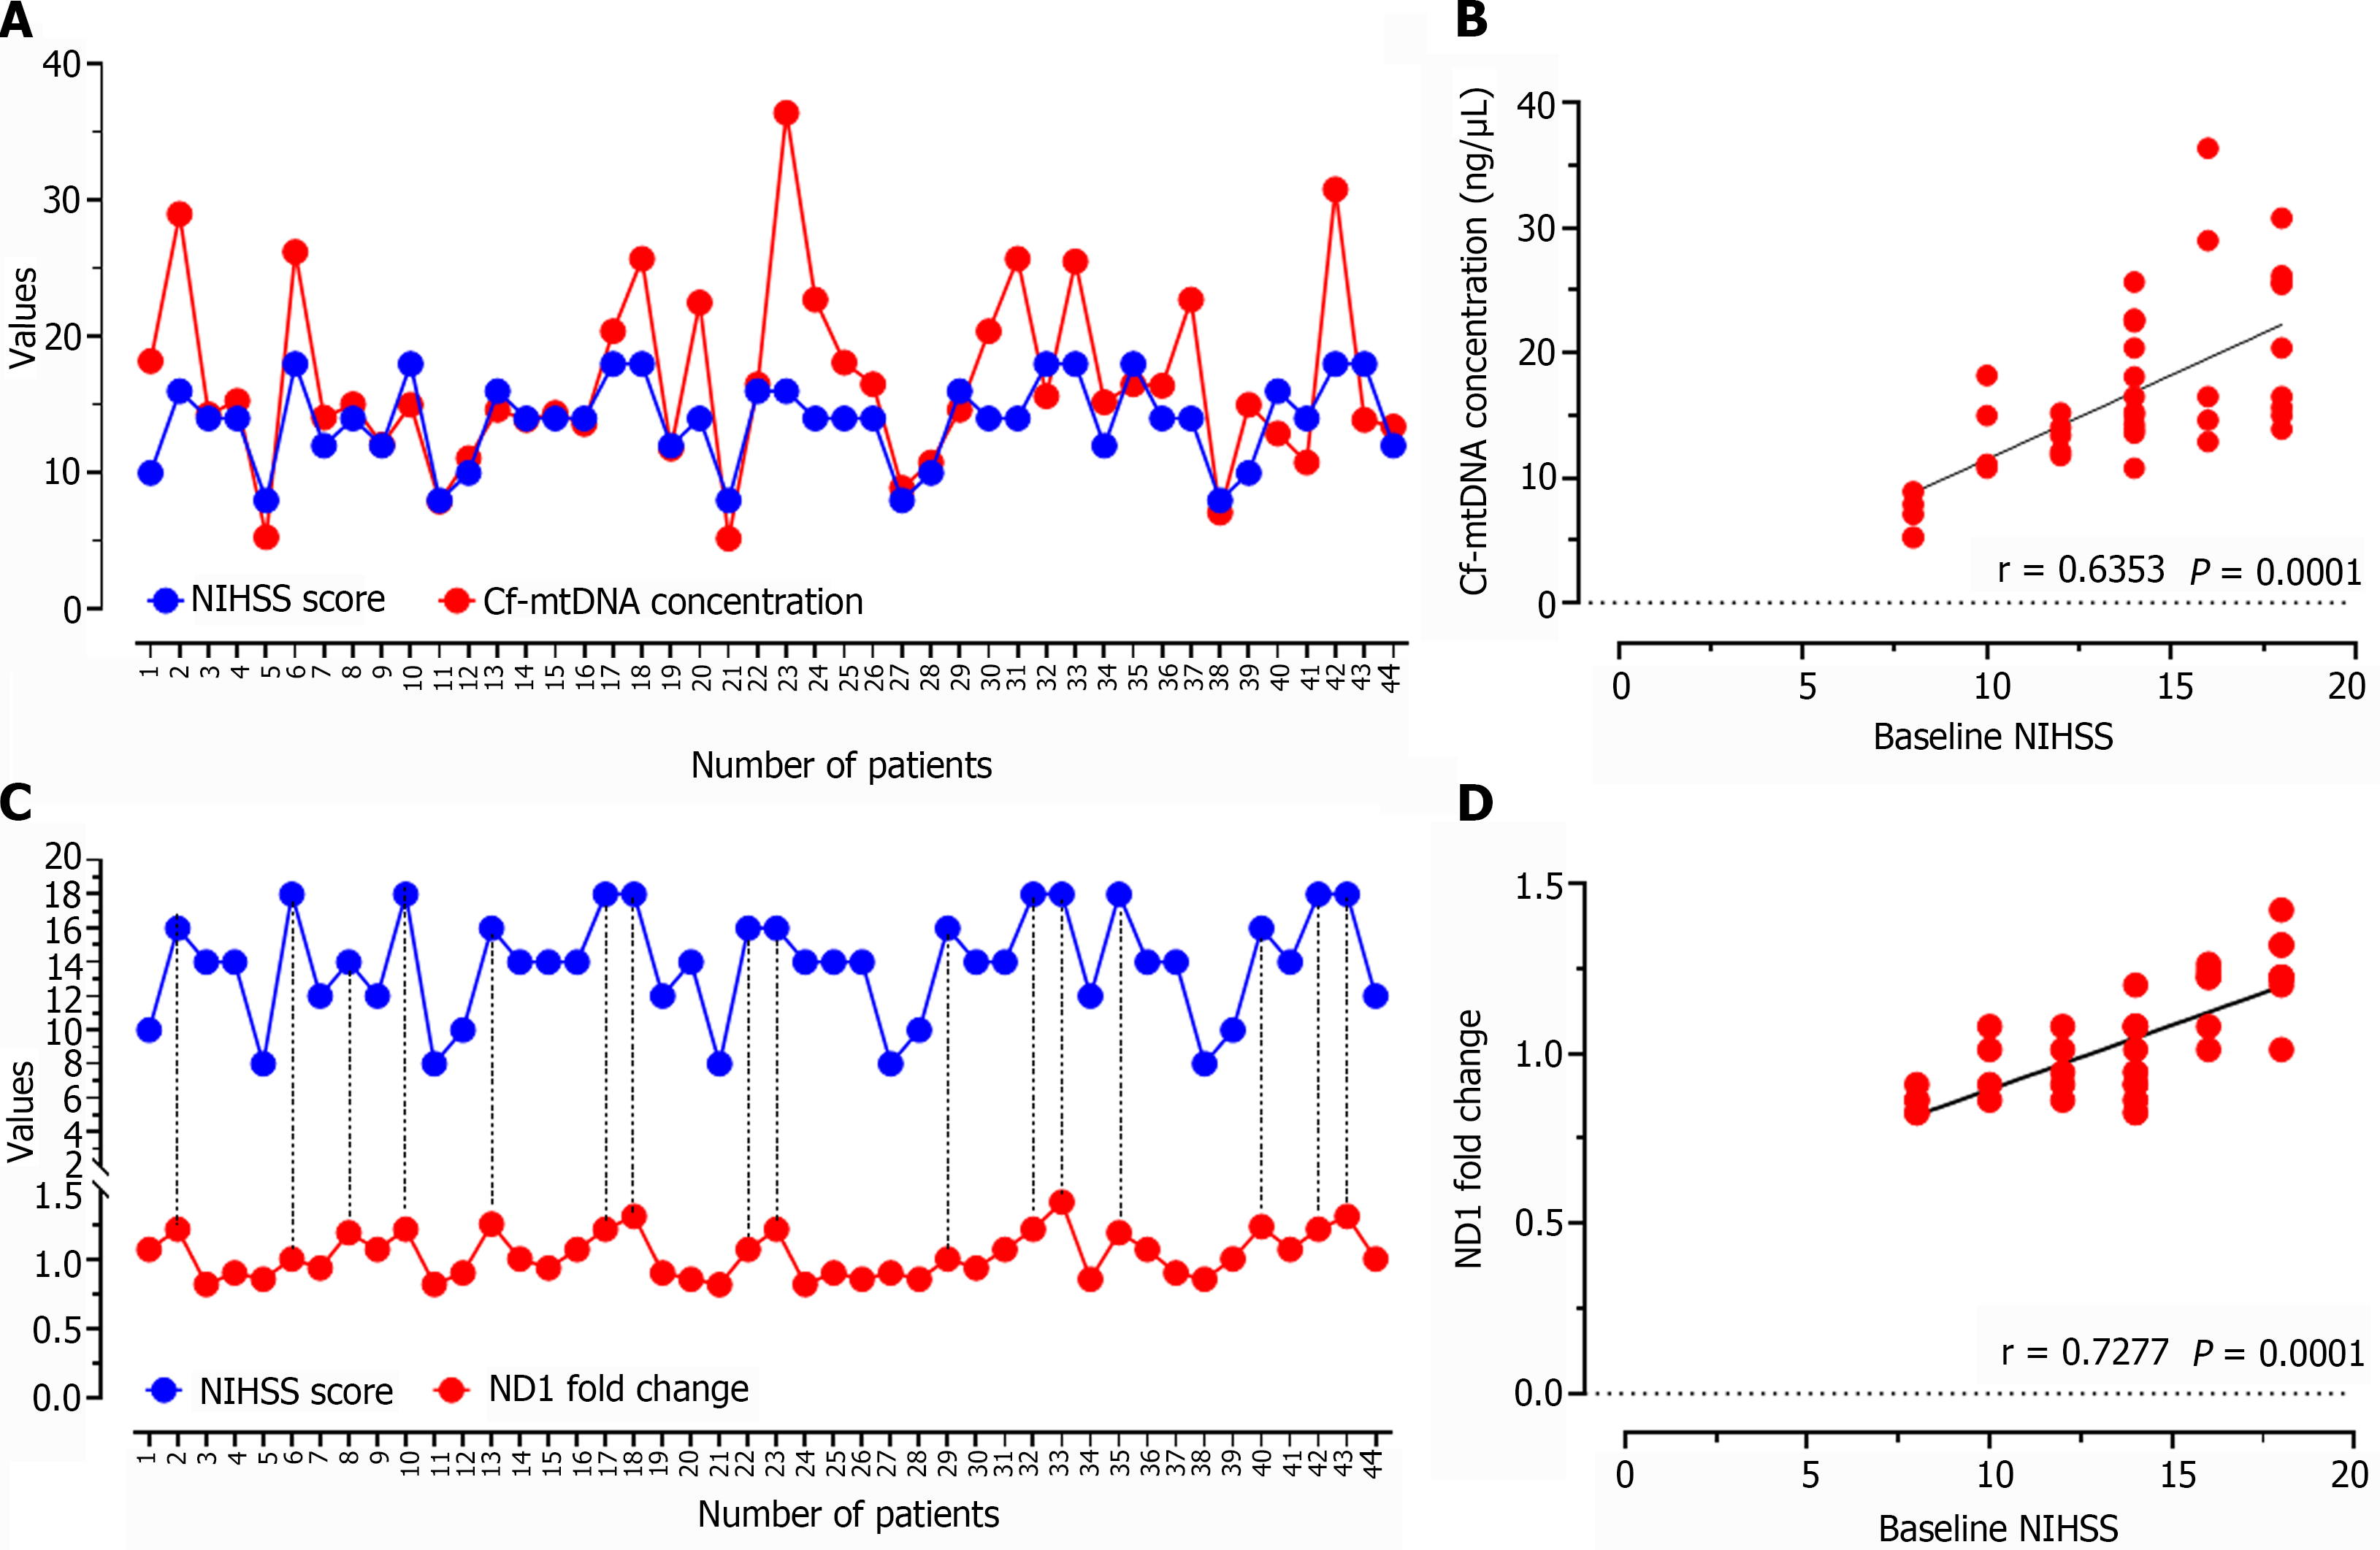
Figure 8 Correlation analysis.
A-D: Correlation analysis showing a positive association between baseline NIHSS score and cell-free mitochondrial DNA concentration, and ND1 relative expression. Cf-mtDNA: Cell-free mitochondrial DNA; ND1: NADH dehydrogenase 1; NIHSS: National Institutes of Health Stroke Scale.
- Citation: Fathima N, Manorenj S, Vishwakarma SK, Khan AA. Cell-free mitochondrial DNA quantification in ischemic stroke patients for non-invasive and real-time monitoring of disease status. World J Transl Med 2022; 10(2): 14-28
- URL: https://www.wjgnet.com/2220-6132/full/v10/i2/14.htm
- DOI: https://dx.doi.org/10.5528/wjtm.v10.i2.14


