INTRODUCTION
Nephrolithiasis can be defined as the result of formation and retention of crystals within the kidneys[1] where during crystalluria stone formation mainly seems to occur by crystal aggregation (AGN)[2]. Urinary stones are large crystal aggregates being embedded in a proteinous matrix. During the last years much work was done with respect to genetic, metabolic and morphologic aspects of nephrolithiasis[3-6]. Crystallization of stone forming minerals often was studied in artificial solutions neglecting the important fact that in biological solutions like urine crystals are always coated by macromolecules which essentially influence results[7,8] and that crystallization being relevant for stone formation has to occur within urinary transit time through the kidney, being in the order of a few minutes[9,10]. In this review we try to give some quantitative information on crystal formation, growth, AGN and retention as they may occur in the kidney during stone formation. The paper is centered on idiopathic calcium oxalate (CaOx) nephrolithiasis being the most frequent stone disease[11]. To illustrate the different topics, new figures were included which were drawn from own and only partially published experiments.
URINARY SUPERSATURATION WITH RESPECT TO STONE MINERALS, ESPECIALLY CAOX
The driving force for crystallization is urinary supersaturation which depends on the concentration of stone forming ions, their chelators, ionic strength and pH. Excessive excretion of Ca or Ox which almost exclusively can explain stone formation occurs in rare metabolic disorders like primary and secondary hyperoxaluria and some types of hypercalciuria[12]. In this review idiopathic Ca stone formation is addressed where not always and only relative mild forms of hypercalciuria or hyperoxaluria are found, which often are dependent from diet. After ingestion of a diet rich in Ox even in metabolic normal people an almost threefold increase of Ox excretion was observed[13]. To avoid dietary Ox excesses remains therefore essential in Ca stone metaphylaxis.
Urine is a complicated poly-ionic solution where multiple ions form various complexes between each other[14]. Some of these complexes like CaOx have an extremely poor solubility, precipitate already at a low concentration and -under special conditions being described below-form stones. In poly-ionic solutions the mobility and thus the activity of ions is reduced by the electrostatic forces exerted between the ions. Chemical reactions in solutions are therefore instead of ionic concentrations governed by ion activities (A, mol/L)[15]. A is calculated by the multiplication of the ion concentration (C) by an activity coefficient (f) as shown in equation (1). (f) can roughly be estimated by the ionic strength of the solution (I, mol/L).
(1) A = f · C
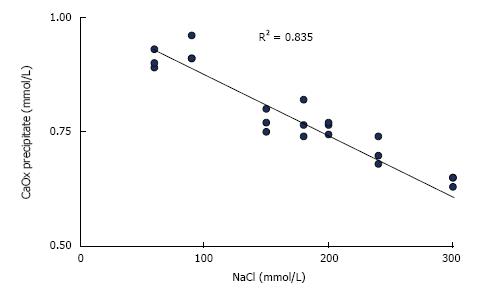
In urine, ionic strength is mainly generated by sodium and chloride which are present in much higher concentrations than other compounds[16]. Increasing ionic strength decreases ion activities and thus supersaturation or the amount of substances which can be precipitated from supersaturated solutions. This is demonstrated by CaOx precipitation in solutions with constant Ca and Ox but increasing NaCl concentrations (Figure 1). Unfortunately, this effect cannot therapeutically be used because a high NaCl intake stimulates urinary Ca and reduces citrate excretion[17]. The high ionic strength in concentrated urine also does not protect from precipitation because the effect of decreasing ion activity is largely overwhelmed by the increase of supersaturation due to the increased ion concentrations[16]. A high diuresis remains therefore important for stone metaphylaxis.
Figure 1 Influence of NaCl concentration on CaOx precipitation calculated from Ca decrease after the addition of 1.
0 mmol/L sodium oxalate to aqueous solution of 1.5 mmol/L CaCl2 buffered to pH 6.0 with 5 mmol/L sodium cacodylate.
Complex formation is schematically illustrated for CaOx by equation (2a). It is characterized by the reversible formation and dissociation of the soluble complex (CaOxS) and by precipitation and dissolution processes between CaOxS and its crystalline precipitate (CaOxP):
(2a) Ca2++Ox2-↔ CaOxs↔ CaOxP
For each complex exists a dissociation constant (KD , mol/L). It defines as shown in equation (2b) for CaOx the ratio between the mathematical product of free ion activities (A) in the solution and A of the solved complex:
(2b) KD = ACa· AOx/ACaOxS
Since at a given temperature and with the precipitate in excess also the concentration of solved complexes is a constant (e.g., 7.1 mg CaOx/L at 37 °C). The status of complex forming ions in a solution can simply be expressed as activity product (AP).
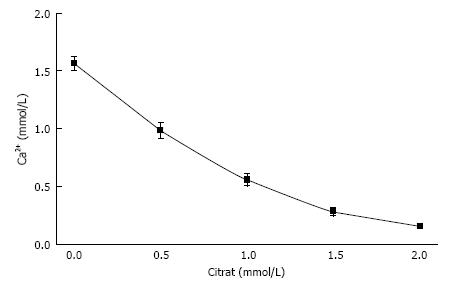
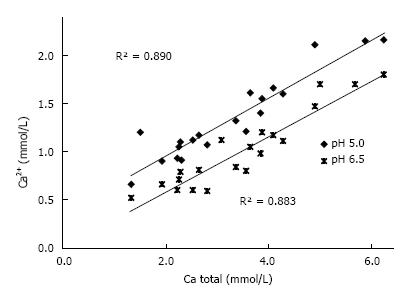
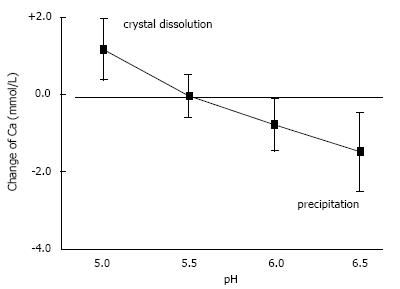
In urine, multiple complexes are in competition to each other in reducing free ionic concentrations. Compounds which have a high tendency to form complexes with a high solubility are called chelators. Citrate is such a chelator which as shown in Figure 2 essentially reduces free Ca concentration (Ca2+) and especially in patients with hypocitraturia has proofed to be efficient in stone metaphylaxis[18]. Contrary to other ions Ca2+ easily can be measured by Ca selective electrodes. Comparison of Ca2+ and total Ca in 20 urines showed a linear correlation with a chelation of 50%-70% of total urinary Ca being dependent from pH (Figure 3). A low pH or a high H+ concentration respectively reduces by protonisation of phosphates and carboxyl groups the chemical valences of these compounds and thus their capacity of complex formation. This is demonstrated in Figure 3, where Ca chelation in urine was reduced and thus Ca2+ increased by lowering pH from 6.5 to 5.0. However, the most important effect of pH is observed with respect to phosphate. A high pH with its low H+ concentration favors the formation of poorly soluble tertiary phosphates. This is demonstrated in experiments shown in Figure 4 where the change of Ca concentration was determined after equilibration of urine with hydroxyapatite (HAP, Ca10(PO4)6(OH)2). At an urinary pH above 5.5 the incubated HAP changed from dissolution to precipitation with a markedly decrease of urinary Ca. Struvite (MgNH4PO4) stones are exclusively found in alkaline urine where urease positive germs produce high concentrations of NH4.
Figure 2 Influence of citrate concentration on free ionic Ca concentration (Ca2+) in a solution like in Figure 1 but containing 100 mmol/L NaCl (mean ± SD, n = 5).
Figure 3 Correlation Ca2+ and total Ca concentration in 20 urines at pH 5.
0 and 6.5.
Figure 4 Influence of pH on solubility of hydroxyapatite demonstrated by the change of Ca concentration after equilibration of 20 urines with 10 mg/mL hydroxyapatite (mean ± SD).
Due to all the various factors being involved, the state of urinary saturation with respect to stone minerals is difficult to determine. A generally accepted expression for this state is relative supersaturation (RS), the ratio of the products of ionic activities (AP) actually found in urine (e.g. ACa· AOx) and the AP in the same urine being saturated with respect to the corresponding stone mineral (e.g., CaOx)[15]. The latter AP is called solubility product (SP). An RS > 1.0 denotes supersaturation, an RS < 1.0 undersaturation. RS can be calculated by the sophisticated computer program Equil 93[14]. This program bases in its most extended version on the input of 15-23 chemical parameters and the calculation of about 100 complexes. Another approach is the calculation of an AP index from 5 parameters by equation (3) as demonstrated for CaOx[19]:
(3) AP indexCaOx = 1.9 · Ca0.84· Ox / Mg0.12· Cit0.22· Urine-Vol.1.03
The state of urinary saturation can also experimentally be determined by the calculation of a concentration product ratio (CPR) of stone forming ions before and after equilibration of urine with the corresponding stone forming mineral[20]. The comparison of CPR’s and 6 chemical parameters measured in 76 urines of 19 idiopathic Ca stone patients showed only significant correlations between CaOx monohydrate saturation and Ox concentration (P < 0.001) and between brushite saturation and pH and Ca concentration (P < 0.001)[21]. Ca and Ox concentration and pH are thus the main parameters governing the state of urinary saturation with respect to stone forming Ca salts and which therapeutically can be influenced.
CRYSTAL FORMATION IN URINE
Stone minerals show as mentioned above at every state of saturation a bi-directional process of permanent precipitation and dissolution. With increasing supersaturation precipitation, which is also called crystal nucleation, prevails. However, low states of supersaturation do not have the energy to create stable particles and the precipitated crystal nuclei permanently dissolve[22]. To create stable particles a critical AP called formation product (FP) is mandatory which furnishes the energy being necessary to build up stable particle surfaces against surface tension. Supersaturation can thus be divided into two zones namely a labile zone above FP where crystal nucleation and growth occur and a metastable zone between FP and SP where already formed crystals grow without further nucleation. FP decreases with increasing incubation time, a fact that has to be taken in consideration in experiments simulating crystallization in the kidney with its short urinary transit times. Preexisting surfaces of solids where crystals can attach allow nucleation already in metastable supersaturated solutions. This special kind of nucleation is called heterogeneous nucleation.
Crystal nucleation and growth in urine are apart from supersaturation influenced by multiple urinary compounds called crystallization modulators[8]. These modulators comprise citrate, pyrophosphate, some glycosaminoglycans and a large group of proteins[23]. The most intensively studied and probably most important proteins are albumin, inter alpha inhibitor, nephrocalcin, osteopontin, prothrombin fragment 1 and Tamm Horsfall glycoprotein. Due to such modulators, often called inhibitors, crystallization processes in urine generally are decreased when compared to inhibitor free control solutions. Some substances can also act as nucleators. Despite of intensive research the role of all these compounds in stone formation could not definitively be clarified[24]. Studies in urine where all involved factors simultaneously are present are therefore of special interest.
Normal urine contains on average 4 mmol/L Ca and 0.4 mmol/L Ox and has a relative supersaturation (RS) of about 5[9], whereas for the spontaneous nucleation of CaOx an RS of 14 is mandatory[10]. In 60 urines of idiopathic stone patients and controls an Ox addition of 0.64 ± 0.11 mmol/L was necessary to induce CaOx crystallization without a difference between the two populations[7]. Such Ox concentrations are only achieved after excessive Ox ingestion[13]. Nevertheless, crystalluria is at least in some studies a frequent finding being generally more often found in urine of stone patients (9%-48%) than of healthy controls (2%-26%)[25]. Since urine often is only metastability supersaturated with respect to CaOx and storage and cooling have a minimal influence on CaOx formation[26], heterogenous nucleation seems to play an important role in crystalluria. Acid phospholipids accumulate Ca on cell membranes which thus become ideal nucleators for CaOx[23]. This heterogenous nucleation can occur by tubular cells in the kidney as well as by cellular debris in urine. Cellular material comprises about 50% of urinary deposits[27].
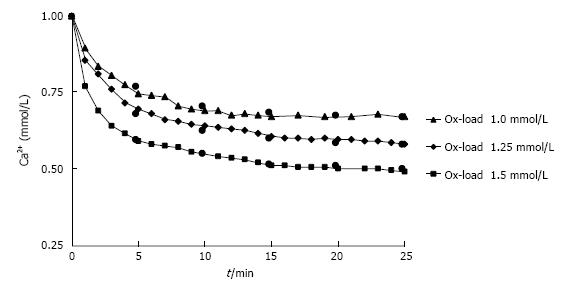
Nucleation and growth of CaOx can directly be followed in urine by measurement of the increase of optical density or the Ca decay after Ox addition[28]. Repeated measurement of the ionic Ca (Ca2+) after different Ox additions to urine showed typical crystallization curves (Figure 5). being characterized by the half-life of Ca2+ decrease (h, min.) and by the ratio of Ca2+ decrease at time (t) and of total Ca2+ decrease at the end of crystallization (RDt). RDt can be calculated by equation (4a) from h, which is obtained by equation (4b) from Ox in urine after the Ox addition (Oxi), a growth rate factor (g = 1.13 ± 0.36 mM-1 min-1) and a factor for metastability (m = 0.60 ± 0.07 mmol/L).
Figure 5 Decrease of Ca2+ in urine during observation time (t) after different Ox additions (1.
0-1.5 mmol/L). Measured (triangle/diamond/square) and by RDt (see text) calculated values (black circle).
(4a) RDt = t /(t + h)
(4b) h = 1 /g(Oxi - m)
Measurement of crystalluria by a coulter counter in freshly voided urine of stone patients and controls which was collected at 3 h intervals, showed after an oral Ox load single crystals with diameters on average of 6 µ and a maximum of 15 µ[10]. In the nephron at high urinary Ox concentrations (> 0.6 mmol/L) some nucleation can occur during a short time at the end of the descending limb of the loop of Henle but the main crystallization takes place at the end of collecting ducts[10]. The time for crystal nucleation and growth is therefore in the nephron about 1 min. For this time and a maximal Ox concentration of 0.9 mmol being assumed in idiopathic stone patients[9] a RDt of 0.25 can be calculated. The size of the large single crystals obtained from bladder urine has therefore for the nephron to be reduced from 15 to 9.45 µ, which is far below the minimal internal diameter of 30 µ of renal collecting ducts[9]. The reduced crystal size (d) in the nephron was calculated basing on a reduction of an octahedron volume (V = √2 d3/3) of CaOx dihydrate crystals to 25%. This calculation shows that without AGN crystals seem to have only little chances to be mechanically trapped within renal tubules.
CRYSTAL AGGREGATION
Already in 1969 it was demonstrated that stone patients contrary to healthy controls especially after Ox ingestion have a tendency to excrete large crystal aggregates[29]. Such aggregates which can reach diameters up to 500 µ can obstruct collecting ducts and by further apposition of crystals can give raise to stone formation[12]. The growth of already existing stones can also be explained by aggregation (AGN)[2].
For AGN crystals have to collide. The natural driving forces for particle collision without shaking or stirring are diffusion by Brownian motion and sedimentation. The effect of these two forces recently was studied in the context of high physiological crystal concentrations, renal tubular and pelvic dimensions and urinary transit times in the kidney[30]. Crystals are even at the maximal concentration of 24000/cm3 assumed in idiopathic Ca stone formers[9] on average in a distance of about 350 µ. Crystal motion by diffusion contrary to sedimentation is an undirected three- dimensional random process being only in the order of 10 µ/min0.5. Crystal collision in the nephron by diffusion is therefore negligible and in the renal pelvis with a volume of 7 cm3 may occur about 3 times per min. Collision of free floating single crystals by sedimentation is even more rare. It bases on differences in sedimentation rates due to differences in crystal sizes which in urine are too low for an efficient collision. However, sedimentation seems to be important for crystal accumulation on tubular walls where flow rate is slow due to fluid drag and on surfaces in the renal pelvic system where urinary transit time is prolonged. For collecting ducts being in a horizontal position a maximal accumulation of 1.3 crystals per min. was estimated. The accumulation of crystals on surfaces in the renal pelvic system by sedimentation (AS, cm-2 min·1-1) can be calculated by equation (5) which contains the crystal concentration (C, cm-3) and a sedimentation rate (vS , cm/min).
(5) AS = C · vS
For maximal crystalluria of 24’000 crystals/cm3 and a sedimentation rate of 0.026 cm/min. an accumulation of 624 crystals per cm2 surface and min. can be calculated[30]. Crystal accumulation on kidney calcifications or stones seems to be an important mechanism in stone formation.
However, also with an important crystal accumulation on surfaces during crystalluria, for AGN crystals have to become attached to each other. In inorganic solutions this attachment generally is ascribed to an attraction by van der Waal forces being only effective at short distances of some 0.1 nm[31]. In biological fluids crystals are always surrounded by protein coats with a thickness of 10-30 nm[32]. These proteins have a negative electric charge of -15 to -30 mV which normally inhibits AGN by electrostatic repulsion of the identically charged particles[33]. From CaOx and CaP crystals being precipitated in urine six different proteins comprising albumin were isolated[34]. The composition of these proteins showed no difference whether they were precipitated from urine of stone patients or of controls. Inhibition of crystal AGN by urinary macromolecules (UM’s) was demonstrated in various studies[23]. But a deficient urinary inhibitory activity in urine of stone patients could only be demonstrated in some studies[35-37] but not in all[38,39]. Examination of AGN often was performed in artificial solutions with the addition of an UM and of crystals which were previously produced in an inhibitor free medium.
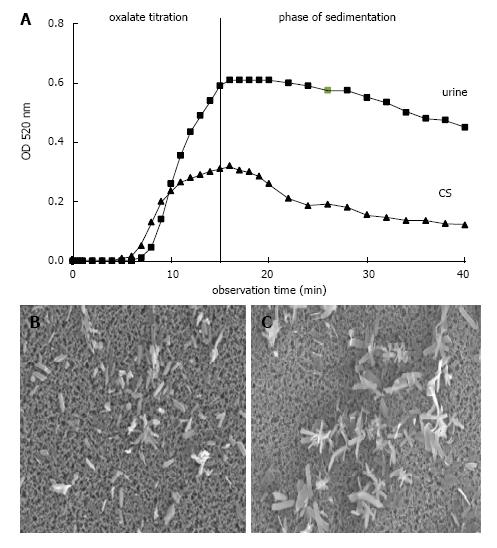
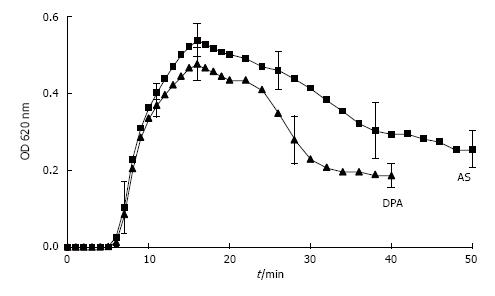
However, the formation and AGN of CaOx can also be studied in urine by an oxalate titration with spectrophotometric follow of the crystallization process[7]. This is demonstrated in Figure 6A where after a critical Ox addition, which is a measure for metastability and was lower in a control solution (CS) than in urine, optical density (OD) steadily increased. The maximal OD which was reached at the end of titration and which mainly reflects particle concentration was lower in CS than in urine, where due to an inhibition of crystal growth more but smaller crystals were produced. After the end of Ox titration stirring was stopped and OD decrease reflecting particle sedimentation was followed during a further 30 min. In CS which in scanning microscopy performed at the end of Ox titration showed large crystal aggregates (Figure 6C), a rapid OD decrease immediately after the end of titration was observed, whereas in urine without AGN (Figure 6B) this rapid OD decrease was lacking or occurred with a delay of 15 and more minutes. Analysis of crystallization curves and scanning electron microscopy of crystal sediments revealed a good correlation between OD decrease and particle sizes[30]. Crystals produced by Ox titration showed in urine of 63% of healthy controls but only in urine of 33% of stone patients during 30 min observation time a complete inhibition of AGN (P < 0.05)[7]. In the remaining urine AGN occurred with a delay often being beyond urinary transit time through the kidney which is in the order of 15 min[40]. Most aggregates found in voided urine therefore seems to originate from crystal AGN in the urinary bladder. Since in ultrafiltrate of urine where urinary macromolecules (UM’s) were retained on a 5 kD filter, AGN immediately occurred, inhibition of AGN could mainly be ascribed to the effect of UM’s[41]. However, when UM’s were isolated by a hemofilter procedure or by a CaP precipitation with dissolution of the sediment, AGN already occurred after a delay of about 7 min[33]. The same effect was observed after addition of hydroxyapatite crystals to urine[7]. A contact with surfaces even when temporary seems thus to destroy the inhibitory potential of UM’s.
Figure 6 Ox titration.
A: Spectrophotometric crystallization curve of Ox titration (0.1 mmol/min.) in urine and control solution (CS) both with pH 6.0, 100 mmol/L NaCl, initially 2 mmol/L Ca2+ and with total 1.5 mmol/L Ox addition by titration; B: Scanning microscopy of deposit on Millipore filter obtained at the end of Ox titration from urine and (C) from CS.
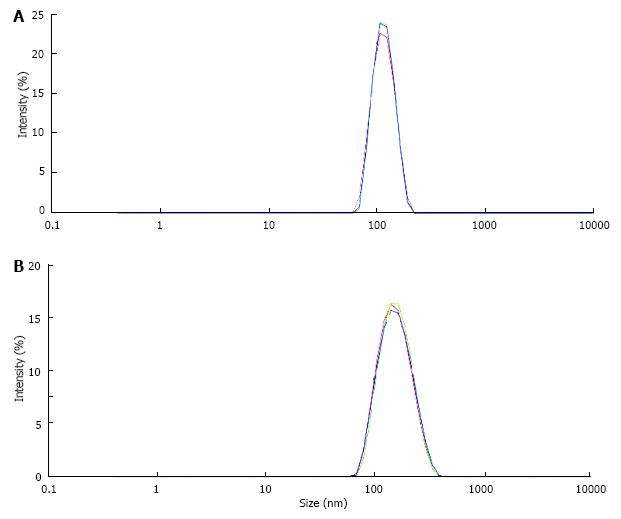
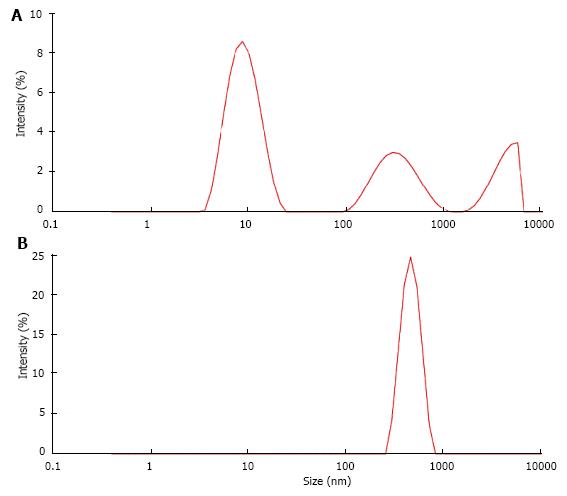
UM’s have a high and rather unspecific affinity to surfaces. As known from catheter incrustation they bind by hydrophobic forces even to latex. The adsorption of UM’s on latex beads is demonstrated in Figure 7. Incubation in UM solution increased the maximal peak in particle size distribution of latex beads which was measured by a Zetasizer from 116 nm to 160 nm. Some UM’s like albumin, osteopontin and Tamm Horsfall glycoprotein (THG) when concentrated are known to have a tendency to self AGN[23]. Self AGN turned THG from a potent inhibitor to a promoter of CaOx AGN[42]. Also polymers of albumin were found to be strong promoters of CaOx crystallization[43]. The tendency of albumin to self AGN is demonstrated in Figure 8 again by the measurement of particle size distribution with a Zetasizer. In an albumin solution apart of the main peak at 10 nm further peaks indicating albumin aggregates were found (Figure 8A). After CaP precipitation in the same solution and dissolution of the sediment where albumin temporary had been adsorbed to CaP crystals only one fraction of highly aggregated albumin with a peak at 480 nm was observed (Figure 8B). This highly aggregated albumin had, as shown in Figure 9, the same effect on CaOx crystallization curves as UM’s isolated by hemofiltration or by CaP precipitation and as the addition of HAP to urine. Maximal OD after oxalate titration was diminished and already 7 min. after the end of titration a sharp OD decrease indicating CaOx AGN occurred. Temporary concentration of UM’s by adsorption on surfaces seems thus to favor self AGN of UM’s and to change their inhibitory potential with respect to the AGN of CaOx crystals.
Figure 7 Particle size distribution in suspension of latex beads (size 100 nm, concentration 0.
025%/mL) measured by a Zetasizer (A) in control solution, (B) in solution of urinary macromolecules obtained by CaP precipitation and dissolution of the precipitate.
Figure 8 Particle size distribution (A) in albumin solution (AS, 20 μg/mL) and (B) in solution obtained from AS after CaP precipitation and dissolution of the precipitate (DPA).
Figure 9 Spectrophotometric crystallization curve of Ox titration in AS and in DPA with pH 6.
0, 100 mmol/L NaCl, initial 2.0 mmol/L Ca2+ and 1.5 m mmol/L Ox addition by titration. (Further details see Figure 8) (mean ± SD, n = 5).
The questions raises, how crystals aggregate despite of their electro-negative UM coats and electrostatic repulsion and how self AGN of UM’s can favor crystal AGN. The answers to these questions are still speculative. Three different options for crystal attachment to each other are discussed: Incomplete isolation of crystals by protein coats , insufficient surface potential of coats and bridging between crystals by altered proteins. Scanning microscopy of crystal aggregates which were produced in protein solutions showed gaps in protein coats where crystals were in direct contact to each other[32]. But it could not be decided whether crystal coating had occurred before or after AGN. In other aggregates at points of crystal convergence large amorphous material was found suggesting crystal bridging by proteins.
The inhibition of crystallization processes by UM’s is mainly attributed to anionic residues like carboxyglutamic acid[44,45], phosphate[46,47] and sialic acid[48,49] which have a high affinity to the Ca of crystals. Some of these anionic groups being responsible for the electro-negative charge of coated crystals were found to be reduced in UM’s of stone patients. An insufficient crystal coating and electrostatic repulsion was therefore suggested to be responsible for AGN and stone formation. On the other hand it was shown that desialylation of Tamm Horsfall glycoprotein (THG) provoked self AGN of THG and AGN of CaOx crystals[49], effects which were also demonstrated in experiments performed with albumin (Figures 8 and 9). Desialylation reduces anionic domains and thus reinforces hydrophobic groups of THG being responsible for hydrophobic protein binding. This can favour not only self AGN of THG but also a bridging function of THG between proteins of crystal coats. In electrolyte-containing solutions the electrostatic potential generated by electrically charged particles exponentially decreases with increasing distance from the particles[31]. Identically charged particles can therefore approach to each other to a critical distance of some nanometers where diffusion, sedimentation or mechanic forces like stirring or shaking are compensated by electrostatic repulsion. Large protein aggregates probably are able to bridge such zones of electrostatic repulsion.
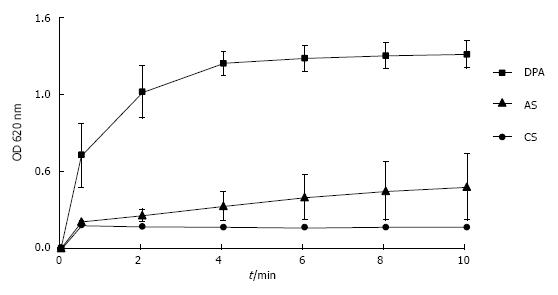
Bridging and especially self AGN seem to be relative slow processes which could explain the delay of AGN observed in urine. In a spectrophotometer the velocity of albumin-induced AGN of latex beads can directly be followed by an OD increase which occurs in a linear correlation with the increase of latex aggregates[50]. Figure 10 shows that in the untreated albumin solution (AS) this increase was very slow whereas in a solution of aggregated albumin (DPA) latex-AGN was already complete within 4 minutes. Bridging of CaOx crystals with their irregular shape and large surface certainly takes more time than bridging of the small and spherical latex beads. In view of the delayed AGN of CaOx crystals in urine urinary transit time (UTT) through the kidney becomes a crucial factor for stone formation. In the nephron average UTT is about 3 min[10] and in the renal collecting system about 12 min[40]. These values were calculated for an urinary output of 1.5 L/24 h. Increasing diuresis which remains an important measure in stone metaphylaxis[51] essentially reduces UTT especially in the renal collecting system.
Figure 10 Increase of optical density of suspensions of latex beads reflecting increase of particle size by aggregation in control solution, in albumin solution and in aggreagted albumin.
(Further details see Figure 8) (mean ± SD, n = 5). CS: Control solution.
CRYSTAL AND STONE RETENTION IN THE KIDNEY
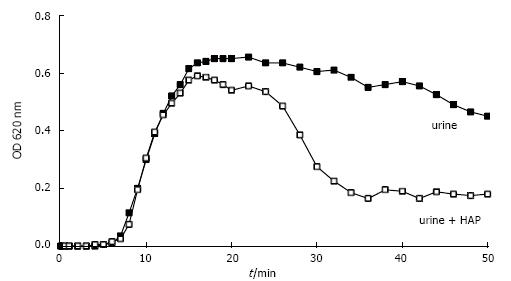
We showed that crystal growth at least in idiopathic stone patients generally is too slow for single crystals to be trapped in the upper urinary tract and that crystal AGN often is delayed beyond urinary transit time trough the kidney. Crystals are probably most often washed out by diuresis before AGN occurs. However, when CaOx crystals were produced in the presence of HAP crystals which were added to urine before Ox titration, AGN occurred as demonstrated in Figure 11 after about 7 min. Scanning microscopy of sediments showed that this AGN had occurred in narrow contact with the HAP crystals[52]. Tissue calcifications with HAP, after erosion to papillary surface seem therefore to be an ideal platform for a rapid attachment of urinary crystals. Randall developed already in 1937 the theory that Ca stones can start by CaOx growth initially fixed on papillary calcifications which are called Randall’s plaques[53]. This mechanism allows crystal aggregates to grow to stones of a critical size where they can not anymore be washed out of the urinary tract by the urine flow. Systematic post-mortem examination of 100 kidneys revealed in 100% some calcifications but only in 7% stones[54]. Kidney calcifications are therefore not a singular cause of Ca stone formation. New endourologic methods allowing in vivo inspection of all renal papilla with the possibility of biopsies have brought new evidence for the role of Randall’s plaques in idiopathic Ca stone formation[12,55]. CaOx stones found in calices often were attached to white plaques on the papilla containing amorphous hydroxyapatite within a protein matrix. Furthermore, most CaOx stones being endoscopically removed showed residual cores of apatite where they probably have been attached to the papilla.
Figure 11 Spectrophotometric crystallization curve of Ox titration in urine without and with previous addition of 0.
05 mg/L HAP.
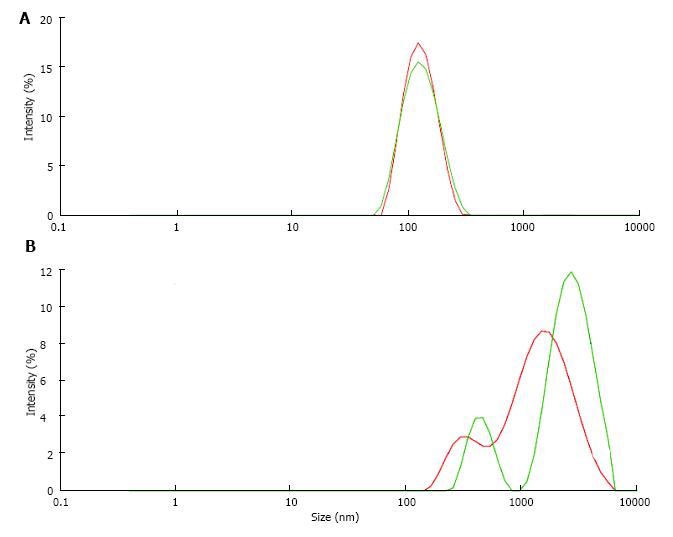
Stone formation on Randall’s plaques is complex and still poorly understood. Histological analysis with immunohistochemistry or infrared spectroscopy of Randall’s plaques with an adherent stone showed that the plaques consisted of an osteopontin (OP) matrix with hydroxyapatite (HAP) deposits whereas the stone in addition to OP and HAP contained Tamm Horsfall glycoprotein (THG) and CaOx, the latter increasing with increasing distance from the plaque[12]. Stone formation thus seems to occur at the interface of HAP and CaOx crystals being embedded in proteins like OP and THG which both have a tendency to self AGN[23] and which in urine of some stone formers were found to have a deficiency in acid groups[47,49]. A reduction of anionic groups reinforces as mentioned above hydrophobic activity of proteins and thus the tendency to self AGN and to the binding to hydrophobic domains of other proteins. AGN inhibition by anionic groups can indirectly be demonstrated studying the influence of pH on UM induced latex AGN (Figure 12). When latex beads with a diameter of about 100 nm were incubated at pH 6.0 in a UM solution obtained by the precipitation and dissolution of CaP in urine only a moderately increased particle size of 156 nm due to UM coating of the latex beads was observed (Figure 12A). The same procedure performed at pH 5.0 with a higher protonisation of anionic UM groups on the other hand produced a peak of particle intensity at 2400 nm showing a massive AGN (Figure 12B). Lowering pH from 6.0 to 5.0 reduced the surface potential of the latex beads being influenced by the anionic valence of the UM coats from -28 to -21 mV. An effect of pH on the activity of UM’s and thus on AGN could be of interest from a therapeutic point of view and deserves further investigation.
Figure 12 Particle size distribution of latex beads (A) at pH 6.
0 and (B) at pH 5.0 in solution of urinary macromolecules obtained by CaP precipitation.
CONCLUSION
It is astonishing that despite of the widespread occurrence of crystalluria and kidney calcifications not everybody produces stones. In stone patients without treatment average recurrence rate was only 1 stone within 8 years[56] and in 71% of patients stone residuals after percutaneous nephrolithotomy remained stable or even decreased during an observation time of 2-3 years[57]. The retention and growth of crystal aggregates in the kidney seems therefore only to occur under very special and rare conditions. Such conditions may be an extremely low diuresis with high concentrations of stone forming minerals and with a prolonged urinary transit time allowing crystal AGN already in the kidney and/or an extreme oxalate ingestion. Both conditions can produce an excessive crystalluria which can damage renal tubules and alter the production of UM’s normally protecting from stone formation[23]. Which factors finally are decisive whether crystalluria provokes stone formation or crystalluria is a useful mechanism to eliminate heavy soluble substances with minimal water loss remains open to further research.
ACKNOWLEDGMENTS
We wish to thank Dr. Marion Nöel for their collaboration concerning Zetasizer measurements, performed in Bern University of Applied Sciences, Division of Architecture, Wood and Civil Engineering, Research and Development, Biel, Switzerland.
P- Reviewer: Chang CC, Isaka Y, Shrestha BM S- Editor: Ji FF L- Editor: A E- Editor: Lu YJ


