Copyright
©The Author(s) 2017.
World J Nephrol. Jul 6, 2017; 6(4): 188-200
Published online Jul 6, 2017. doi: 10.5527/wjn.v6.i4.188
Published online Jul 6, 2017. doi: 10.5527/wjn.v6.i4.188
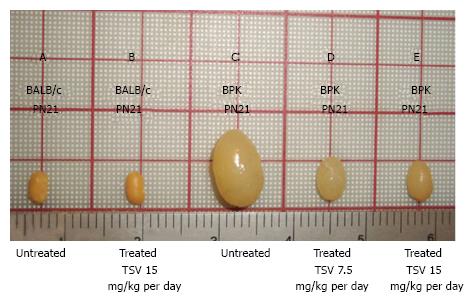
Figure 1 Tesevatinib treatment in the BPK model of autosomal recessive polycystic kidney disease.
Compared to wild-type BALB/c control kidneys (A) at PN21, BPK cystic kidneys (C) are extremely enlarged by PN21. TSV treatment resulted in a dose-dependent reduction in the overall kidney size at doses of 7.5 mg/kg per day (C) and 15 mg/kg per day (D) when compared to PN21 BPK untreated cystic kidneys (C). Treatment of wildtype BALB/c with 15 mg/kg per day (B) did not result in significant reduction of overall kidney size when compared to untreated BALB/c kidneys (A). This correlates directly with the total kidney weight (TKW) of each group listed in Table 1. Further, the morphology of wildtype TVS treated kidneys seen in Figure 2A shows no obvious signs of toxicity (Treatment interval: PN4-PN21). TSV: Tesevatinib.
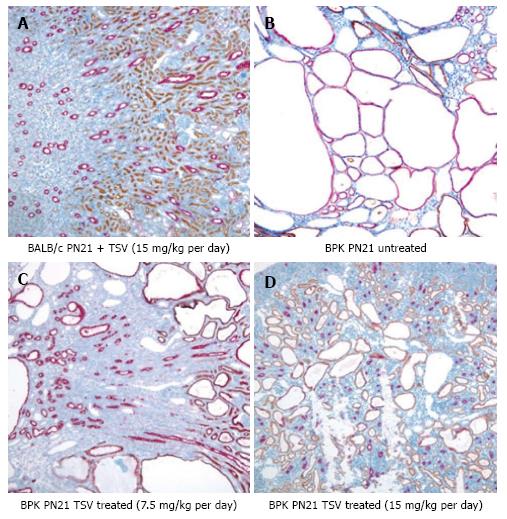
Figure 2 Renal morphology of tesevatinib-treated BPK kidneys.
Immuno-histological analysis of BPK kidneys reveals a marked decrease in the size and number of collecting tubule cysts (stained red) following treatment with TSV at 7.5 mg/kg per day (C) and 15 mg/kg per day (D) when compared to the untreated cystic kidneys (B). Treatment of control BALB/c kidneys with TSV at 15 mg/kg per day (A) demonstrated no obvious histological abnormalities (Nephron segment-specific lectin binding of lotus tetragonolabus agglutin shows proximal tubules in brown, and binding of dolichus biflorus agglutin shows collecting tubules in red). TSV: Tesevatinib.
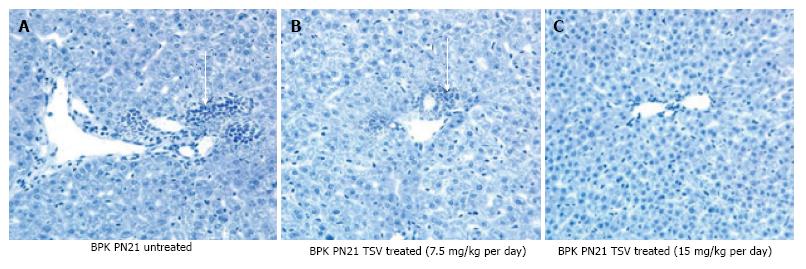
Figure 3 Liver morphology of tesevatinib-treated BPK mice.
Histological analysis of hematoxylin stained BPK livers reveals a marked decrease in the biliary ductal ectasia (arrow) following treatment with TSV at 7.5 mg/kg per day (B) (arrow) and 15 mg/kg per day (C) when compared to untreated BPK livers (A) (Treatment interval: PN4-PN21).
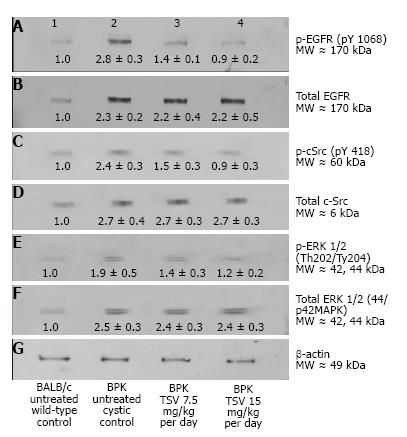
Figure 4 Target validation in BPK.
Western analysis of the MAPK pathway activity of EGFR (p-EGFR), cSrc (pSrc), and ERK1/2 (p-ERK ½) reveals that BPK cystic kidneys have significantly increased levels of active or phosphorylated p-EGFR (A2), pSrc (C2) and ERK1/2 (E2) compared to wild-type BALB/c control levels in lanes (A1, C1 and E1) respectively. TSV treatment at 7.5 or 15 mg/kg per day resulted in a dose dependent reduction in the phosphorylation or activity of p-EGFR (A3 and A4), and p-Src (C3 and C4) that correlated directly to a reduction in the activity of ERK1/2 (p-ERK1/2: E3 and E4).The reduced level of phosphorylated proteins occurred without changes in the level of total EGFR (B2, B3 and B4), total Src (D2, D3 and D4) or total ERK1/2 (F2, F3 and F4). The numbers below the band in each lane represents the average ± SD (n = 3) of the relative density of each band when normalized to the wildtype BALB/c control value arbitrarily set at 1.
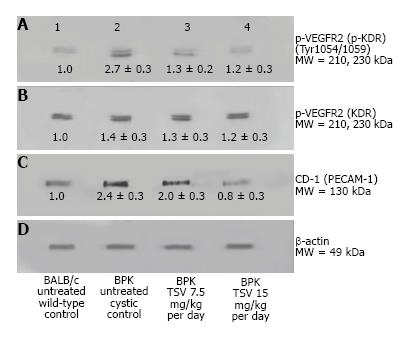
Figure 5 VEGFR2 (KDR) and CD-31 expression in BPK.
Western analysis of the renal expression of VEGF2 (KDR) in BPK (B), and active (p-KDR) in BPK kidneys (A) demonstrate an increased phosphorylation of KDR in untreated cystic kidneys (2) compared to BALB/c untreated wildtype controls (A1). TSV treatment of BPK at 7.5 (A3) and 15 mg/kg per day (A4) respectively, reduced the level of p-KDR in a dose dependent manner to near normal (wildtype) levels. This reduced p-KDR correlated directly with expression levels of CD-31 shown in (C) which was also reduced in a dose dependent manner with TSV treatment. The numbers below the band in each lane represents the average ± SD of the relative density of each band when normalized to the wildtype BALB/c control value arbitrarily set at 1. D is the loading control. Each average represents a minimum of n = 3 individual westerns. These data are confirmed by the morphology of CD-1 stained BPK kidneys shown in Figure 6.
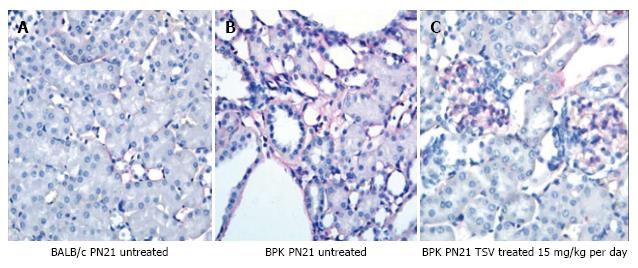
Figure 6 Immuno-histological analysis of CD-31 expression in tesevatinib-treated BPK kidneys.
Expression of CD-31 (PECAM1) (red), a marker of endothelium, in PN21 wild-type BALB/c kidneys (A) reveals fine thin lines of endothelial elements that run along the nephrons. Untreated BPK kidneys (B) demonstrate prominent expression of CD-31 along the tubules and pronounced expression surrounding cystic lesions. TSV-treated cystic kidneys at 15 mg/kg per day (C) reveal a marked reduction in CD31 expression along the tubules to near normal levels but maintain robust glomerular staining of CD-31.
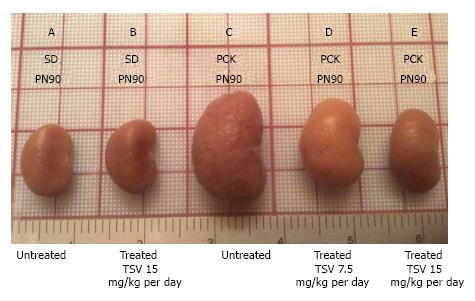
Figure 7 Tesevatinib treatment in the PCK model of autosomal recessive polycystic kidney disease.
Compared to wild-type SD control kidneys (A) at PN90, PCK cystic kidneys (C) are significantly enlarged by PN90. TSV treatment results in a dose-dependent reduction in the overall kidney size at doses of 7.5 mg/kg per day (D) and 15 mg/kg per day (E) when compared to untreated PCK cystic kidneys at PN90 (C). Treatment of wildtype SD with 15 mg/kg per day did not result in significant reduction of overall kidney size (B) compared to untreated wildtype SD animals. This correlates directly with the total kidney weight (TKW) of each group listed in Table 2 (Treatment interval: PN30-PN90). TSV: Tesevatinib.
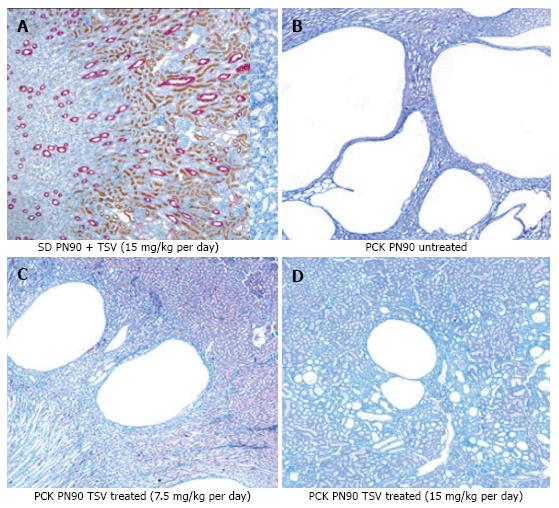
Figure 8 Renal morphology of tesevatinib-treated PCK kidneys.
Histological analysis of HE stained PCK kidneys reveals a marked decrease in the size and number of collecting tubule cysts following treatment with TSV at 7.5 mg/kg per day (C) and 15 mg/kg per day (D) when compared to untreated cystic kidneys (B). Treatment of control Sprague Dawley kidneys at 15 mg/kg per day (A) revealed no histological abnormalities (Treatment Interval: PN30-PN90). TSV: Tesevatinib.
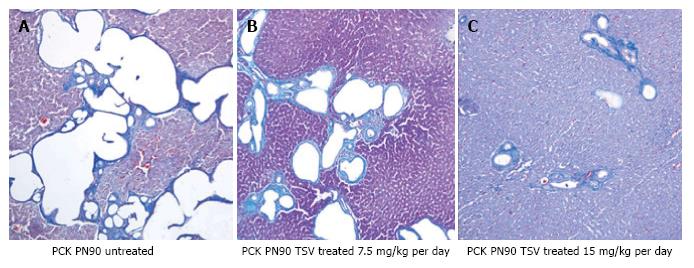
Figure 9 Liver morphology of tesevatinib-treated PCK mice.
Histological analysis of PCK livers reveals a marked decrease in the size and number of biliary ductal cysts following treatment with tesevatinib at 7.5 mg/kg per day (B) and 15 mg/kg per day (C) when compared to untreated PCK livers (A) (Treatment interval: PN30-PN90).
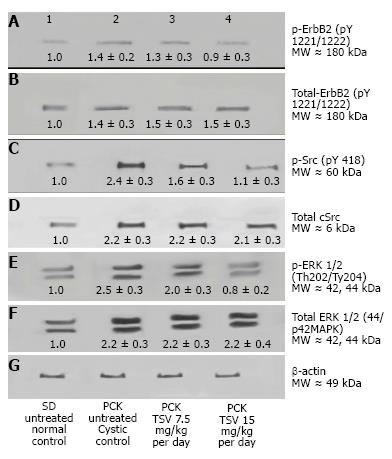
Figure 10 Target validation in BPK.
Western analysis of the MAPK pathway activity of EGFR (p-EGFR), cSrc (pSrc), and ERK1/2 (p-ERK ½) reveals that BPK cystic kidneys have significantly increased levels of active or phosphorylated p-EGFR (A2), pSrc (C2) and ERK1/2 (E2) compared to wild-type BALB/c control levels in lanes (A1, C1 and E1) respectively. TSV treatment at 7.5 or 15 mg/kg per day resulted in a dose dependent reduction in the phosphorylation or activity of p-EGFR (A3 and A4), and p-Src (C3 and C4) that correlated directly to a reduction in the activity of ERK1/2 (p-ERK1/2: E3 and E4).The reduced level of phosphorylated proteins occurred without changes in the level of total EGFR (B2, B3 and B4), total Src (D2, D3 and D4) or total ERK1/2 (F2, F3 and F4). The numbers below the band in each lane represents the average ± SD (n = 3) of the relative density of each band when normalized to the wildtype BALB/c control value arbitrarily set at 1.
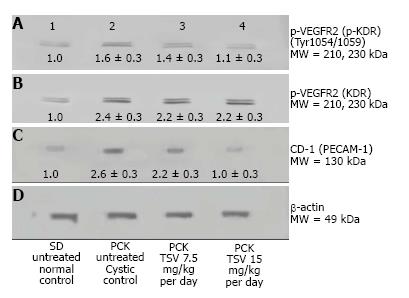
Figure 11 VEGFR2 (KDR) and CD-31 expression in PCK.
Western analysis of the renal expression of VEGF2 (KDR) in PCK (B), and active (p-KDR) in PCK kidneys (A) demonstrate an increased phosphorylation of KDR in untreated cystic PCK kidneys (A2) compared to SD untreated wildtype controls (A1). TSV treatment of PCK at 7.5 (A3) and 15 mg/kg per day (A4) respectively, reduced the level of p-KDR in a dose dependent manner to near normal (wildtype) levels. This reduced p-KDR correlated directly with expression levels of CD-31 shown in C, which was also reduced in a dose dependent manner with TSV treatment. The numbers below the band in each lane represents the average ± SD of the relative density of each band when normalized to the wildtype SD control value arbitrarily set at 1. D is the loading control. Each average represents a minimum of n = 3 individual westerns.
- Citation: Sweeney WE, Frost P, Avner ED. Tesevatinib ameliorates progression of polycystic kidney disease in rodent models of autosomal recessive polycystic kidney disease. World J Nephrol 2017; 6(4): 188-200
- URL: https://www.wjgnet.com/2220-6124/full/v6/i4/188.htm
- DOI: https://dx.doi.org/10.5527/wjn.v6.i4.188


