Copyright
©The Author(s) 2016.
World J Nephrol. Nov 6, 2016; 5(6): 497-506
Published online Nov 6, 2016. doi: 10.5527/wjn.v5.i6.497
Published online Nov 6, 2016. doi: 10.5527/wjn.v5.i6.497
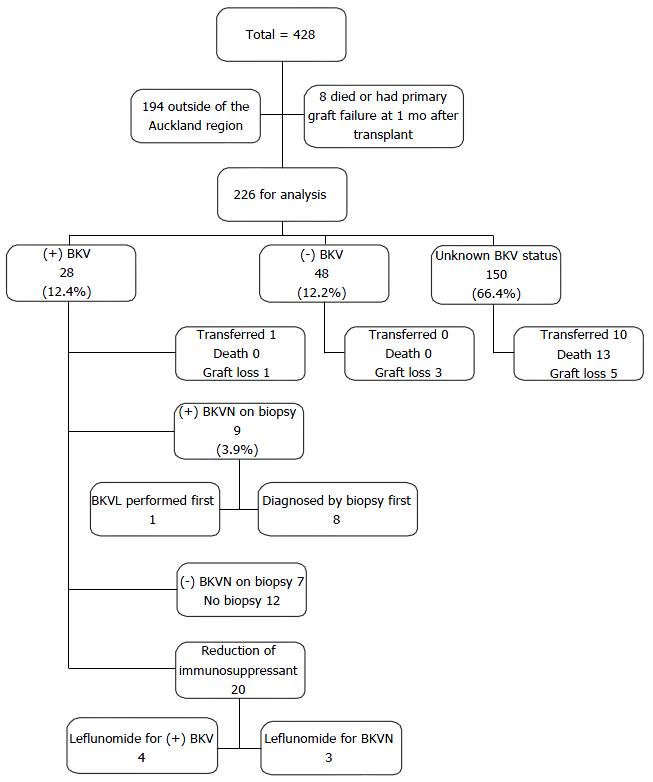
Figure 1 Description of the study population from January 2006 to December 2012 with follow-up until December 2013.
BKV: BK polyomavirus; BKVN: BK polyomavirus nephropathy.
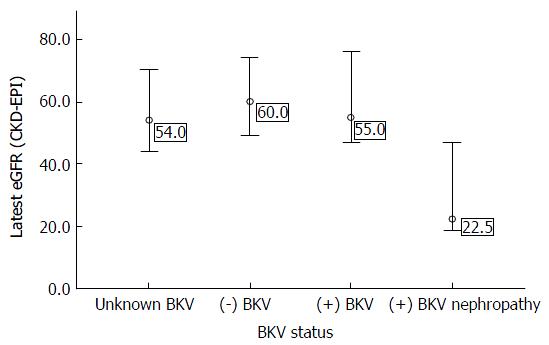
Figure 2 Comparison of unadjusted graft function (median estimated glomerular filtration rate mL/min per 1.
73 m2) taken before the censored date among BK polyomavirus status groups, excluding those who developed graft failure. BKV: BK polyomavirus; eGFR: Estimated glomerular filtration rate.
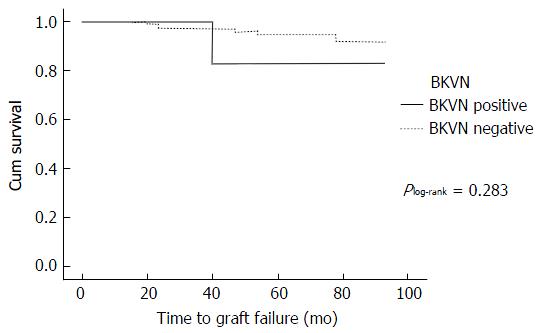
Figure 3 Kaplan-Meier plot showing graft failure rates comparing recipients with/without BK polyomavirus nephropathy censored for death without graft failure and recipients transferred.
BKVN: BK polyomavirus nephropathy.
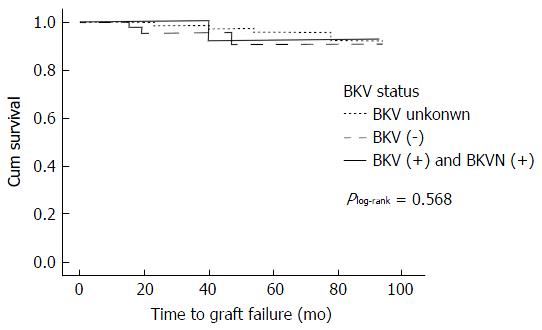
Figure 4 Kaplan-Meier plot showing graft failure rates comparing renal transplant recipients with different BK polyomavirus status censored for death without graft failure and recipients transferred.
BKV: BK polyomavirus; BKVN: BK polyomavirus nephropathy.
- Citation: Hsiao CY, Pilmore HL, Zhou L, de Zoysa JR. Outcomes of renal transplant recipients with BK virus infection and BK virus surveillance in the Auckland region from 2006 to 2012. World J Nephrol 2016; 5(6): 497-506
- URL: https://www.wjgnet.com/2220-6124/full/v5/i6/497.htm
- DOI: https://dx.doi.org/10.5527/wjn.v5.i6.497


