Copyright
©The Author(s) 2016.
World J Nephrol. Sep 6, 2016; 5(5): 471-481
Published online Sep 6, 2016. doi: 10.5527/wjn.v5.i5.471
Published online Sep 6, 2016. doi: 10.5527/wjn.v5.i5.471
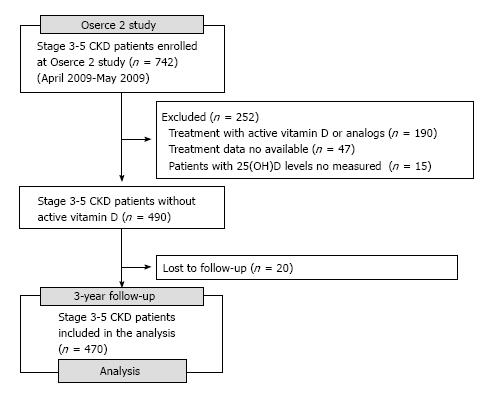
Figure 1 Flow diagram of patient selection for analysis.
CKD: Chronic kidney disease; 25(OH)D: 25-hydroxivitamin D.
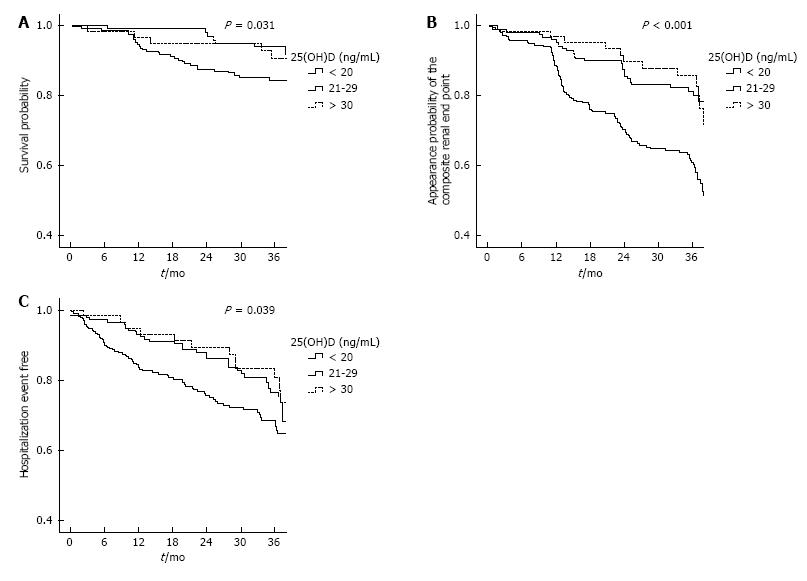
Figure 2 Kaplan-Meier survival (A), and appearance of the composite renal endpoint (B) and the hospitalization (C) curves as a function of 25-hydroxyvitamin D levels (< 20 ng/mL, 20-29 ng/mL and ≥ 30 ng/mL).
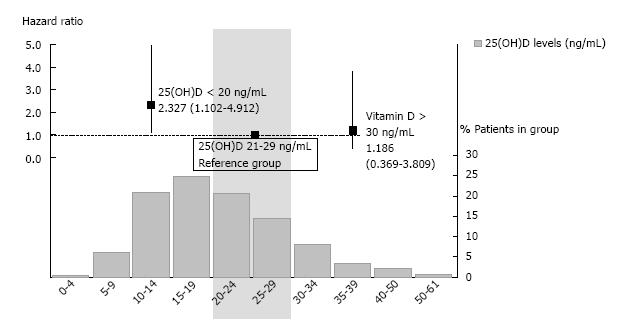
Figure 3 Proportion of patients with different 25-hydroxyvitamin D levels and hazard ratio (95%CI) for mortality after adjustment by age, comorbidity, diabetes mellitus, estimated glomerular filtration rate and albumin levels.
25(OH)D: 25-hydroxivitamin D.
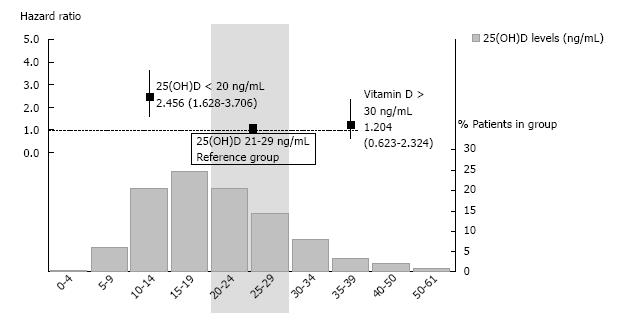
Figure 4 Proportion of patients with different 25-hydroxyvitamin D levels and hazard ratio (95%CI) for composite renal end-point after adjustment by age, sex, diabetes mellitus, estimated glomerular filtration rate and albumin levels.
25(OH)D: 25-hydroxivitamin D.
- Citation: Molina P, Górriz JL, Molina MD, Beltrán S, Vizcaíno B, Escudero V, Kanter J, Ávila AI, Bover J, Fernández E, Nieto J, Cigarrán S, Gruss E, Fernández-Juárez G, Martínez-Castelao A, Navarro-González JF, Romero R, Pallardó LM. What is the optimal level of vitamin D in non-dialysis chronic kidney disease population? World J Nephrol 2016; 5(5): 471-481
- URL: https://www.wjgnet.com/2220-6124/full/v5/i5/471.htm
- DOI: https://dx.doi.org/10.5527/wjn.v5.i5.471


