Copyright
©The Author(s) 2016.
World J Nephrol. Sep 6, 2016; 5(5): 429-436
Published online Sep 6, 2016. doi: 10.5527/wjn.v5.i5.429
Published online Sep 6, 2016. doi: 10.5527/wjn.v5.i5.429
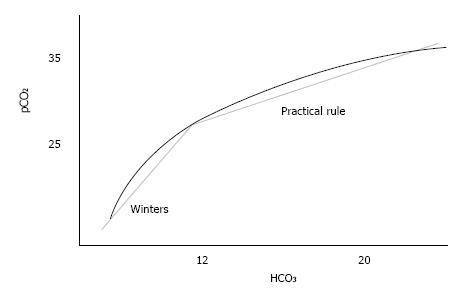
Figure 2 Relationship between pressure of carbon dioxide and bicarbonate concentration in chronic metabolic acidosis.
The relationship between pCO2 and HCO3 during metabolic acidosis is graphically depicted as a curve. Two linear approximations (straight lines) equivalent to Winters’ formula (pCO2 = 1.5 × HCO3 + 8) and to the practical rule (pCO2 = 1.2 × HCO3 + 11.2) are also shown. HCO3: Bicarbonate concentration; pCO2: Pressure of carbon dioxide.
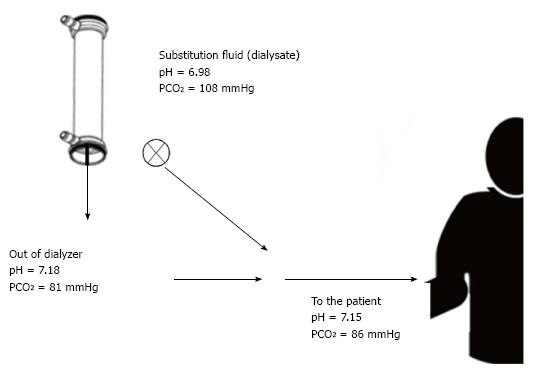
Figure 3 Example of gas analysis in on-line hemodiafiltration.
Additional CO2 load delivered via substitution fluid infusion during online hemodiafiltration. Reproduced with permission from Marano et al[30]. CO2: Carbon dioxide.
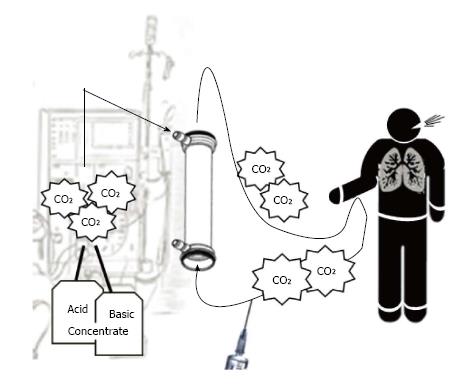
Figure 4 Course of carbon dioxide in presence of vascular access recirculation.
pCO2 from dialyzer re-entering the extracorporeal circuit reveals vascular access recirculation. pCO2: Pressure of carbon dioxide.
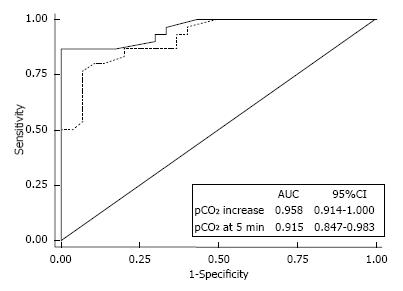
Figure 5 Performance of “RecirCO2lation” test to detect vascular access recirculation.
Receiver operating curves of pCO2-increase (solid line) and pCO2 at 5 min (dotted line) for diagnosis of vascular access recirculation using Glucose Infusion Test (> 0.3%) as reference. Reproduced with permission from Marano et al[32]. AUC: Area under curve; pCO2: Pressure of carbon dioxide.
- Citation: Marano M, D’Amato A, Cantone A. Carbon dioxide: Global warning for nephrologists. World J Nephrol 2016; 5(5): 429-436
- URL: https://www.wjgnet.com/2220-6124/full/v5/i5/429.htm
- DOI: https://dx.doi.org/10.5527/wjn.v5.i5.429


