Copyright
©The Author(s) 2016.
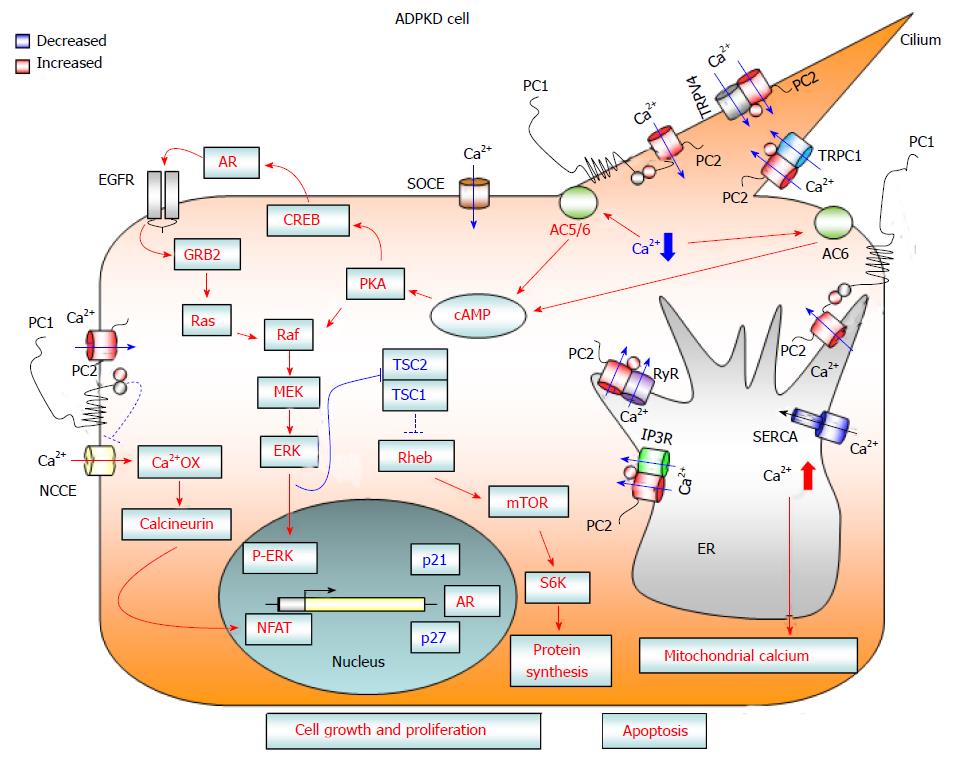
Figure 1 Diagram showing calcium-dependent dysregulated signaling pathways that promote cell proliferation and apoptosis in autosomal dominant polycystic kidney disease cells.
Loss of PC1 and/or PC2 function causes a reduction in cytosolic calcium influx from three different cellular compartments: (1) the primary cilium after mechanical stimuli; (2) the endoplasmic reticulum, in an IP3R- and RyR-dependent manner; and (3) the plasma membrane, through a reduction in SOCE channel activity. The reduced concentration of cytosolic calcium may activate Ca2+ sensitive adenylyl cyclases 5 and 6, leading to a rise in cAMP. Increased levels of cAMP cause the activation of B-Raf/MEK/ERK and CREB/AREG/EGFR pathways, as well as stimulating mTOR signaling, through the active form of ERK kinases that inactivate the TSC1/TSC2 complex. Moreover, deficiency of PC1 and/or PC2 enhances the activity of NCCE channels, which, by increasing calcium oscillation frequency, results in the activation of the transcription factor NFAT. The abnormal activation of these signaling pathways promotes cell proliferation and kidney cyst formation. In addition, the reduction in Ca2+ influx from the ER to the cytosol caused by a deficiency in PC2 channel activity brings about an imbalance in ER calcium concentration, resulting in ER Ca2+ overload. The increased ER calcium concentration sensitizes kidney cystic cells to apoptotic stimuli by abnormal ER calcium release, which may induce mitochondrial damage and thereby lead to cytochrome C release and activation of apoptosis. AC 5/6: Adenylyl cyclase 5/6; AR: Amphiregulin; Ca2+ OX: Calcium oscillations; cAMP: Cyclic adenosine monophosphate; CREB: cAMP response element binding transcription factor; EGFR: Epidermal growth factor receptor; ER: Endoplasmic reticulum; ERK: Extracellular-signal-regulated kinases; GRB2: Growth factor receptor-bound protein 2; IP3R: Inositol 1,4,5-trisphosphate receptor; MEK: Mitogen-activated protein kinase kinase; mTOR: Mammalian target of rapamycin; NCCE: Non-capacitative calcium channel entry; NFAT: Nuclear factor of activated T-cells; PKA: Protein kinase A; PC1: Polycystin-1; PC2: Polycystin-2; S6K: Ribosomal S6 kinase; Raf: Rapidly accelerated fibrosarcoma kinase; Ras: Rat sarcoma viral oncogene homolog family; Rheb: Ras homolog enriched in brain; RyR: Ryanodine receptor; SERCA: Sarcoplasmic endoplasmic reticulum calcium ATPase; SOCE: Store-operated calcium channel entry; TRPC1: Transient receptor potential channel 1; TRPV4: Transient receptor potential cation channel subfamily V member 4; TSC: Tuberous sclerosis complex.
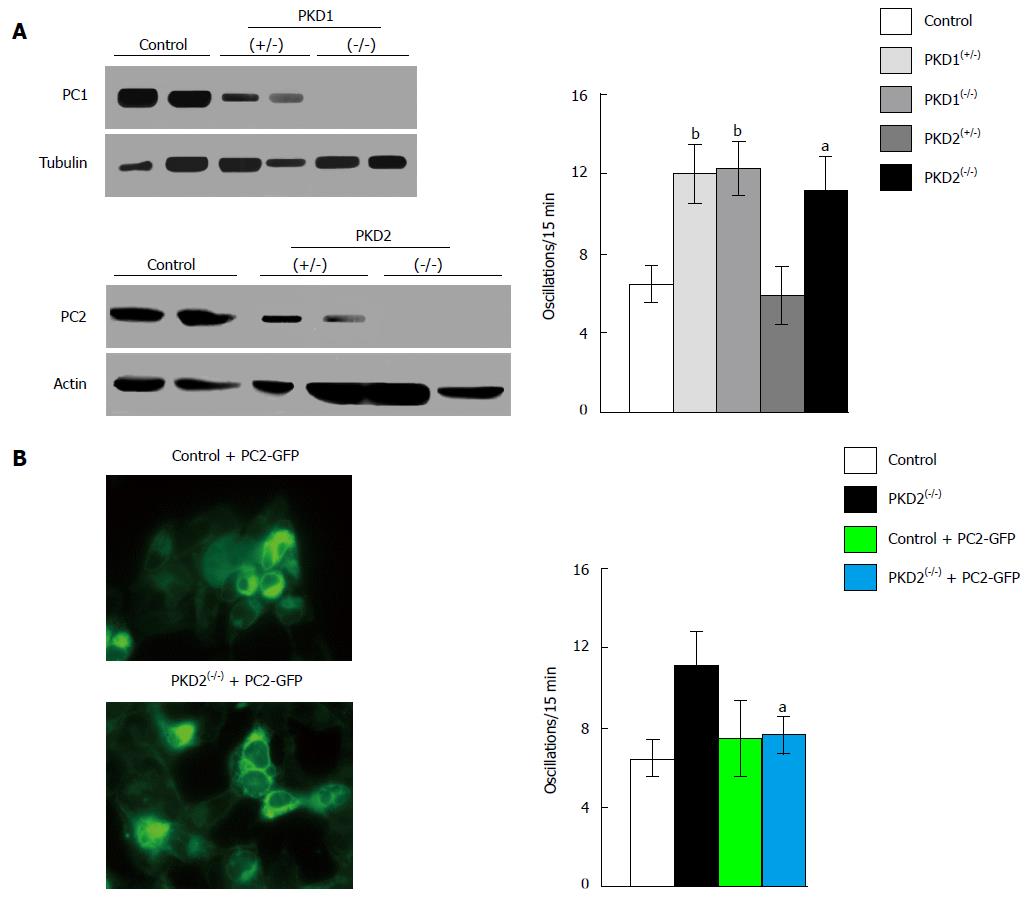
Figure 2 Downregulation of PKD1 and PKD2 genes increases fetal bovine serum-induced calcium oscillations in HEK293 cells.
A: The stable transfection of HEK293 cells with plasmids containing specific anti-PKD1 and anti-PKD2 sequences causes a partial (+/-) or complete (-/-) downregulation of PC1 and PC2 expression compared with HEK293 cells stably transfected with scramble sequences (control). PKD1 and PKD2 gene silencing was evaluated by Western blotting using anti-PC1 and anti-PC2 antibodies. Calcium oscillations were increased in both partially (+/-) and fully (-/-) cells silenced for the PKD1 gene, as well as in fully (-/-) PKD2-silenced cells, as compared with scramble-treated cells (control). The number of oscillations/15 min were: 12 ± 1.5 in PKD1(+/-) cells, 12.2 ± 1.42 in PKD1(-/-) cells and 11.13 ± 1.79 in PKD2(-/-) cells, vs 6.39 ± 1.09 in control cells (bP < 0.01; aP < 0.05); B: The expression of full-length exogenous PC2 fused with GFP in PKD2(-/-) cells restores normal calcium oscillations (11.13 ± 1.79 oscillations/15 min in PKD2(-/-) cells vs 7.72 ± 1.07 in PKD2(-/-) cells transiently transfected with PKD2-GFP cDNA; aP < 0.05). Western blotting, oscillation recording and cell imaging were performed as previously reported[16]. Data, obtained from three different experiments analyzing at least 45 cells for every HEK293 clone, are represented as mean ± standard deviation. Analysis of data was performed using Student’s t test, and differences were considered significant at a value of P < 0.05. PKD: Polycystic kidney disease; HEK293: Human embryonic kidney cells; GFP: Green fluorescent protein; PC: Polycystin.
- Citation: Mangolini A, de Stephanis L, Aguiari G. Role of calcium in polycystic kidney disease: From signaling to pathology. World J Nephrol 2016; 5(1): 76-83
- URL: https://www.wjgnet.com/2220-6124/full/v5/i1/76.htm
- DOI: https://dx.doi.org/10.5527/wjn.v5.i1.76


