Copyright
©The Author(s) 2016.
World J Nephrol. Jan 6, 2016; 5(1): 115-124
Published online Jan 6, 2016. doi: 10.5527/wjn.v5.i1.115
Published online Jan 6, 2016. doi: 10.5527/wjn.v5.i1.115
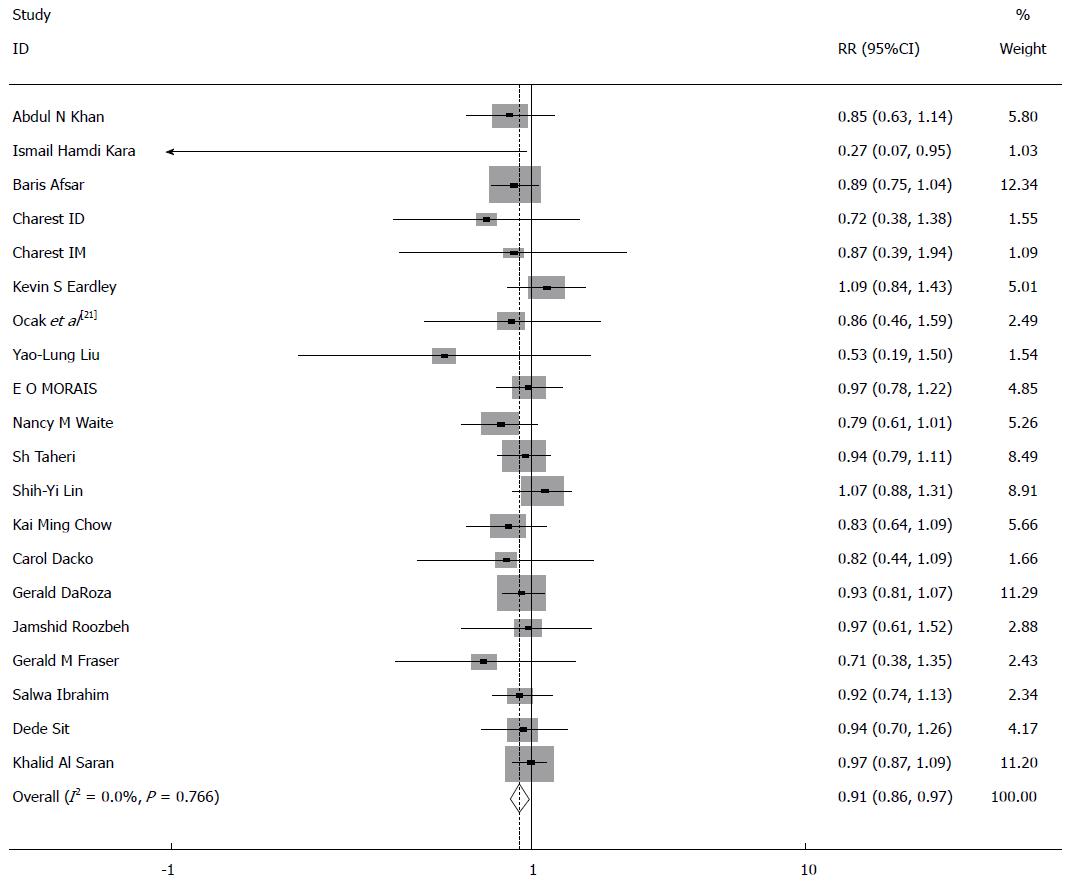
Figure 1 Forest plot: Meta-analysis of the association between gender of the end-stage renal disease patients and seroresponse to hepatitis B vaccination.
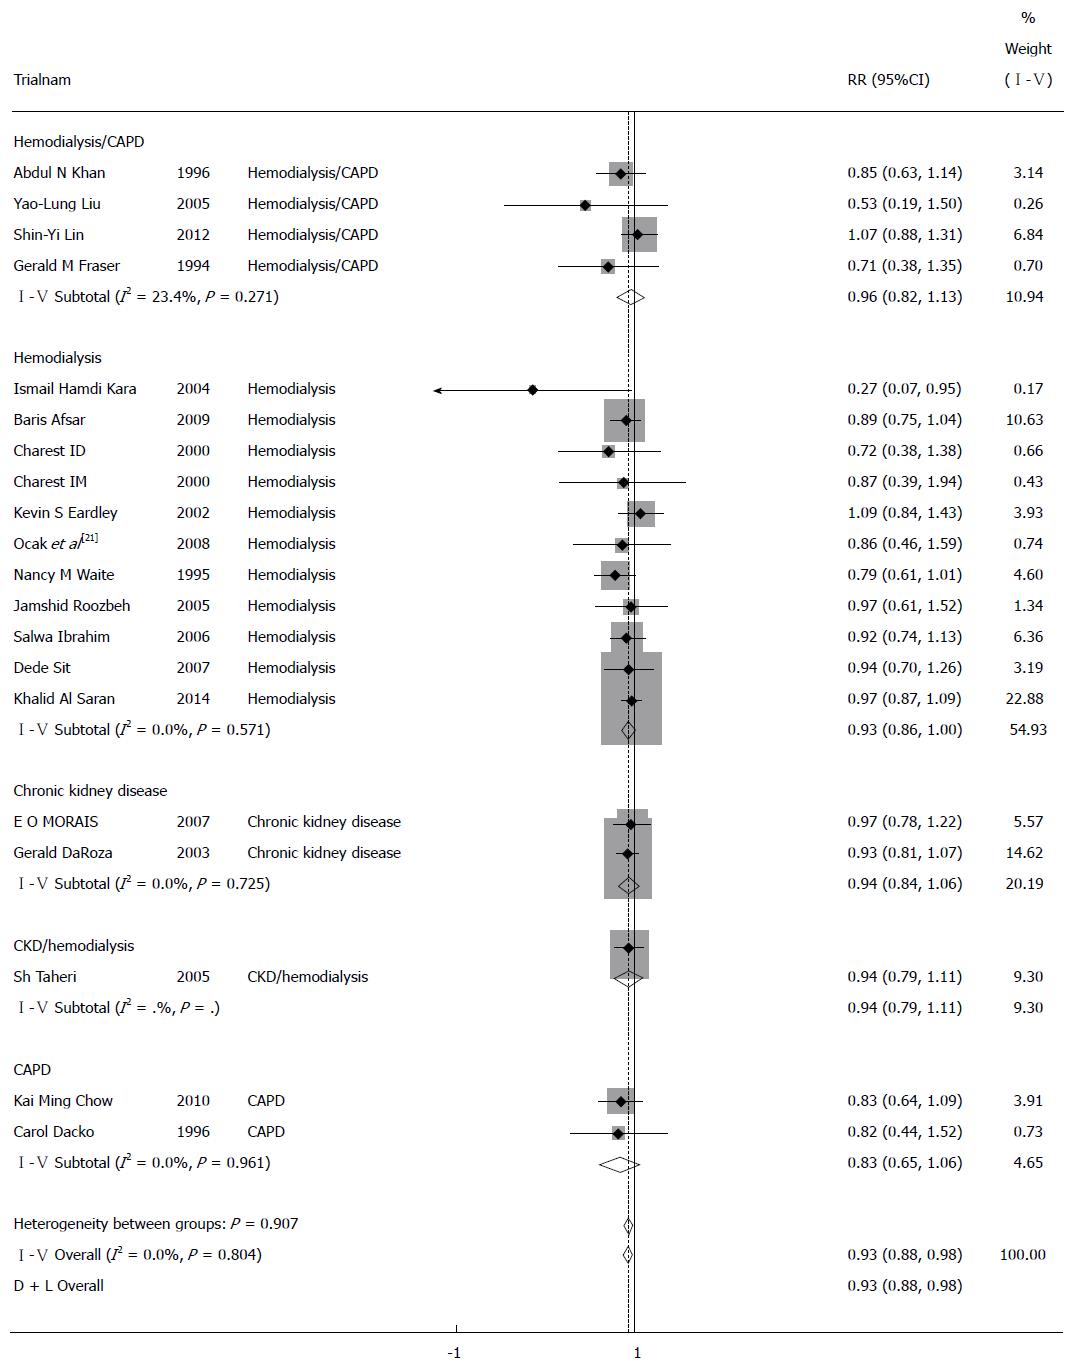
Figure 2 Forest plot: Meta-analysis of the association between gender of the end-stage renal disease patients and seroresponse to hepatitis B vaccination in patients with different therapy modality.
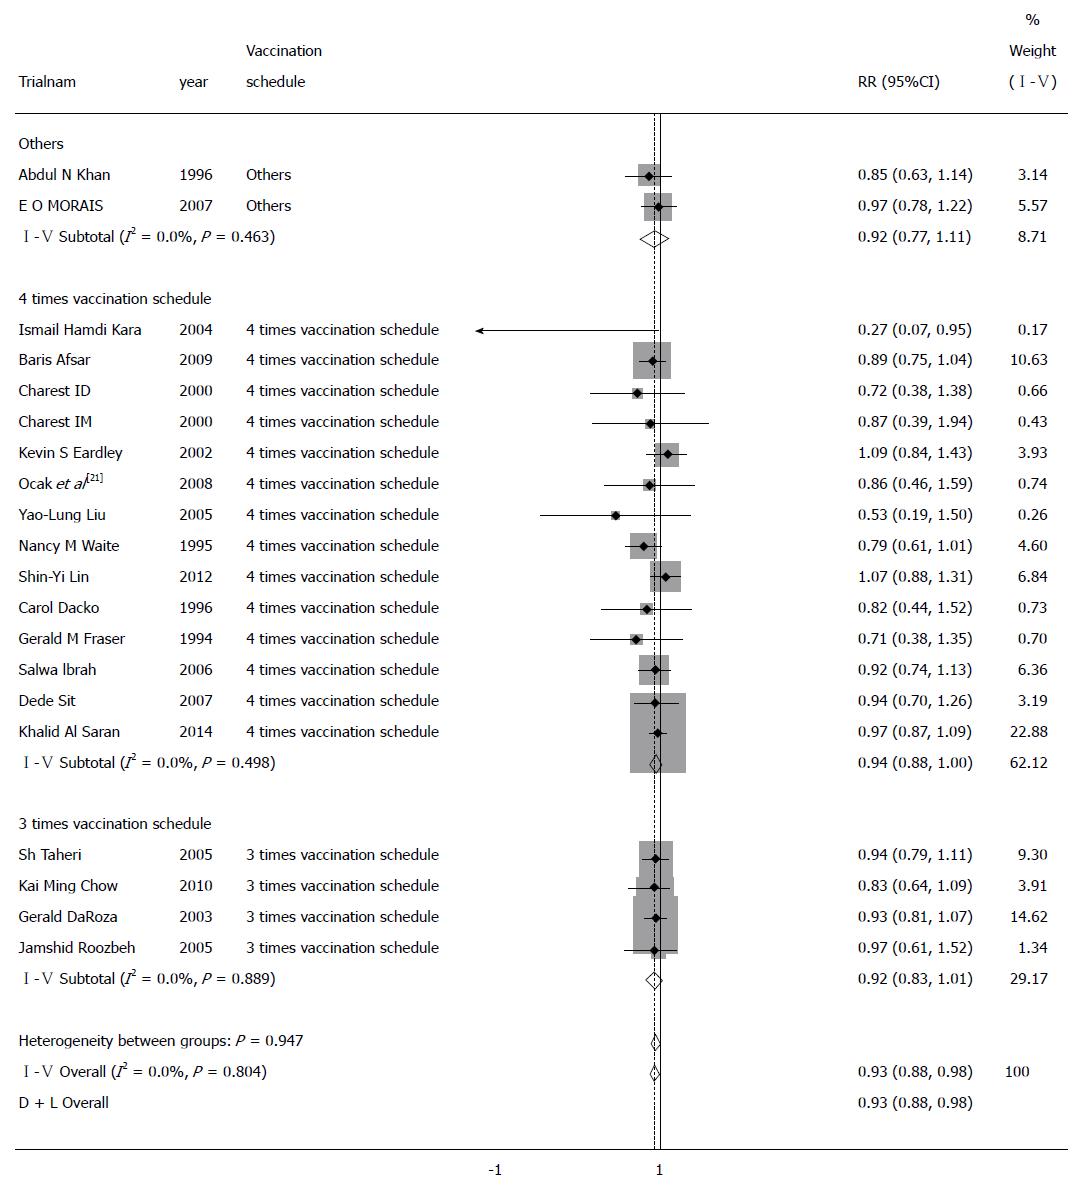
Figure 3 Forest plot: Meta-analysis of the association between gender of the end-stage renal disease patients and seroresponse to hepatitis B vaccination in patients with different vaccination schedules.
- Citation: Khedmat H, Aghaei A, Ghamar-Chehreh ME, Agah S. Sex bias in response to hepatitis B vaccination in end-stage renal disease patients: Meta-analysis. World J Nephrol 2016; 5(1): 115-124
- URL: https://www.wjgnet.com/2220-6124/full/v5/i1/115.htm
- DOI: https://dx.doi.org/10.5527/wjn.v5.i1.115


