Copyright
©The Author(s) 2015.
World J Nephrol. Jul 6, 2015; 4(3): 423-437
Published online Jul 6, 2015. doi: 10.5527/wjn.v4.i3.423
Published online Jul 6, 2015. doi: 10.5527/wjn.v4.i3.423
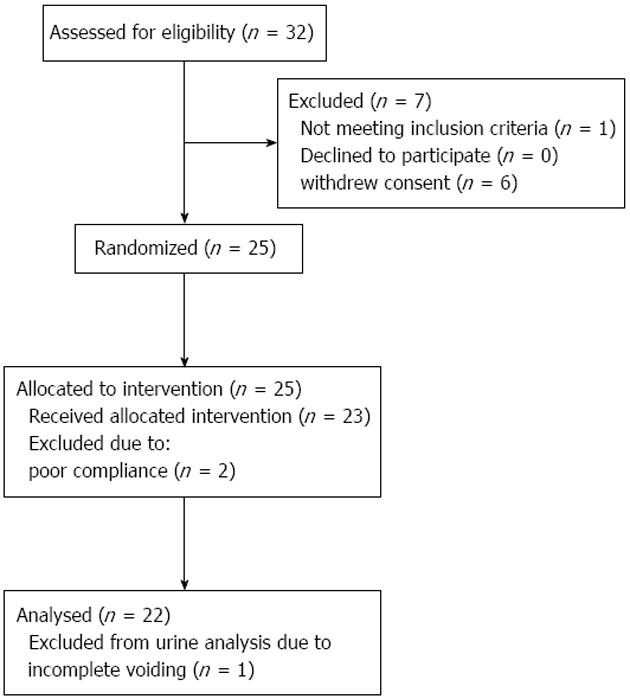
Figure 1 Flow chart.
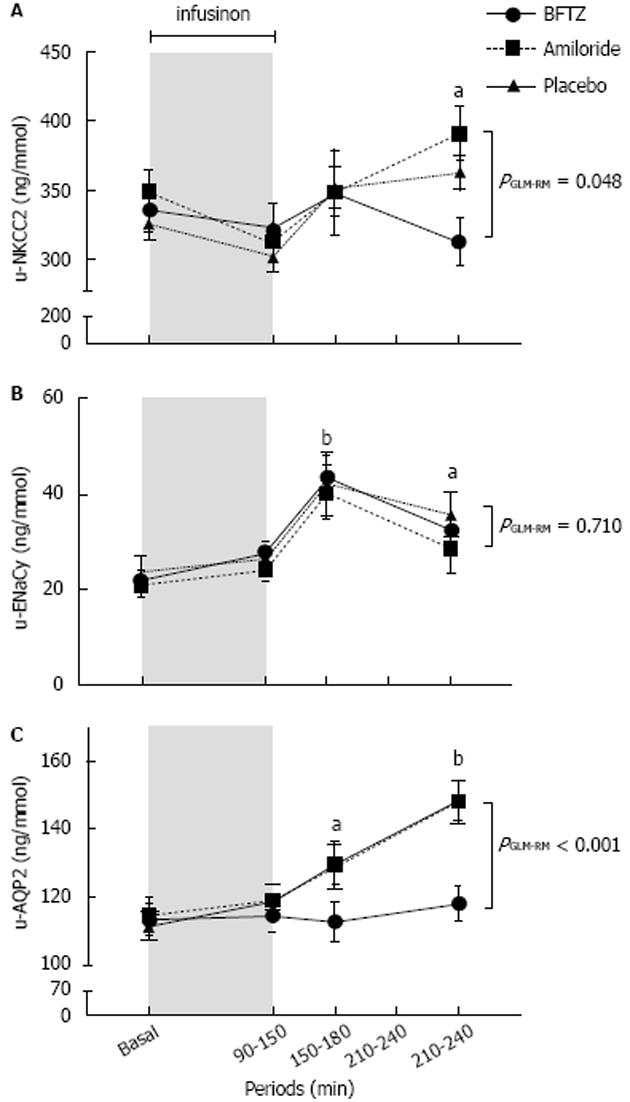
Figure 2 Effects of 3% hypertonic saline on urinary excretion of sodium-potassium-2chloride co-transporter (A), gamma fraction of epithelial sodium channels (B) and aquaporin2 (C) in 22 healthy subjects treated with bendroflumethiazide, amiloride or placebo.
Values are means ± SEM. General linear model with repeated measurements (GLM-RM) was performed to test for differences between groups. A: U-NKCC2 increased during amiloride (P = 0.081) and placebo (P = 0.010) treatments. The increase in u-NKCC2 was however only significant during placebo. U-NKCC2 did not change during BFTZ; B: U-ENaCγ increased significantly and to the same extent during all three treatments; C: U-AQP2 increased significantly during amiloride and placebo (P < 0.001), but not during BFTZ. Paired t-test was used for comparison of post-infusion periods vs baseline. aP < 0.050; bP < 0.001. AQP2: Aquaporin2; U-NKCC2: Urinary excretion of sodium-potassium-2chloride co-transporter; ENaC: Epithelial sodium channels; BFTZ: Bendroflumethiazide.
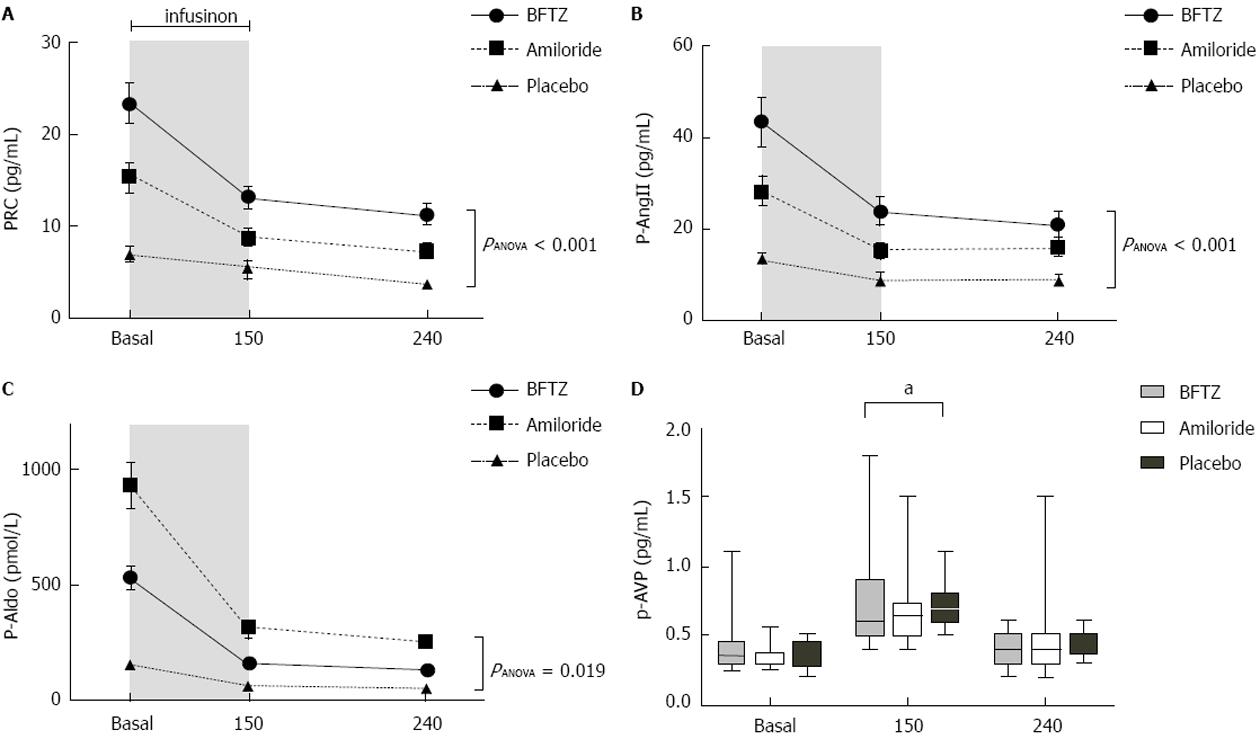
Figure 3 Effects of 3% hypertonic saline on plasma concentrations of renin (A), angiotensin II (B), aldosterone (C) and arginine vasopressin (D) in 23 healthy subjects pre-treated with bendroflumethiazide, amiloride or placebo.
A-C: There was a significant difference between PRC, p-AngII and p-Aldo plasma levels throughout the study day. Values are means ± SEM. One-way ANOVA was used to test for differences between treatments; D: P-AVP increased significantly at 150 min with a borderline significant difference between treatments (aP = 0.048). Values are medians with upper and lower limits. Friedman’s test was used to test for differences between treatments. BFTZ: Bendroflumethiazide; PRC: Plasma renin concentration.
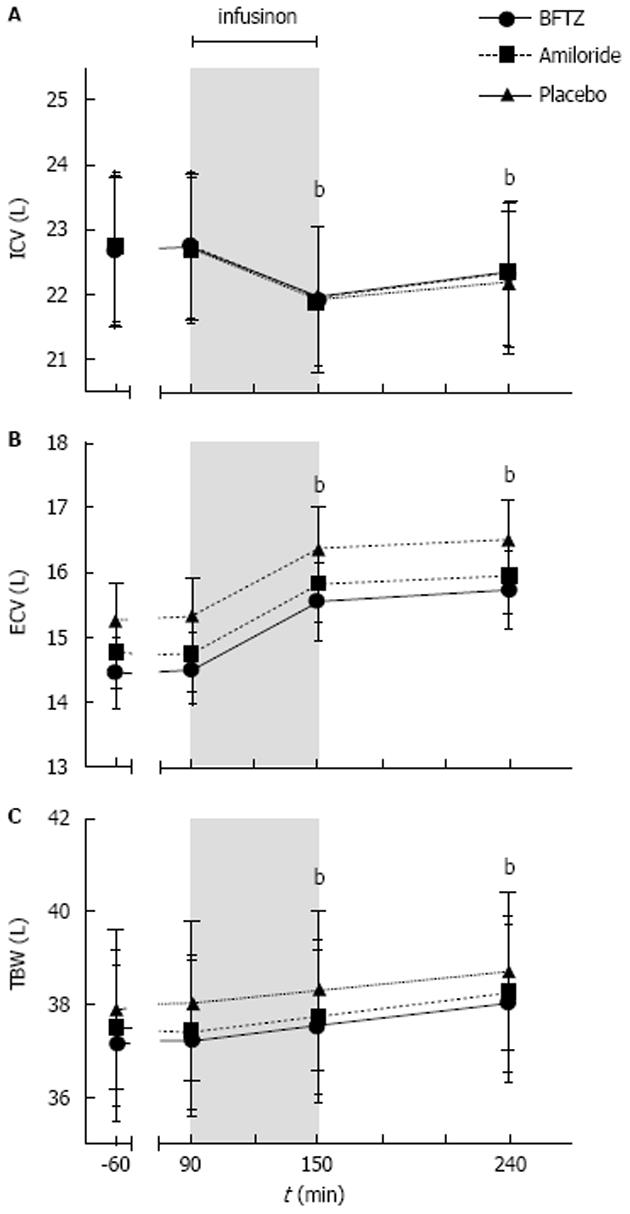
Figure 4 Effects of 3% hypertonic saline on (A) intracellular and (B) extracellular volume and (C) total body water in 23 healthy subjects pretreated with bendroflumethiazide, amiloride or placebo.
Values are means ± SEM. General linear model with repeated measures was non-significant between treatments. Paired t-test was used for comparison of post infusion periods vs baseline bP < 0.001. BFTZ: Bendroflumethiazide; ECV: Extracellular volume; ICV: Intracellular volume; TBW: Total body water.
- Citation: Jensen JM, Mose FH, Kulik AEO, Bech JN, Fenton RA, Pedersen EB. Changes in urinary excretion of water and sodium transporters during amiloride and bendroflumethiazide treatment. World J Nephrol 2015; 4(3): 423-437
- URL: https://www.wjgnet.com/2220-6124/full/v4/i3/423.htm
- DOI: https://dx.doi.org/10.5527/wjn.v4.i3.423


