Copyright
©The Author(s) 2015.
World J Nephrol. Jul 6, 2015; 4(3): 330-344
Published online Jul 6, 2015. doi: 10.5527/wjn.v4.i3.330
Published online Jul 6, 2015. doi: 10.5527/wjn.v4.i3.330
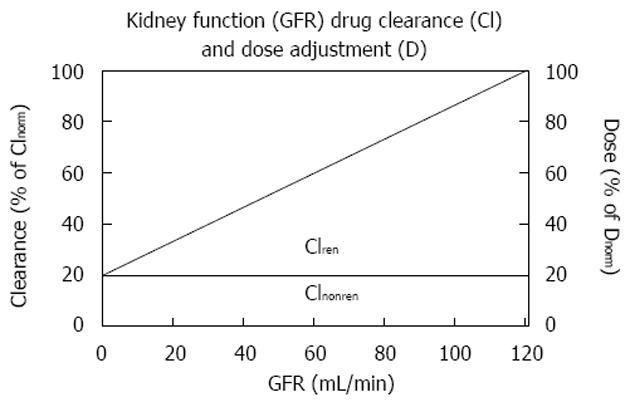
Figure 1 Linear correlation between drug clearance and the glomerular filtration rate as a measure of kidney function[20].
The dose can be adjusted in proportion to the reduced drug clearance, where Cl = Clren + Clnonren. GFR: Glomerular filtration rate.
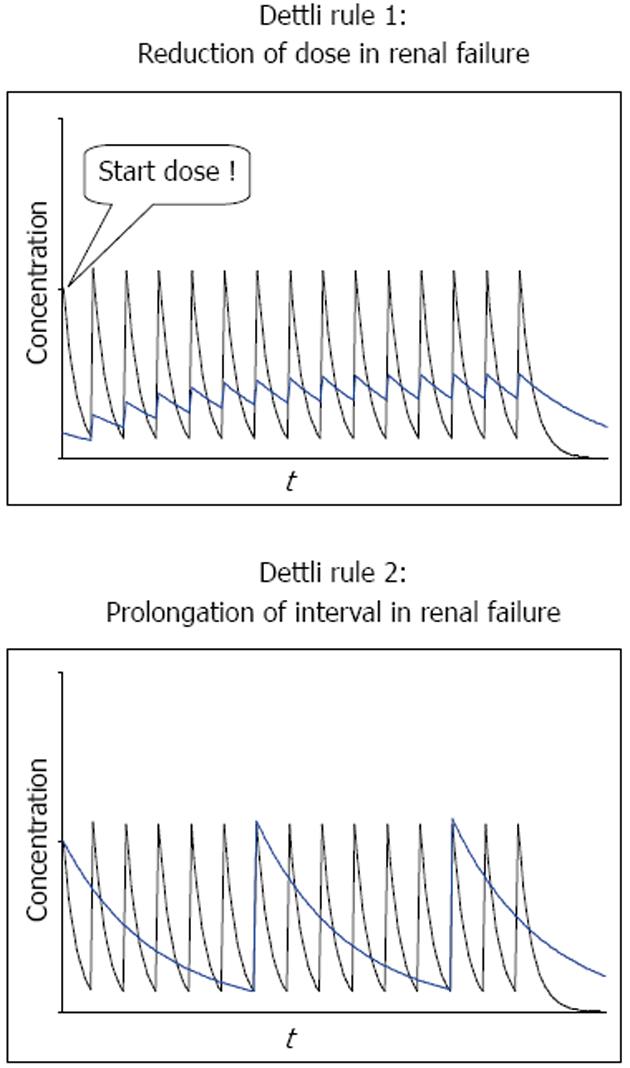
Figure 2 Dettli rules 1 and 2 for drug dose adjustment in kidney dysfunction.
Dettli rule 1 leads to higher trough concentrations but lower peaks. To obtain an immediate antimicrobial effect, a loading dose must be given. With Dettli rules 1 and 2, the area under the curve AUC remains constant.
Math 8 Math(A1).
Math 9 Math(A1).
Math 10 Math(A1).
Math 11 Math(A1).
Math 12 Math(A1).
Math 13 Math(A1).
Math 14 Math(A1).
Math 15 Math(A1).
Math 16 Math(A1).
Math 17 Math(A1).
Math 18 Math(A1).
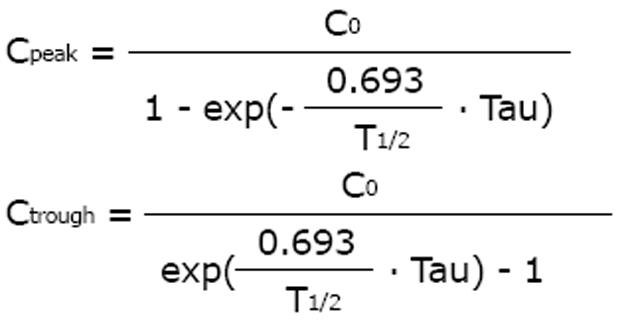
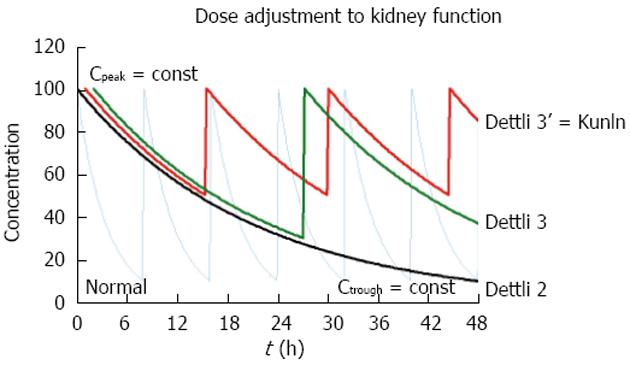
Figure 3 It is most practical to keep the peak concentration constant when the drug dose is adjusted to impaired kidney function[9].
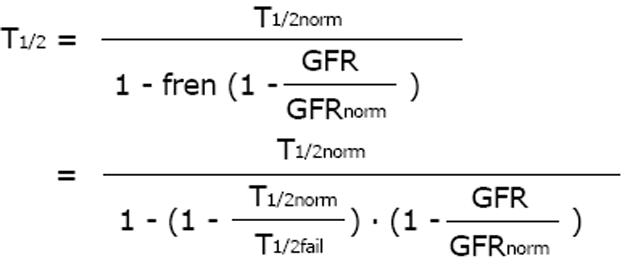
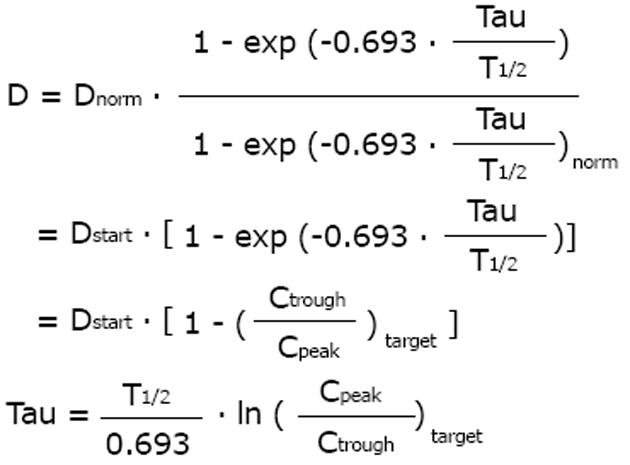
With the eliminated fraction rule (Dettli 3), any dose and any interval can be estimated and selected. The Kunin rule is a special case of the Dettli rule 3 for the condition Ctrough = 1/2 Cpeak. With the Kunin rule and the Dettli rule 3, the area AUC is higher than under conditions with normal kidney function.
Math 19 Math(A1).
Math 20 Math(A1).
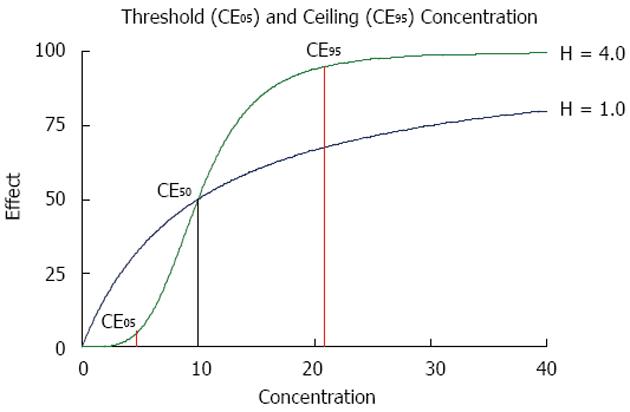
Figure 4 Pharmacodynamics.
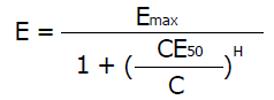
The threshold concentration CE05 produces 5% and the ceiling concentration CE95 produces 95% of the maximum effect. With a Hill coefficient of H = 1.0, the concentration is CE05 = 0.5 units and the CE95 = 190 units whereas for a higher Hill coefficient of H = 4.0, the threshold is high with CE05 = 6.0 units but the ceiling is low with CE95 = 21 units.
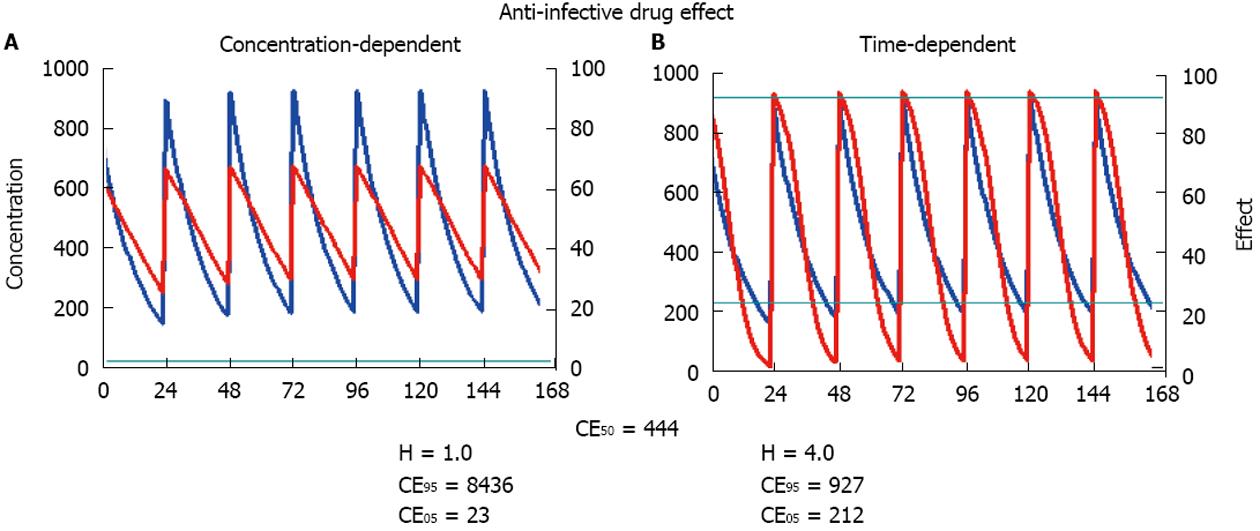
Figure 5 Pharmacodynamics of anti-infective drugs.
The pharmacokinetics and the concentration curves are equal in both diagrams. Also the concentration producing the half-maximum effect is the same but the Hill coefficient is different. A: Concentration-dependent effect: With a Hill coefficient of H = 1.0, the calculated peak effect is only 60% and far from the ceiling effect CE95. Thus, the concentration-dependent effect could be strengthened by increasing the dose; B: Time-dependent effect: With a Hill coefficient of H = 4.0, the calculated trough effect falls below the threshold concentration CE05 at the second part of the administration interval. Thus, the time-dependent effect could be strengthened by dosing more frequently.
Math 21 Math(A1).
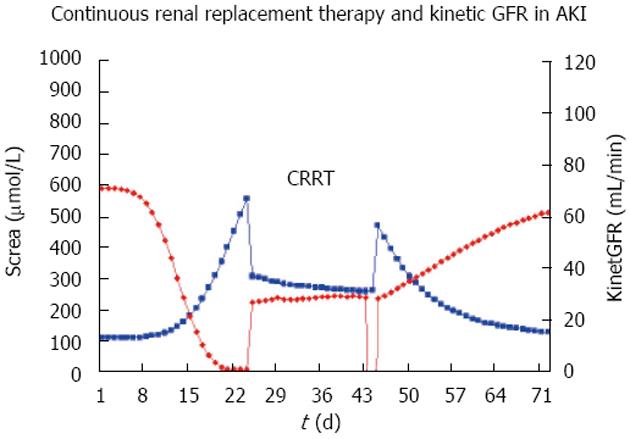
Figure 6 Serum creatinine (Screa) and estimated kinetic glomerular filtration rate in acute kidney injury.
The kinetic GFR can also be estimated during continuous renal replacement therapy continuous hemofiltration (CRRT)[14]. GFR: Glomerular filtration rate; AKI: Acute kidney injury.
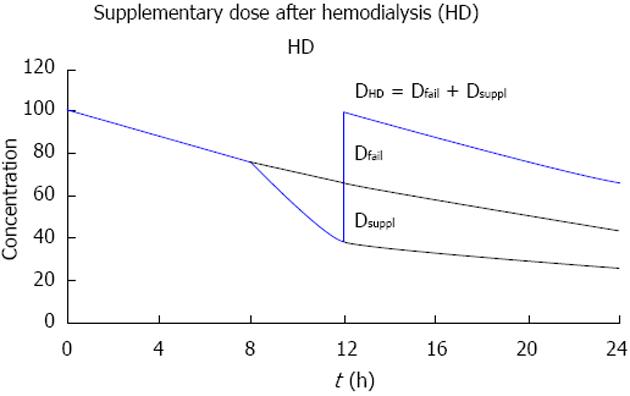
Figure 7 The dose after dialysis (DHD) replaces both the dose adjusted for kidney failure (Dfail), and the supplementary dose (Dsuppl) that compensates for the fraction (FR) removed during hemodialysis (HD).
Math 22 Math(A1).
- Citation: Keller F, Schröppel B, Ludwig U. Pharmacokinetic and pharmacodynamic considerations of antimicrobial drug therapy in cancer patients with kidney dysfunction. World J Nephrol 2015; 4(3): 330-344
- URL: https://www.wjgnet.com/2220-6124/full/v4/i3/330.htm
- DOI: https://dx.doi.org/10.5527/wjn.v4.i3.330


