Copyright
©The Author(s) 2015.
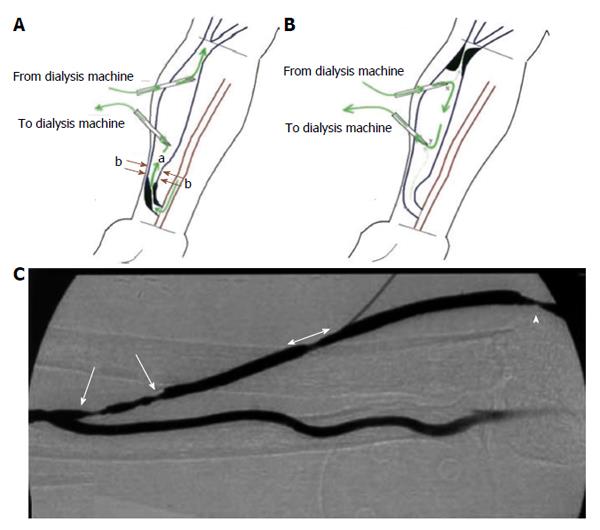
Figure 1 Schematic of the locations of (A) inflow stenosis, and (B) outflow lesion with respect to the anastomosis and cannulation sites[27].
The (green) arrows in A and B represent the direction of blood flow within the arteriovenous fistulas (AVF) and the dialysis needles; B: Depicts a recirculation condition under which due to significant outflow stenosis the blood flow from dialysis machine returns back to dialyzer; C: An angiographic picture of an AVF with multiple inflow stenoses (single head arrows) and outflow stenosis (double head arrow and the arrow head). Reprinted from Asif et al[25] and Fahrtash et al[27], with permission.
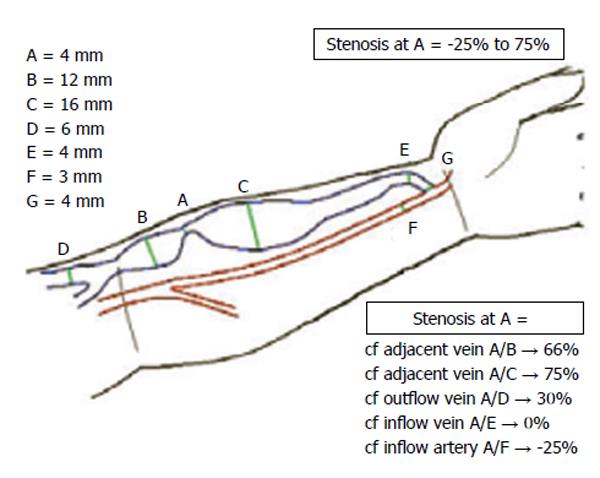
Figure 2 Dependency of stenosis severity to the location of reference cross sec-tion[27].
In this figure stenosis is located at A. Depending on the location of the reference cross-section, one can calculate a stenosis severity ranging from -25% to 75%. The -25% diameter changes represents a case in which the minimum diameter in the arteriovenous fistulas circuit has happened elsewhere than cross-section A. Reprinted from Fahrtash et al[27], with permission.
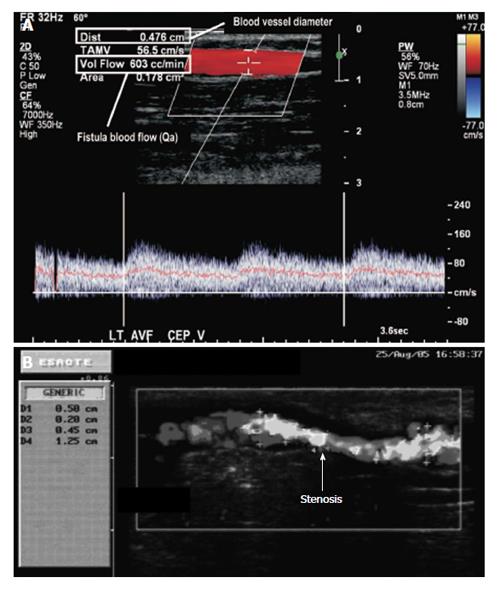
Figure 3 (A) Velocity pulse from Doppler ultrasound, and (B) detection of stenosis and estimating its grade using Doppler ultrasound[8,9].
AVF: Arteriovenous fistula. Reprinted from Campos et al[8] and Feddersen et al[9], with permission.
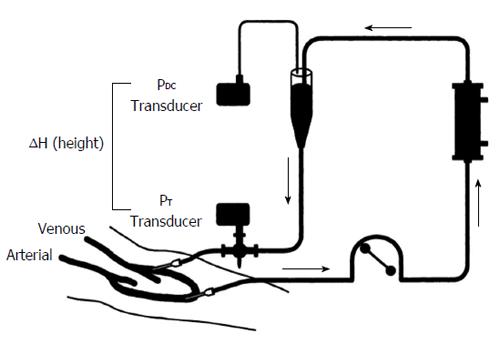
Figure 4 Schematic for measurement of venous access pressure in an arteriovenous graft using pressure transducers located at the venous needle and drip chamber[38].
Reprinted from Besarab et al[38], with permission.
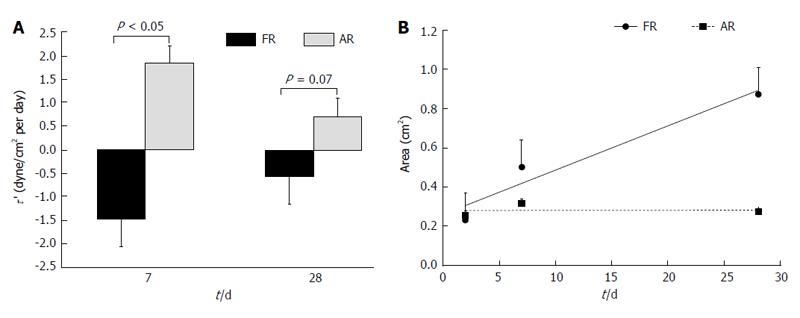
Figure 5 Variation in (A) temporal gradient of wall shear stress and (B) temporal gradient of luminal area of the venous segment for arteriovenous fistulas with favorable remodeling and adverse remodeling over time[50].
FR: Favorable remodeling; AR: Adverse remodeling. The t/d in the x axis stands for time (days). Reprinted from Rajabi-Jagahrgh et al[50], with permission.
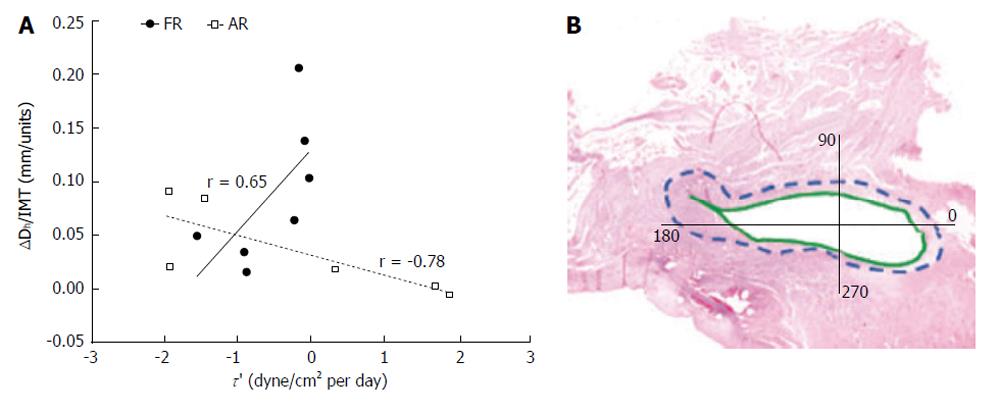
Figure 6 (A) Variation in morphological changes of the venous segment with respect to corresponding temporal gradient of wall shear stress (τ΄) for arteriovenous fistulas with favorable remodeling and adverse remodeling[51].
Morphological changes were quantified by calculating the ratio of differences in luminal diameter of venous segment over time (ΔDh) to the corresponding amount of intima-media thickening (IMT). The IMT was calculated from (B) histology analysis using hematoxylin and eosin (H and E). The IMT was calculated as the average of intima-media thicknesses at four quadrants of each H and E staining slide. FR: Favorable remodeling; AR: Adverse remodeling; AVFs: Arteriovenous fistulas. Reprinted from Rajabi-Jagahrgh et al[51], with permission.
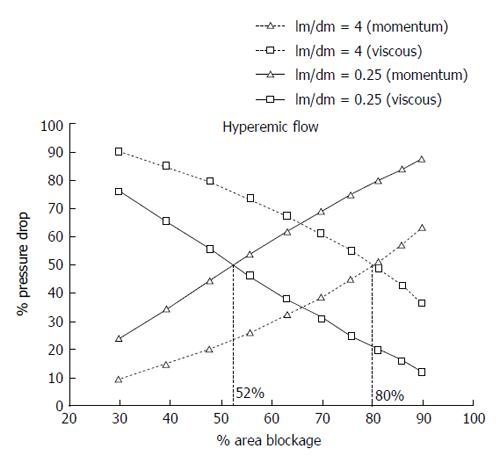
Figure 7 Contribution of viscous losses and losses due to momentum changes to the total pressure drop in a stenosed coronary artery with the increase in the percentage area stenosis[65].
Here, the pressure drop values at different stenosis severity were ob-tained under the corresponding hyperemic flow for coronary arteries. Also, lm and dm represent the length of stenosis throat and diameter of throat, respectively. Reprinted from ref. [65], with permission.
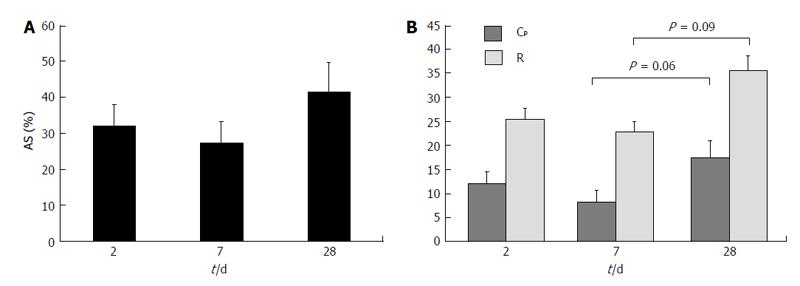
Figure 8 Variation of (A) percentage area stenosis and (B) pressure drop coef-ficient and resistance index over time for arteriovenous fistulas created in a pig model[70].
AS: Area stenosis; Cp: Pressure drop coefficient; R: Resistance index. The t/d in the x axis stands for time (days). © 2014, Copyright the Authors. Artificial Organs, © 2014 International Center for Artificial Organs and Transplantation and Wiley Periodicals, Inc.
- Citation: Rajabi-Jaghargh E, Banerjee RK. Combined functional and anatomical diagnostic endpoints for assessing arteriovenous fistula dysfunction. World J Nephrol 2015; 4(1): 6-18
- URL: https://www.wjgnet.com/2220-6124/full/v4/i1/6.htm
- DOI: https://dx.doi.org/10.5527/wjn.v4.i1.6


