Copyright
©The Author(s) 2023.
World J Nephrol. Dec 25, 2023; 12(5): 132-146
Published online Dec 25, 2023. doi: 10.5527/wjn.v12.i5.132
Published online Dec 25, 2023. doi: 10.5527/wjn.v12.i5.132
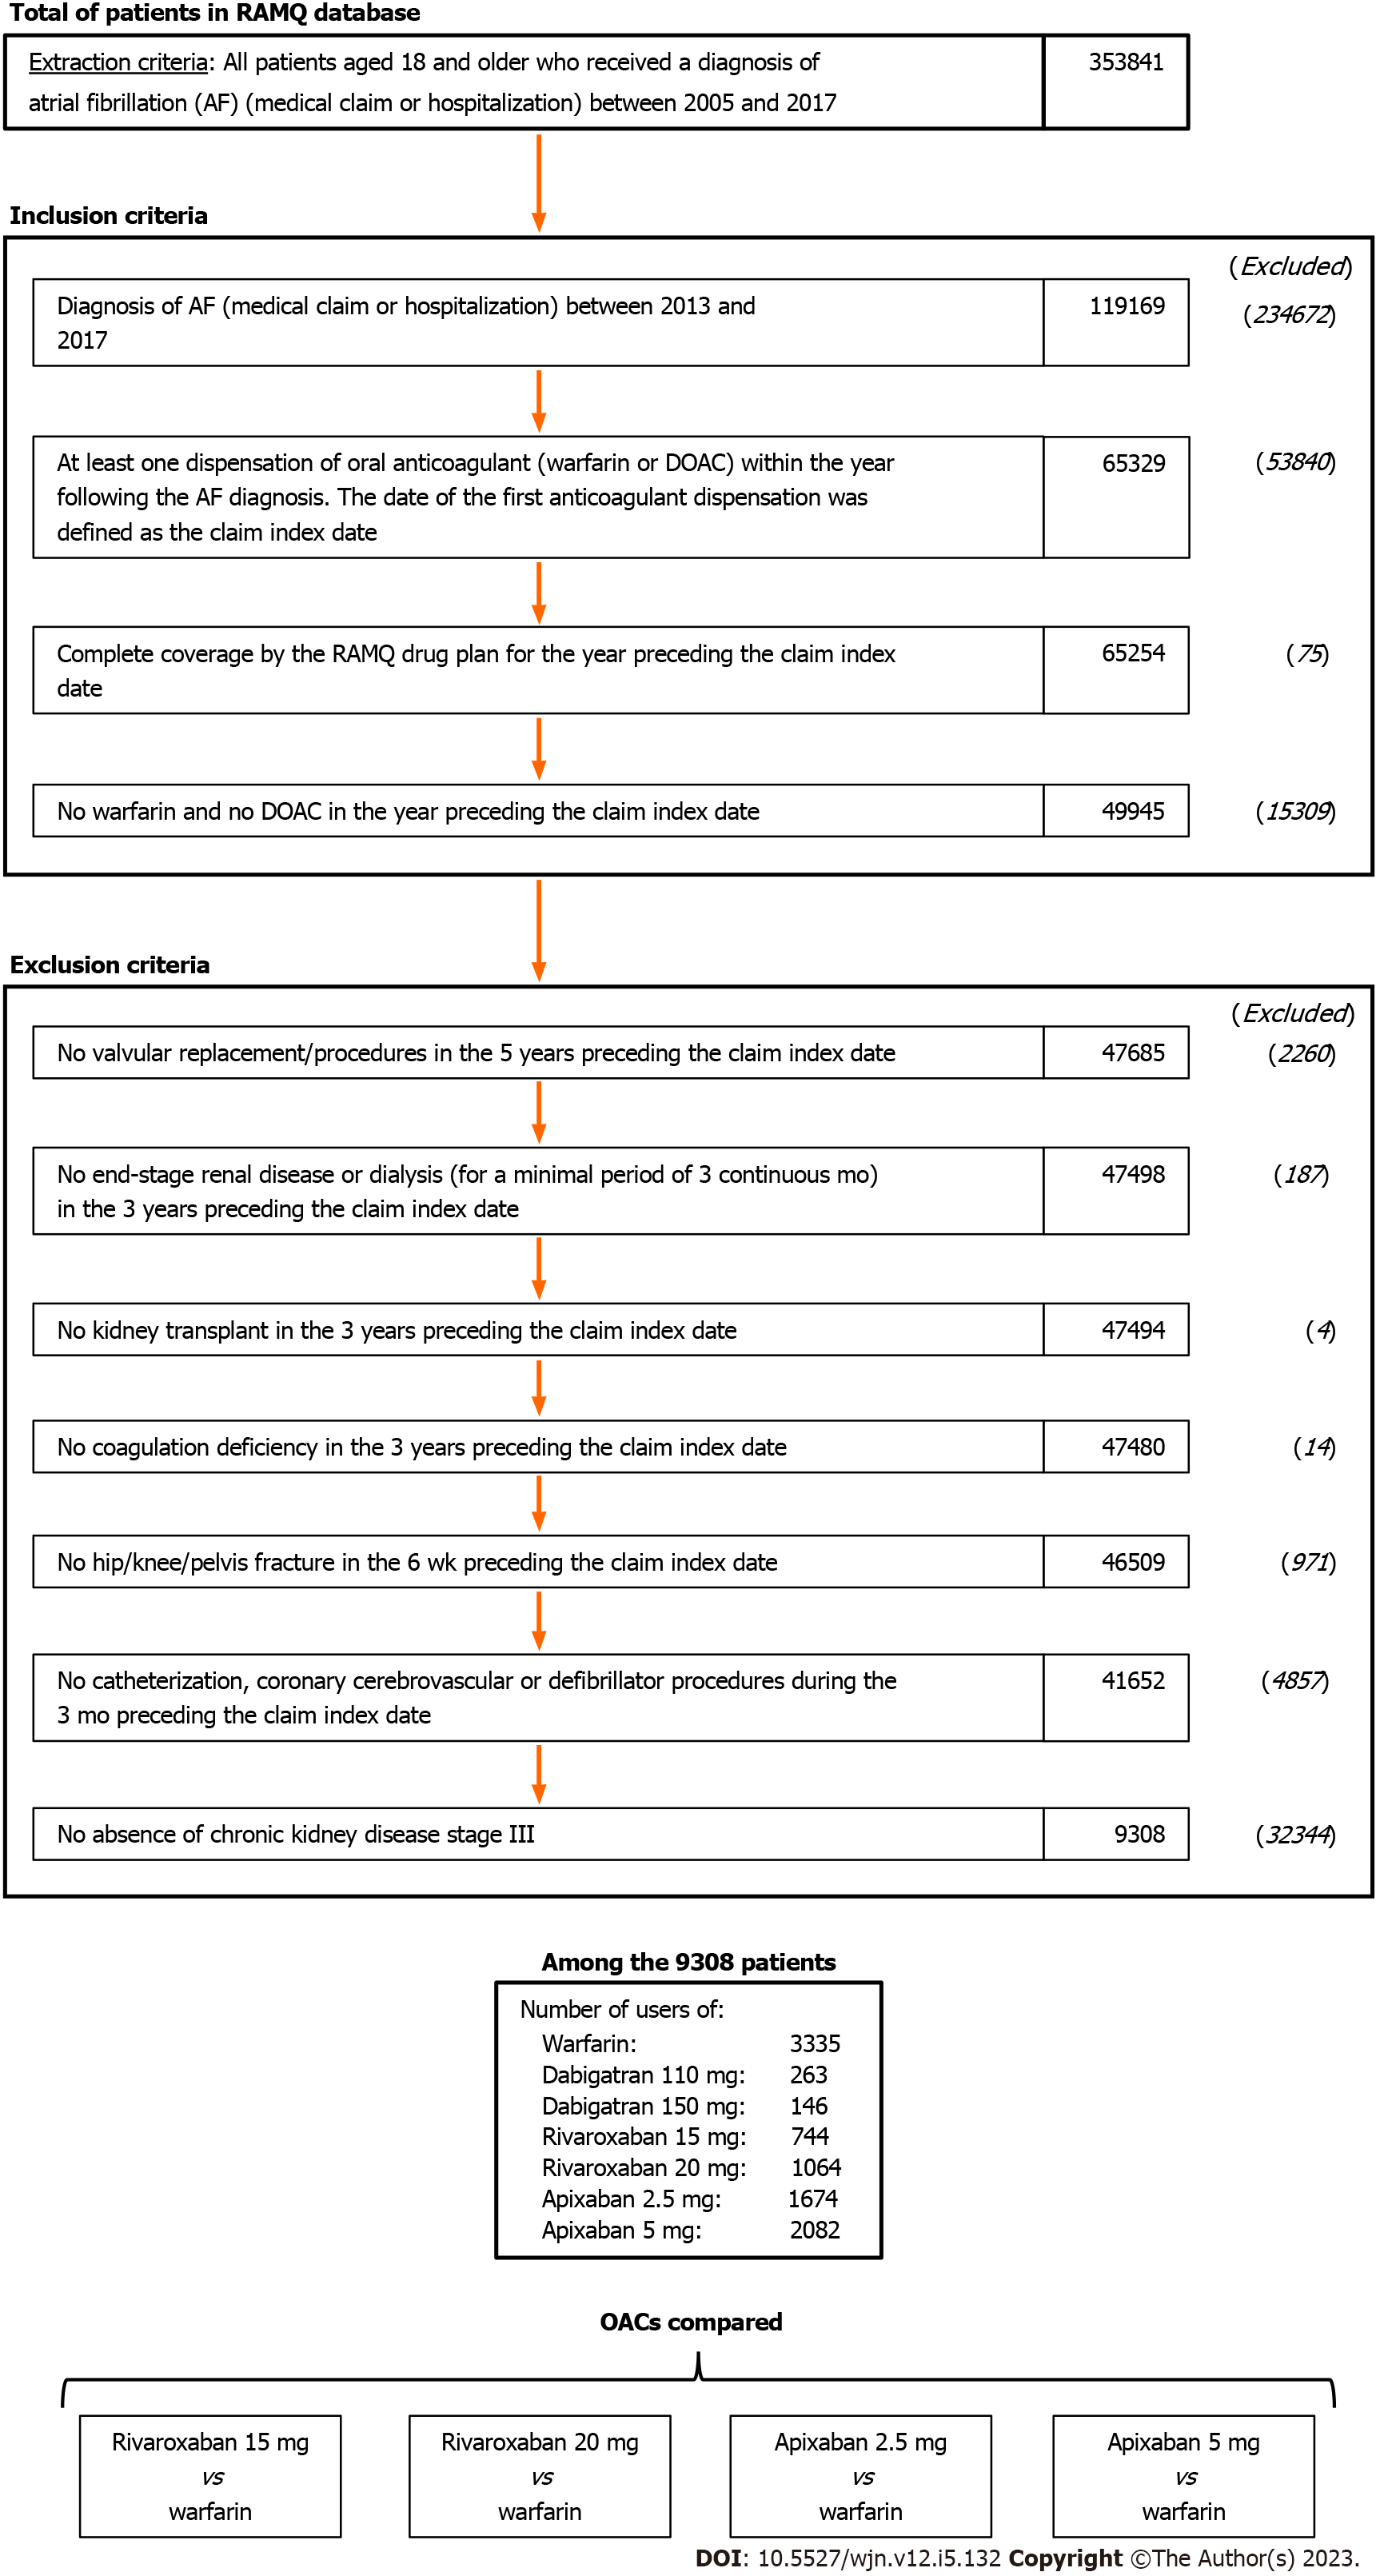
Figure 1 Study flow chart.
No patients in the cohort received edoxaban, and patients using dabigatran were excluded for the low sample size between 2011-2017. DOAC: Direct oral anticoagulant; RAMQ: Régie d’Assurance Maladie du Québec.
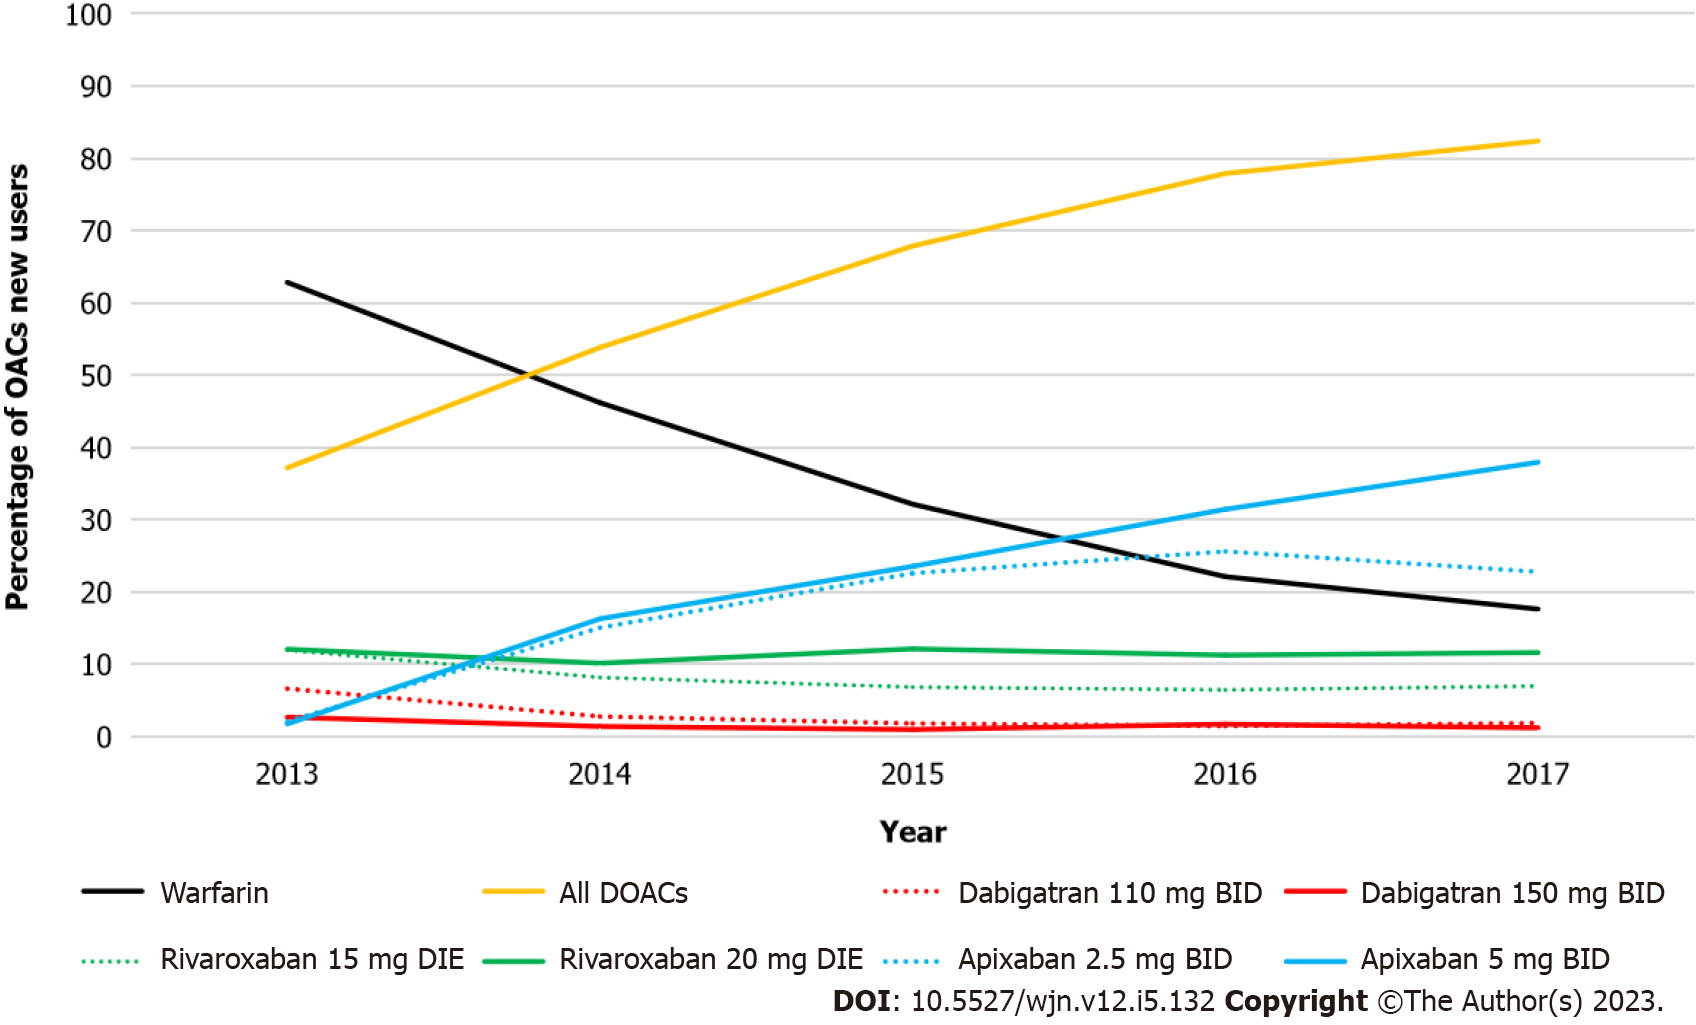
Figure 2 Changes in oral anticoagulant prescriptions from 2010 to 2017.
DOACs: Direct oral anticoagulants; OAC: Oral anticoagulant.
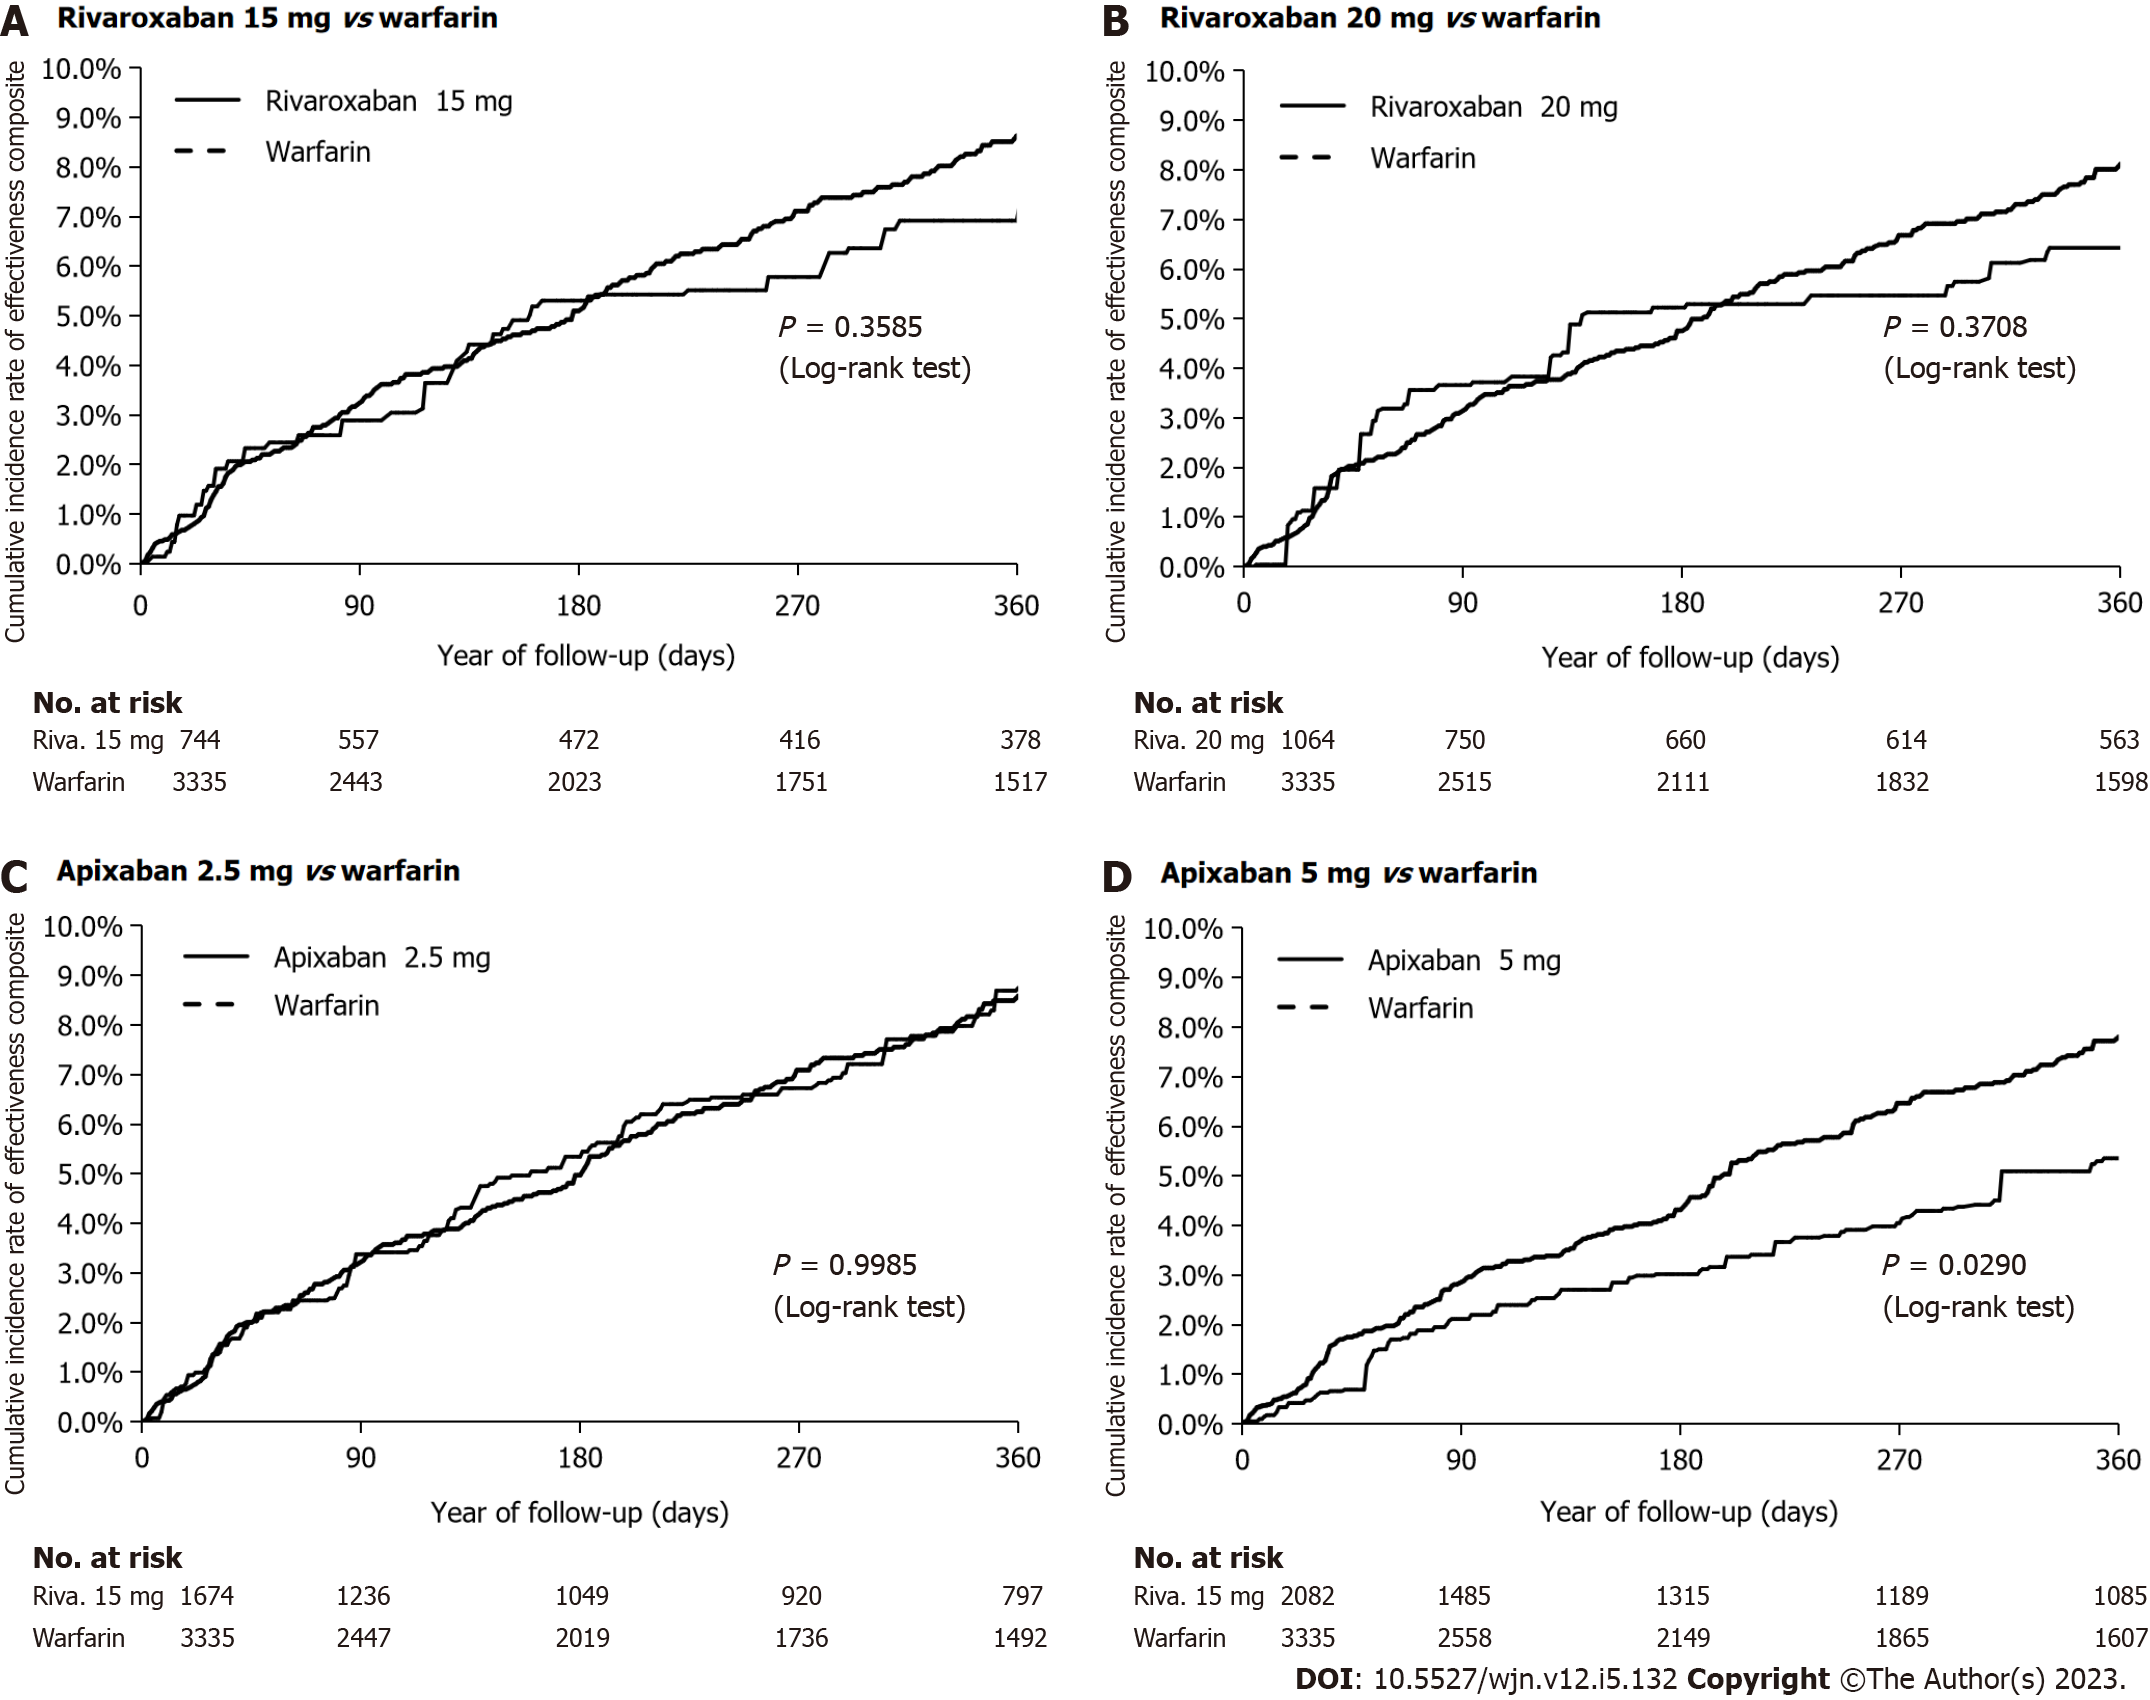
Figure 3 Cumulative rate of the primary effectiveness outcome after inverse probability of treatment weighting in an on-treatment analysis.
A: Rivaroxaban 15 mg vs warfarin; B: Rivaroxaban 20 mg vs warfarin; C: Apixaban 2.5 mg vs warfarin; D: Apixaban 5 mg vs warfarin.
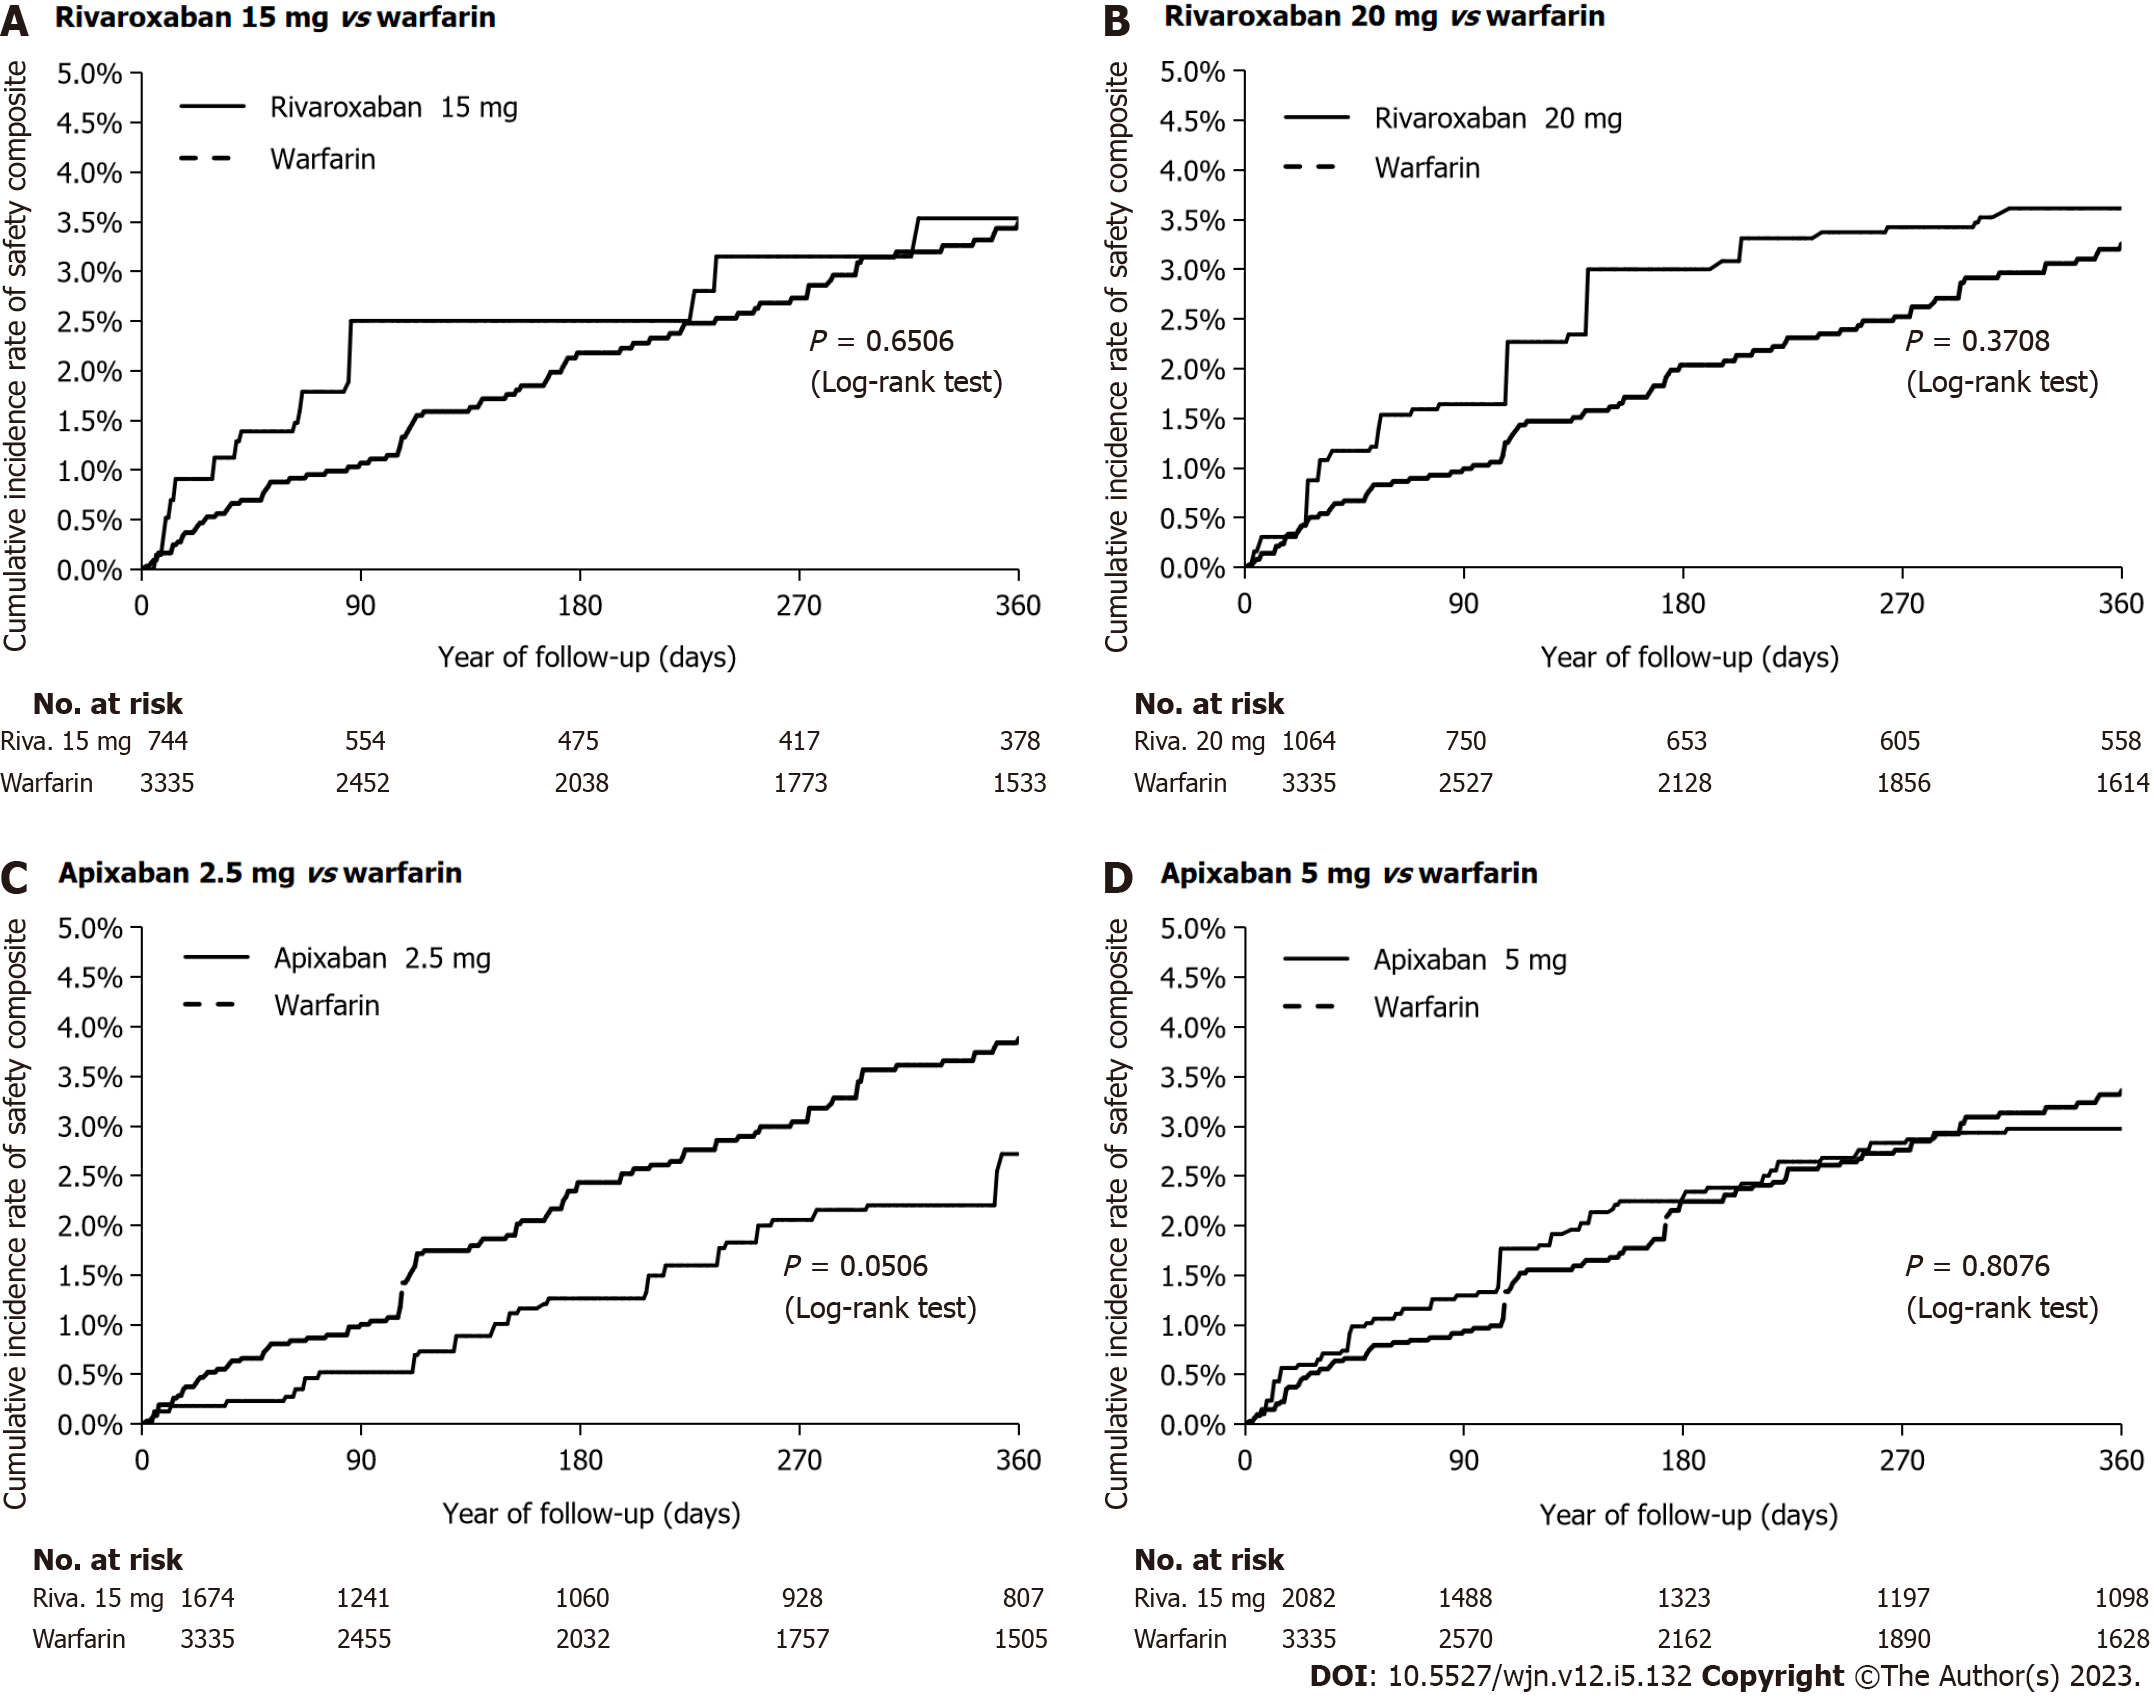
Figure 4 Cumulative rate of the primary safety outcome after inverse probability of treatment weighting in an on-treatment analysis.
A: Rivaroxaban 15 mg vs warfarin; B: Rivaroxaban 20 mg vs warfarin; C: Apixaban 2.5 mg vs warfarin; D: Apixaban 5 mg vs warfarin.
Figure 5 Hazard ratios (95% confidence interval) of effectiveness and safety outcomes in an on-treatment after inverse probability of treatment weighting of new oral anticoagulant users with stage III chronic kidney disease.
SE: Systemic embolism.
Figure 6 Hazard ratios (95% confidence interval) of effectiveness and safety outcomes in an intent-to-treat after inverse probability of treatment weighting of new oral anticoagulant users with stage III chronic kidney disease.
SE: Systemic embolism.
- Citation: Perreault S, Boivin Proulx LA, Lenglet A, Massy ZA, Dorais M. Effectiveness and safety of apixaban and rivaroxaban vs warfarin in patients with atrial fibrillation and chronic kidney disease. World J Nephrol 2023; 12(5): 132-146
- URL: https://www.wjgnet.com/2220-6124/full/v12/i5/132.htm
- DOI: https://dx.doi.org/10.5527/wjn.v12.i5.132


