Copyright
©The Author(s) 2017.
Math 7 Math(A1).
Math 8 Math(A1).
Math 9 Math(A1).
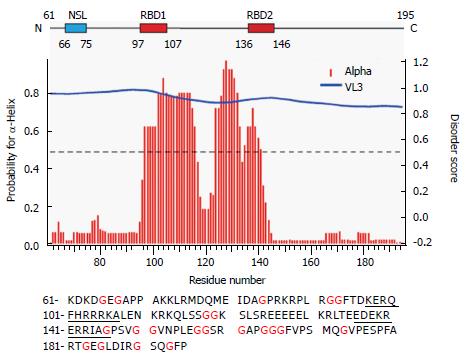
Figure 1 Primary and secondary structure features of Δ60HDAg.
Upper panel displays a schematic representation of Δ60HDAg. NLS is the nuclear localization signal from amino acids 66 to 75 (Alves et al, 2008); RBD corresponds to the RNA binding domain comprised within amino acids 97 and 146 (Lazinski and Taylor, 1993). Middle panel shows the secondary structure prediction and disorder prediction using the meta-predictor PONDR-Fit (http://www.disprot.org/predictors.php), and one of its component programs (VL3) as indicated. The blue line corresponds to the estimated disorder score and red bars indicate the probability of acquisition of α-helix conformation. Bottom panel is the amino acid sequence of Δ60HDAg. The underlined amino acid residues correspond to the RBD. Isoelectric point of Δ60HDAg’s is 9.8 and molecular weight is 14.8 kDa, estimated by using Expasy (http://www.expasy.org).
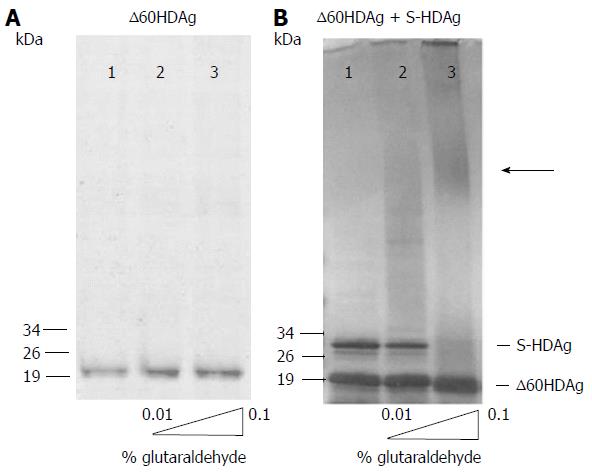
Figure 2 S-HDAg and ∆60HDAg multimerization ability.
In panels A and B, purified recombinant protein was cross-linked with increasing concentrations of glutaraldehyde (0%, 0.01% and 0.1%) prior to SDS-PAGE. Proteins were detected by Coomassie blue staining. In panel A, only purified ∆60HDAg was present at 2 μmol/L and in panel B both S-HDAg and ∆60HDAg were present at 2 μmol/L each. The arrow indicates the presence high molecular weight oligomers.
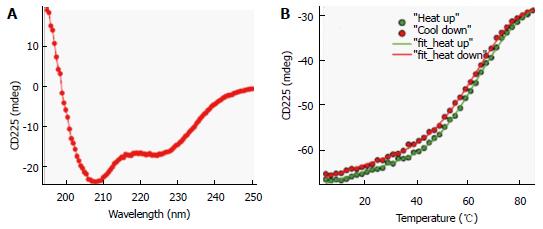
Figure 3 Circular dichroism spectrum and protein thermal stability measurement of ∆60HDAg.
A: Far-UV CD spectrum of approximately 10 μmol/L protein in 20 mmol/L potassium phosphate buffer, pH 6.3 at 25 °C. A quartz cuvette with 1 mm pathlength was used. The spectrum is an average of five scans recorded in the far-UV region (195-250 nm) with a band pass of 2 nm; B: Temperature dependence of ∆60HDAg at approximately 15 μmol/L. Change in ellipticity at 225 nm upon increasing the temperature from 5 °C to 85 °C in 2 °C intervals was recorded. Two nanometer band width and a 2 mm quartz cuvette were used. Data average and temperature equilibrate times were 1 s and 12 s, respectively. Solid lines are the nonlinear least squares fitting the experiment data (solid circles) to the Gibbs-Helmholtz equation (see Materials and Methods). CD: Circular dichroism.
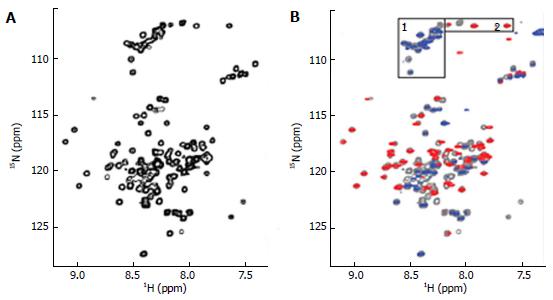
Figure 4 Nuclear magnetic resonance spectra of 15N labeled ∆60HDAg.
A: 1H-15N HSQC of ∆60HDAg recorded on a Bruker 600 MHz Avance II NMR instrument at 25 °C with the standard Bruker pulse sequence: hsqcetfpf3gpsi. Four thousand and ninety-eight data points in 1H dimension and 256 increments in 15N dimension were acquired; B: 1H and 15N heteronuclear NOE spectrum of ∆60HDAg, superimposed on the normal 1H-15N HSQC spectrum (gray contours). Heteronuclear NOE spectrum was recorded with the Bruker pulse sequence: Hsqcnoef3gpsi. Positives and negatives are displayed in red and blue contours, respectively. Peaks from glycines (boxed and labeled as 1 and 2 in the top of the spectra) are grouped.
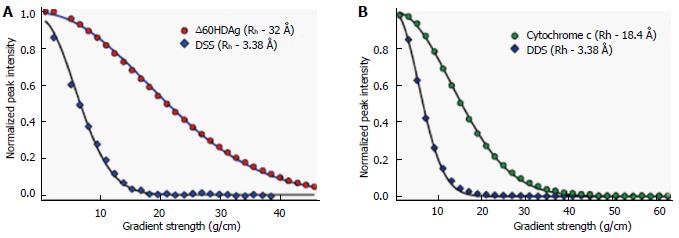
Figure 5 Nuclear magnetic resonance pulsed-field gradient diffusion measurements.
A: NMR PFG diffusion measurements of ∆60HDAg, performed on a Bruker 600 MHz Avance II. DSS (4,4-dimethyl-4-silapentane-1-sulfonic acid) was used as a reference. 1H pulse gradient stimulated echo longitudinal encode-decode (PG-SLED) experiment with saturation of the water signal during the relaxation delay was used with a Bruker pulse sequence: Ledbpgppr2s, at 25 °C. A 14-ppm 1H spectral width was used. Gradient strength varied linearly from 0.963-45.7 g/cm. Solid line represents the result of fitting the experimental data to the diffusion equation (see methods); B: NMR PFG diffusion measurements of cytochrome c, previously measured on a Bruker DMX 600 MHz at 25 °C. NMR: Nuclear magnetic resonance; PFG: Pulsed-field gradient.
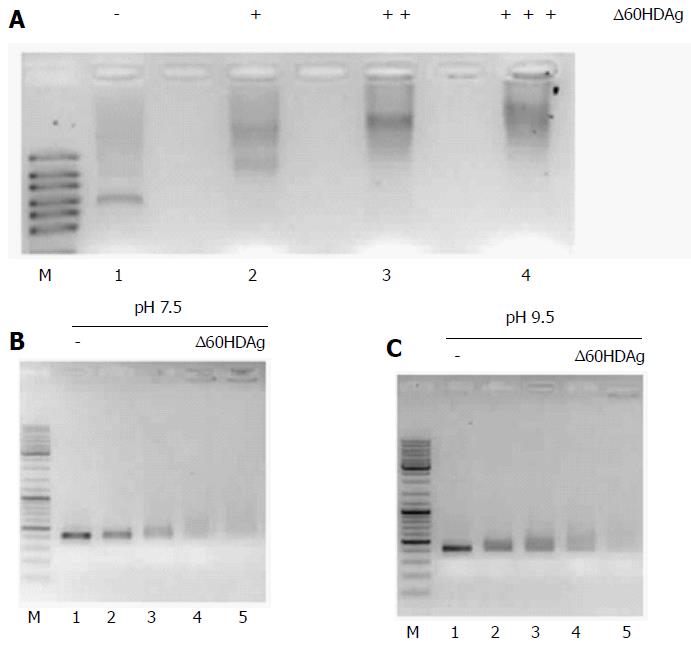
Figure 6 Gel retardation assay.
A: Binding of ∆60HDAg to HDV RNA. Purified recombinant ∆60HDAg was incubated, in standard pH 7.5 binding buffer, with 100 ng of HDV RNA at increasing concentrations (0, 0.5, 1.5, and 3 μmol/L, respectively). Left in each panel is a RNA marker (RiboRuler High Range RNA Ladder, Fermentas); B and C: ∆60HDAg binding to DNA and HDV RNA, respectively. In panel B, 100 ng of dsDNA were incubated in standard pH 7.5 binding buffer, with increasing concentrations of purified recombinant ∆60HDAg (0, 2, 4, 6, 8, 10, and 12 μmol/L). Panel C shows the assay in binding buffer at pH 9.5. Recombinant ∆60HDAg was incubated with 100 ng of dsDNA, at different concentrations (0, 2, 4, 6, 8, 10, and 12 μmol/L). In panel C, 100 ng of HDV RNA was incubated, in standard pH 9.5 binding buffer, with increasing concentrations of purified recombinant ∆60HDAg (0, 0.5, 1, 1.5, and 2 μmol/L). HDV: Hepatitis delta virus.
- Citation: Alves C, Cheng H, Tavanez JP, Casaca A, Gudima S, Roder H, Cunha C. Structural and nucleic acid binding properties of hepatitis delta virus small antigen. World J Virol 2017; 6(2): 26-35
- URL: https://www.wjgnet.com/2220-3249/full/v6/i2/26.htm
- DOI: https://dx.doi.org/10.5501/wjv.v6.i2.26


