Copyright
©The Author(s) 2017.
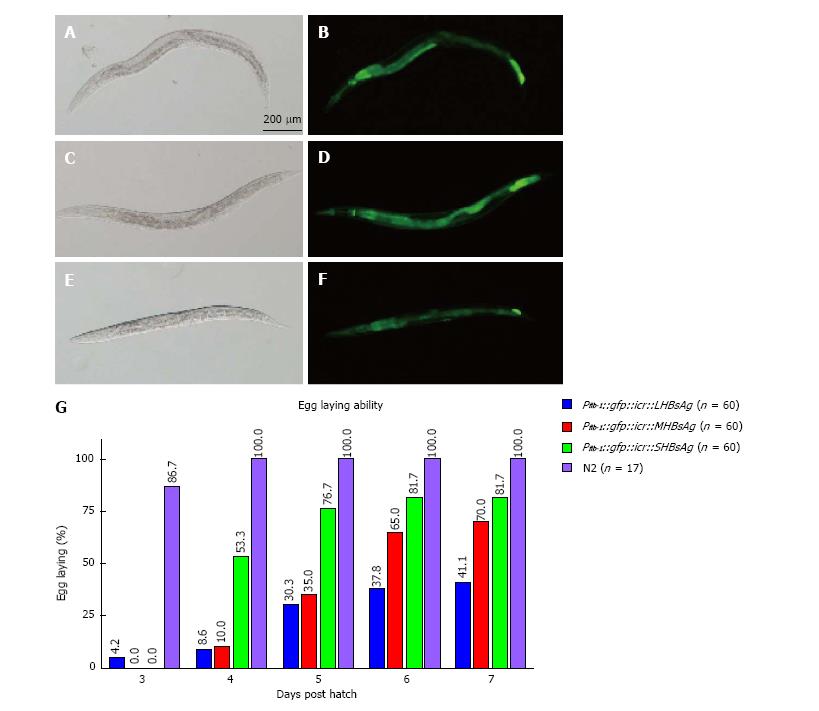
Figure 1 Expression of various lengths of hepatitis B virus antigens in whole worms induced defects in the rate of egg-laying.
A-F: Micrographs of transgenic worms expressing LHBsAg (A and B), MHBsAg (C and D), and SHBsAg (E and F) were captured under a bright-field microscope (A, C, and E) and a fluorescence microscope (B, D, and F). The heads of the worms are shown toward the left. The scale bar indicates 200 μm. G: Egg-laying capability of three lines of transgenic worms and wild-type worms (N2) shown using various color bars. The rate of egg-laying in 3 to 7 d post-hatching is shown above the bar. HBsAgs: Hepatitis B virus antigens.
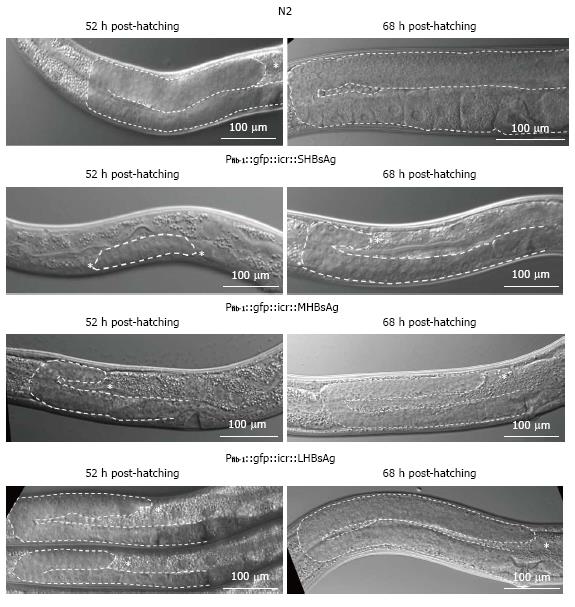
Figure 2 Differential interference contrast micrographs of gonad development in transgenic worms at various post-hatching times.
The upper row shows a wild-type worm (N2); the second row shows a transgenic worm expressing SHBsAg; the third row shows a transgenic worm expressing MHBsAg; and the bottom row shows a transgenic worm expressing LHBsAg. The right column shows the gonads at 52 h post-hatching and the left column at shows gonads at 68 h post-hatching expect the worm expressing SHBsAg is at 72 h post-hatching. The gonad contour is indicated with dotted lines and the tip (distal end) is marked by asterisk.
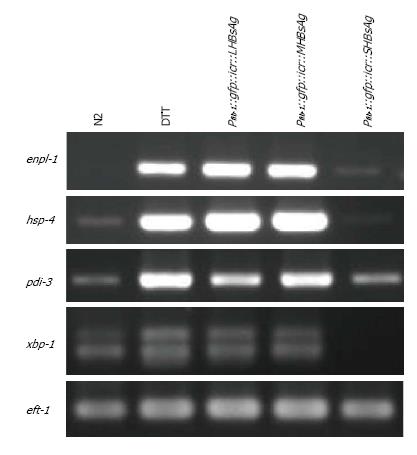
Figure 3 Reverse transcription polymerase reaction analyses of mRNA levels in various transgenic worms.
The four transcripts (enpl-1, hsp-4, pdi-3, and xbp-1), ER-stress markers, from wild-type worms (N2) with or without DTT pretreatment, an ER stress inducer, and three lines of transgenic worms were analyzed using RT-PCR and gel-electrophoresis. The transcript of the translation factor (eft-2) served as a loading control. N2 worms treated with and without DTT and transgenic worms are indicated above the gel. DTT-treated worms severed as positive controls of ER-stress responses. DTT: Dithiothreitol; RT-PCR: Reverse transcription polymerase reaction.
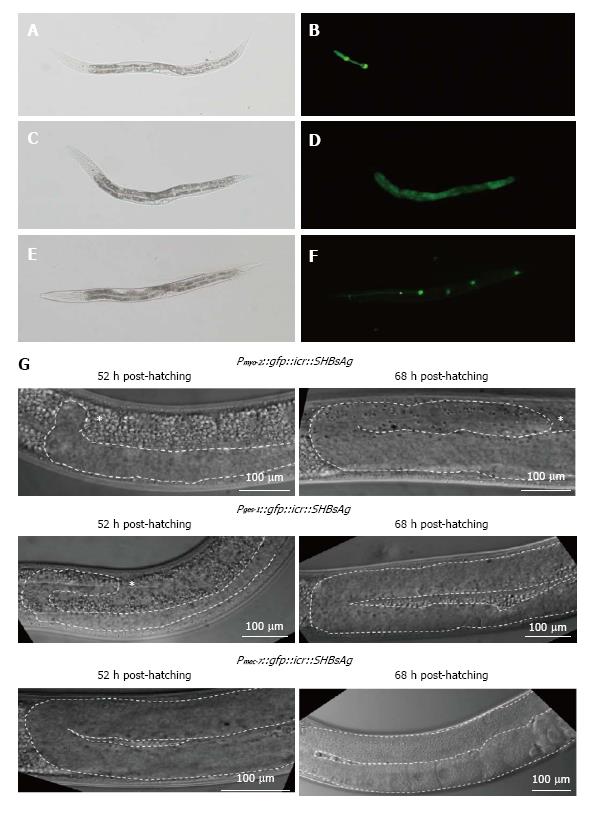
Figure 4 Features of transgenic worms expressing SHBsAgs in different tissues.
A-F: Micrographs of transgenic worms expressing SHBsAgs in the pharynx (A, and B), intestinal cells (C and D), and neurons (E and F) were captured under a bright-field microscope (A, C, and E) and a fluorescence microscope (B, D, and F). The heads of the worms are shown toward the left. The scale bar indicates 200 μm; G: Gonad development in transgenic worms: The upper row is a transgenic worm expressing SHBsAg in the pharynx; the middle row is a transgenic worm expressing SHBsAg in intestinal cells; and the lower row is a transgenic worm expressing SHBsAg in neurons. Images were captured under a DIC microscope. The right column shows the gonads at 52 h post-hatching and the left column at 68 h post-hatching. The gonad contour is outlined by dotted lines and the tip (distal end) is marked by asterisk. HBsAgs: Hepatitis B virus antigens.
- Citation: Chen YY, Lee LW, Hong WN, Lo SJ. Expression of hepatitis B virus surface antigens induces defective gonad phenotypes in Caenorhabditis elegans. World J Virol 2017; 6(1): 17-25
- URL: https://www.wjgnet.com/2220-3249/full/v6/i1/17.htm
- DOI: https://dx.doi.org/10.5501/wjv.v6.i1.17


