Copyright
©The Author(s) 2015.
World J Virology. Nov 12, 2015; 4(4): 356-364
Published online Nov 12, 2015. doi: 10.5501/wjv.v4.i4.356
Published online Nov 12, 2015. doi: 10.5501/wjv.v4.i4.356
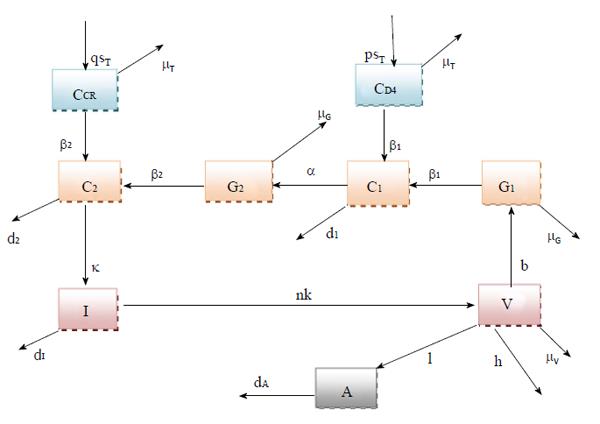
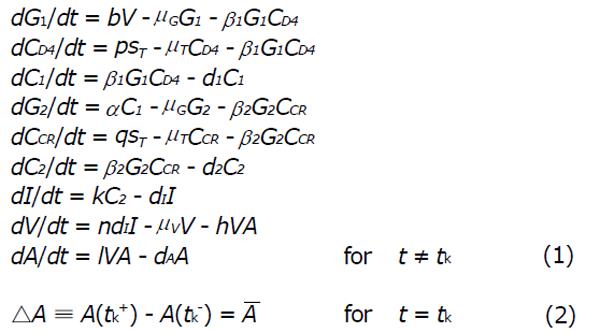
Figure 1 Schematic explanation for the model (1) showing the effect of high drug levels.
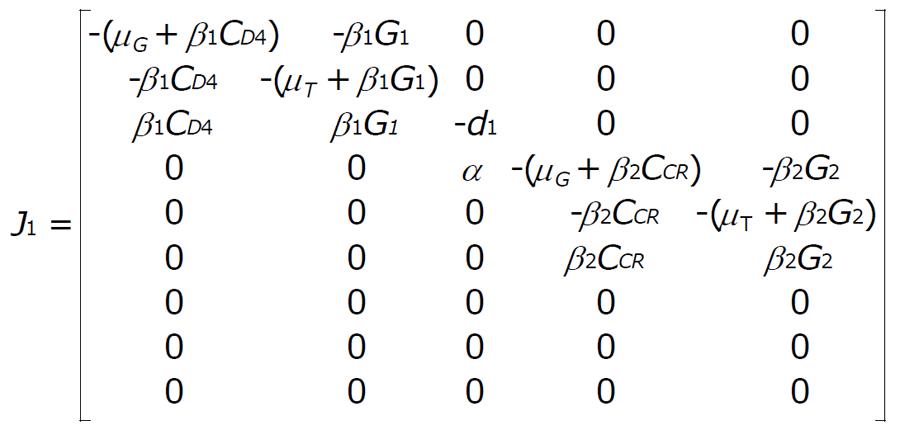
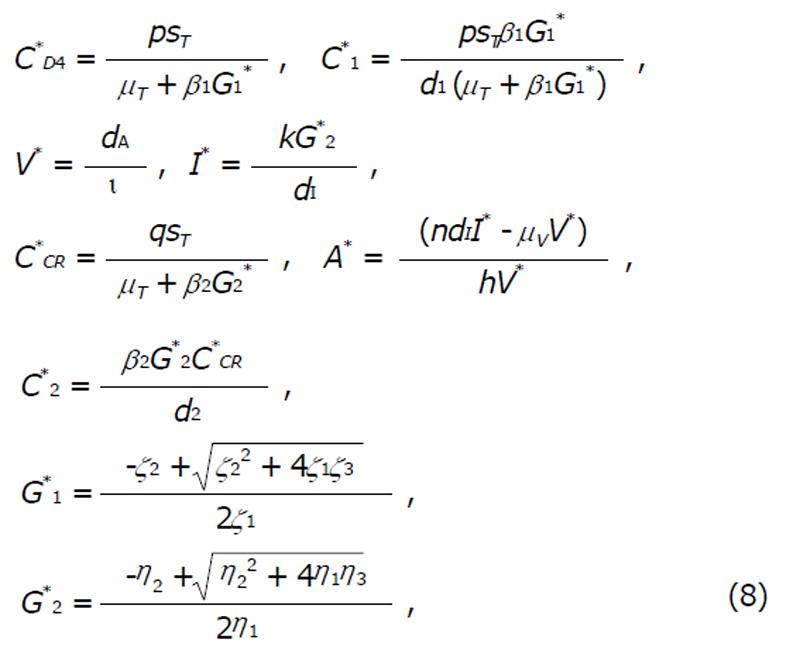
Math 1 Math(A1).
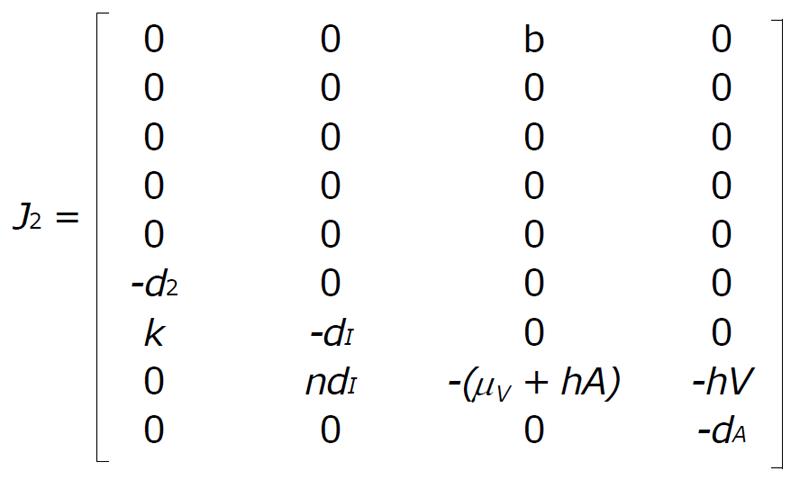
Math 2 Math(A1).
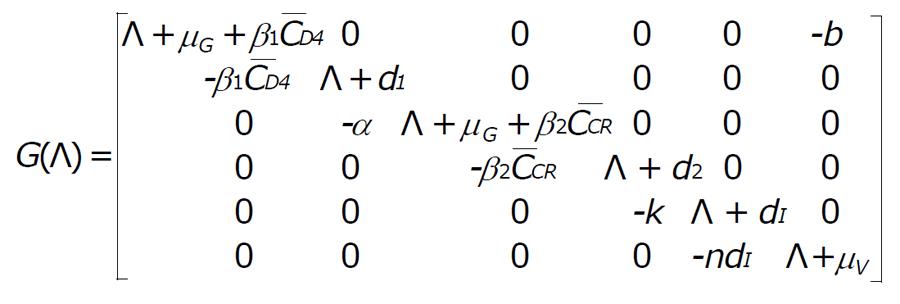
Math 3 Math(A1).
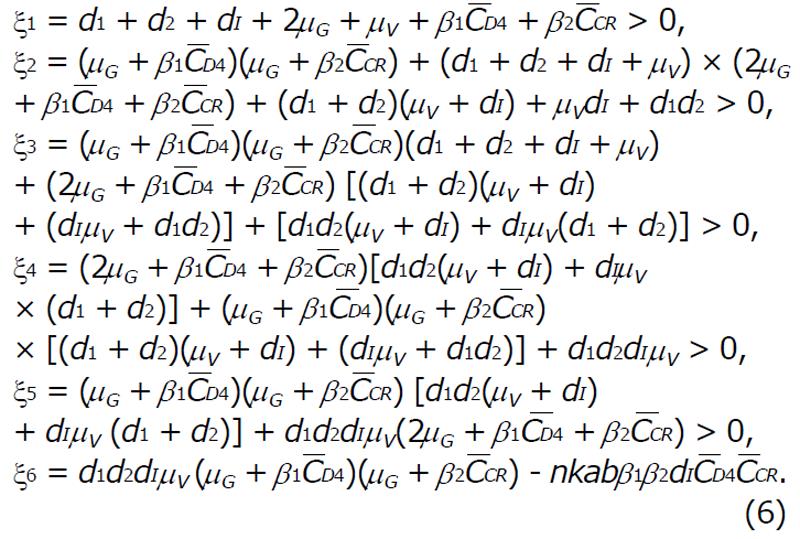
Math 4 Math(A1).
Math 5 Math(A1).
Math 6 Math(A1).
Math 7 Math(A1).
Math 8 Math(A1).
Math 9 Math(A1).
Math 10 Math(A1).
Math 11 Math(A1).
Math 12 Math(A1).
Math 13 Math(A1).
Math 14 Math(A1).
Math 15 Math(A1).
Math 16 Math(A1).
Math 17 Math(A1).
Math 18 Math(A1).
Math 19 Math(A1).
Math 20 Math(A1).
Math 21 Math(A1).
Math 22 Math(A1).
Math 23 Math(A1).
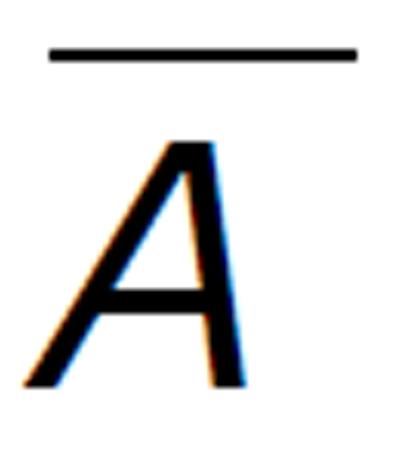
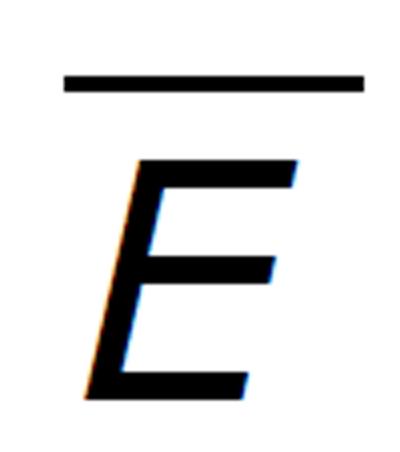
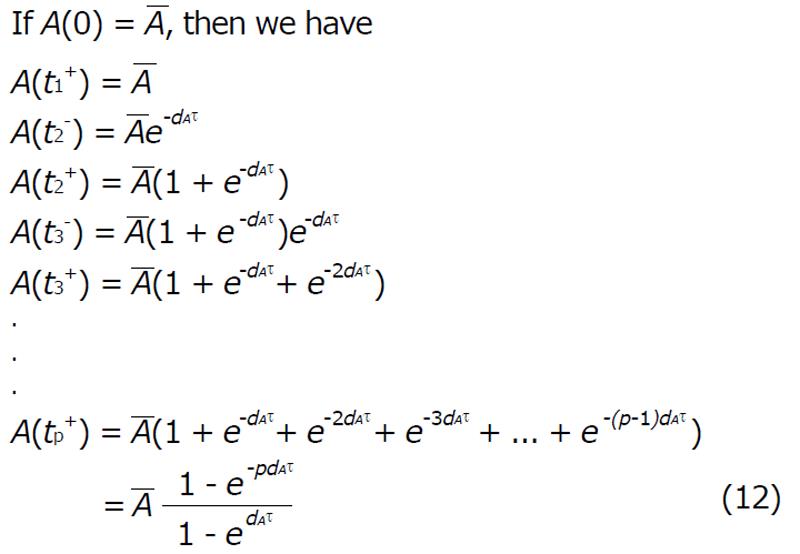
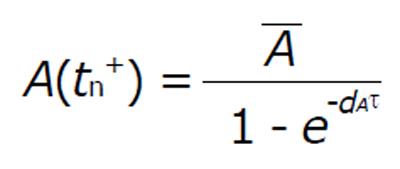
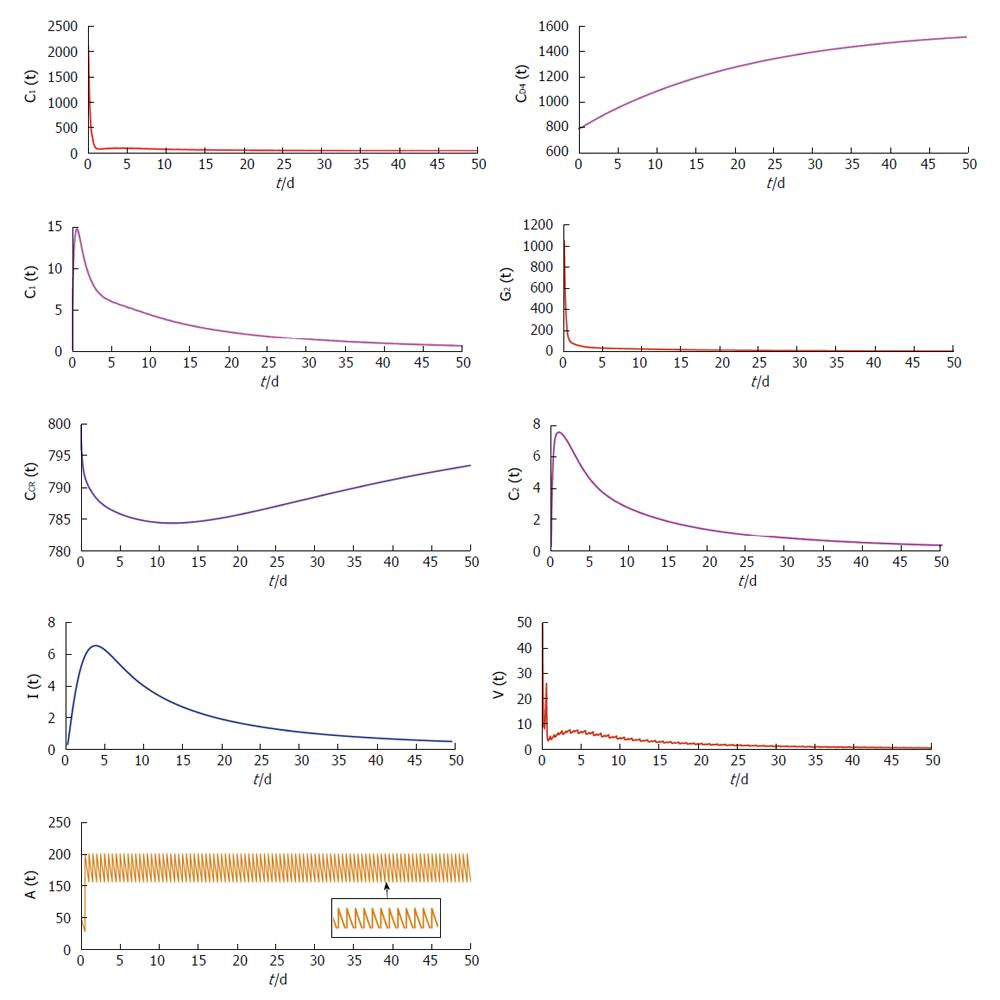
Figure 2 Trajectories showing the concentration changes with time of the model variable under restrained antibody vaccination with A bar = 0.
5 and A = 100.
Math 24 Math(A1).
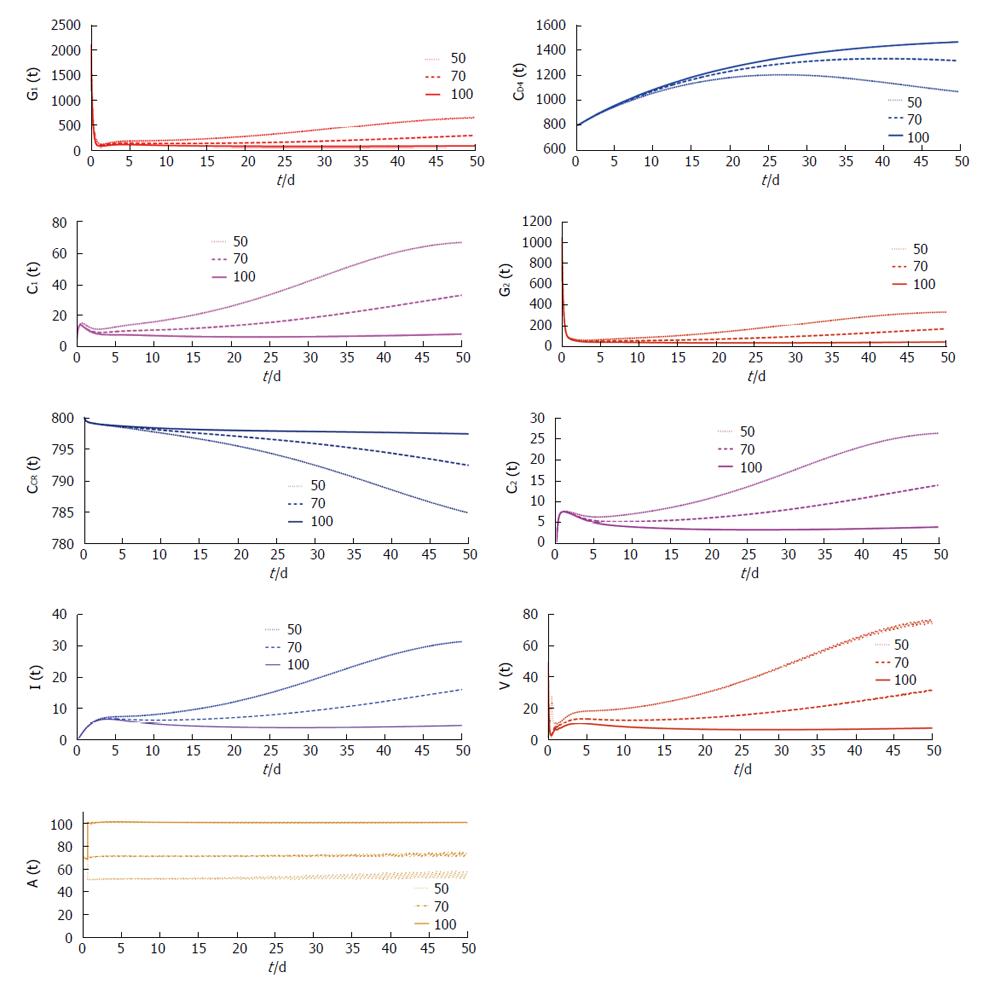
Figure 3 Trajectories showing the concentration changes with time of the model variable under different antibody vaccination concentration with τ = 0.
5.
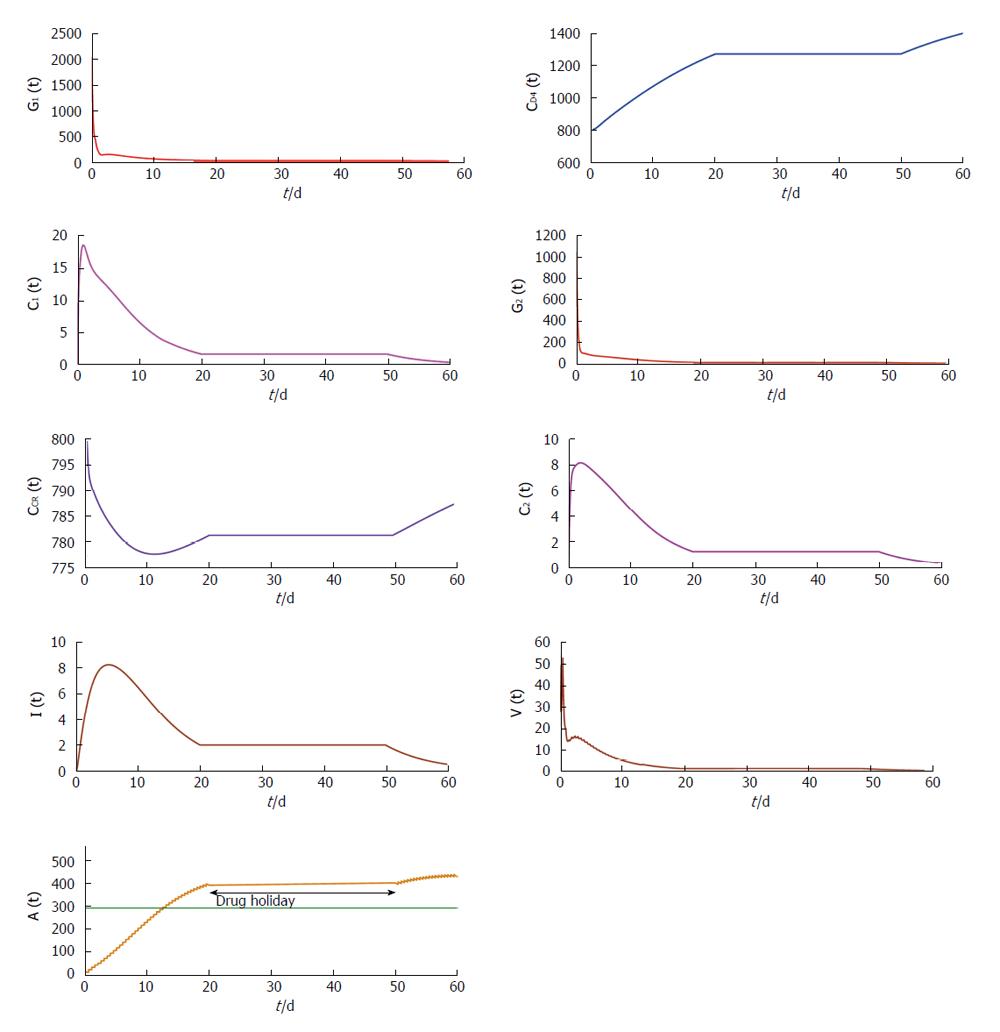
Figure 4 Trajectories showing the concentration changes with time of the model variable under restrained antibody vaccination with τ = 0.
5 along with drug holidays for a period of 30 d.
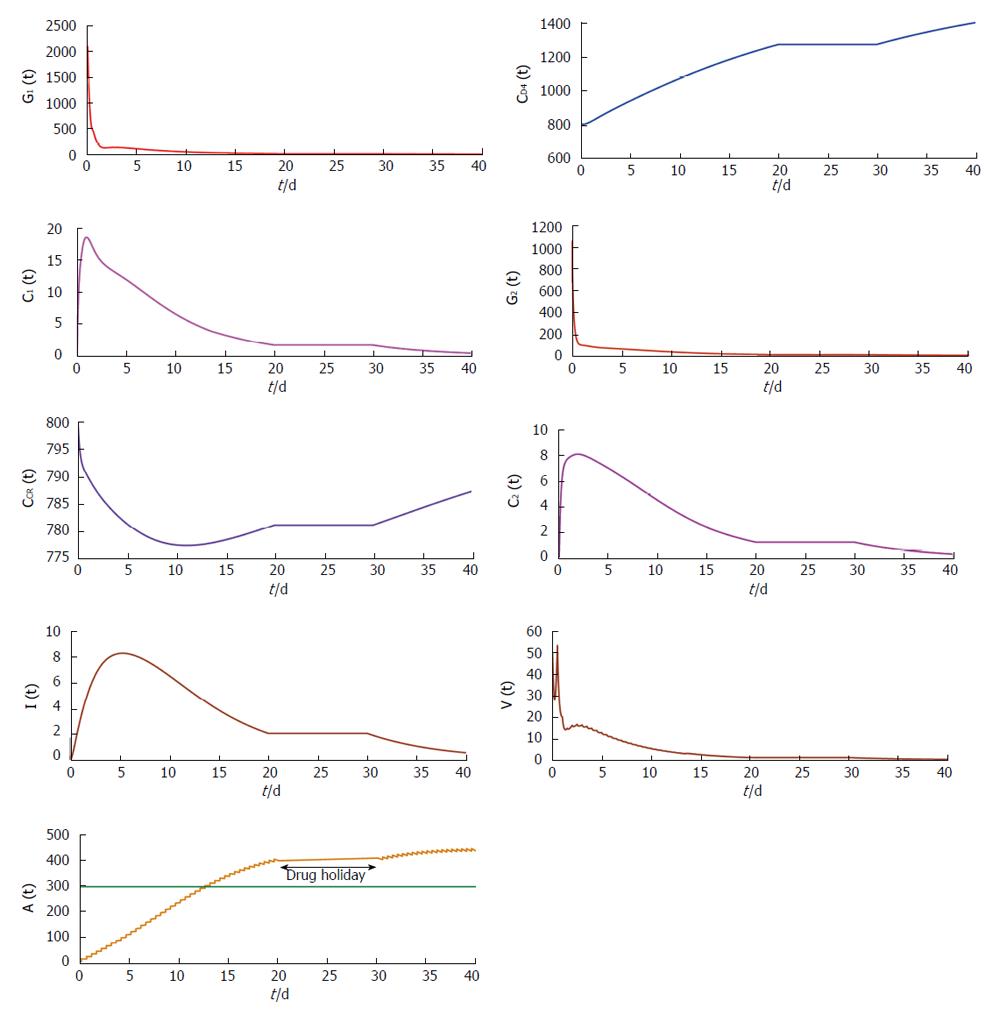
Figure 5 Trajectories showing the concentration changes with time of the model variable under restrained antibody vaccination with τ = 0.
5 along with drug holidays for a period of 10 d.
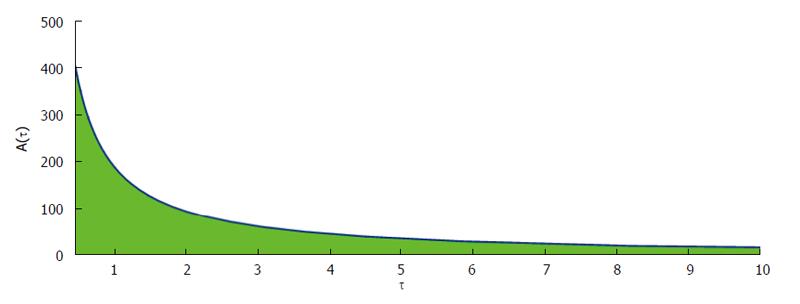
Figure 6 Phase plane showing the concentration of antibody responses against fixed dosing interval.
- Citation: Chatterjee AN, Saha S, Roy PK. Human immunodeficiency virus/acquired immune deficiency syndrome: Using drug from mathematical perceptive. World J Virology 2015; 4(4): 356-364
- URL: https://www.wjgnet.com/2220-3249/full/v4/i4/356.htm
- DOI: https://dx.doi.org/10.5501/wjv.v4.i4.356


