Copyright
©2013 Baishideng Publishing Group Co.
World J Virol. Aug 12, 2013; 2(3): 123-135
Published online Aug 12, 2013. doi: 10.5501/wjv.v2.i3.123
Published online Aug 12, 2013. doi: 10.5501/wjv.v2.i3.123
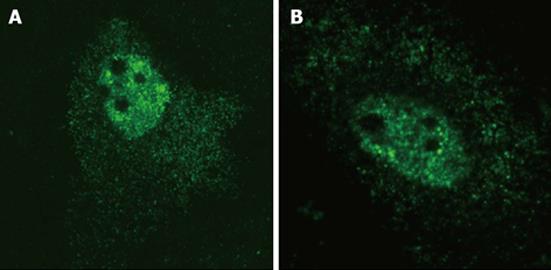
Figure 1 Intracellular localization of hepatitis delta virus gRNA (A) and agRNA (B).
HuH-7 cells were transfected with plasmids pDL542 and pDL481, respectively, and virus RNA was detected by in situ hybridization with a dig-11-dUTP labeled probe. Both gRNA and agRNA can be observed in the nucleus and cytoplasm (green).
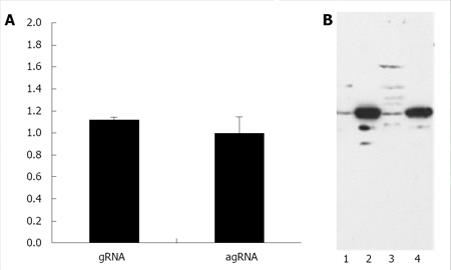
Figure 2 Nucleo-cytoplasmic distribution of hepatitis delta virus gRNA and agRNA.
HuH-7 cells were trasnfected with plasmids pDL542 and pDL481, respectively. A: The relative quantification of HDV RNA was performed by real time-polymerase chain reaction using the 2-∆∆Ct method. Results are presented as the cytoplasmic /nuclear ratio (C/N) and correspond to the mean of three independent experiments. Bars indicate the standard deviation; B: Western blotting analysis of nuclear and cytoplasmic HuH-7 cell protein fractions. Equivalent amounts of nuclear (lanes 1 and 3) and cytoplasmic (lanes 2 and 4) protein fractions used for quantification of gRNA (lanes 1 and 2) and agRNA (lanes 3 and 4) were separated in 12% SDS-PAGE gels. The possible contamination of nuclear fractions was monitored by using an anti-GAPDH antibody.
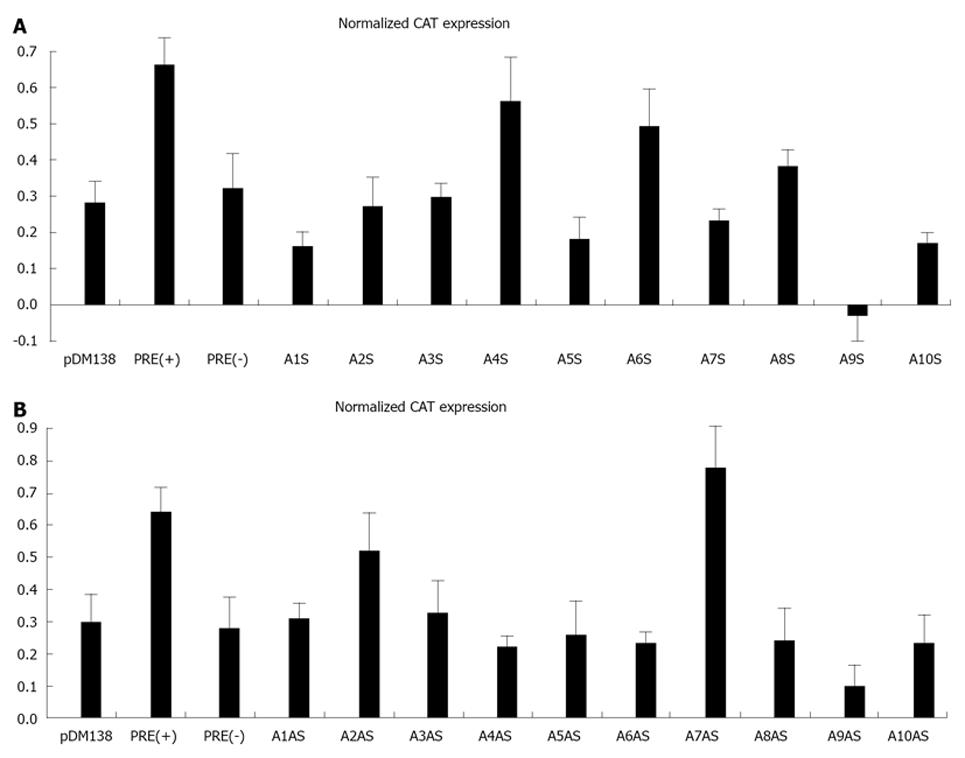
Figure 3 Analysis of chloranphenicol acetyl-transferase expression in HuH-7 cells transfected with plasmids pDM138, pDM138 (PRE+), pDM138 (PRE-), pDM138 A1S-pDM138 A10S (A), and pDM138 A1AS-pDM138 A10AS (B).
In order to normalize for transfection efficiency, cells were co-transfected with plasmid pSV-β-Gal (Promega). Chloranphenicol acetyl-transferase (CAT) and β-Gal expression levels were determined by ELISA. Normalization of CAT expression levels was calculated by dividing the values obtained for the CAT protein by the values obtained for the β-Gal protein. The results correspond to the mean of three independent experiments. Bars represent the standard deviation.
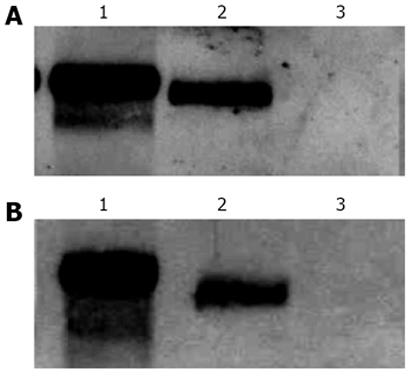
Figure 4 Northern blotting analysis of reporter chloranphenicol acetyl-transferase mRNA in total (A) and cytoplasmic (B) fractions of HuH-7 cells transfected with plasmids pDM138 (PRE+), pDM138 A7AS, and pDM138 A9AS (lanes 1, 2 and 3 respectively).
Hybridization was performed using a dig-11-dUTP labeled probe. A peroxidase conjugated anti-digoxigenin antibody was used to detect the hybridized probe.
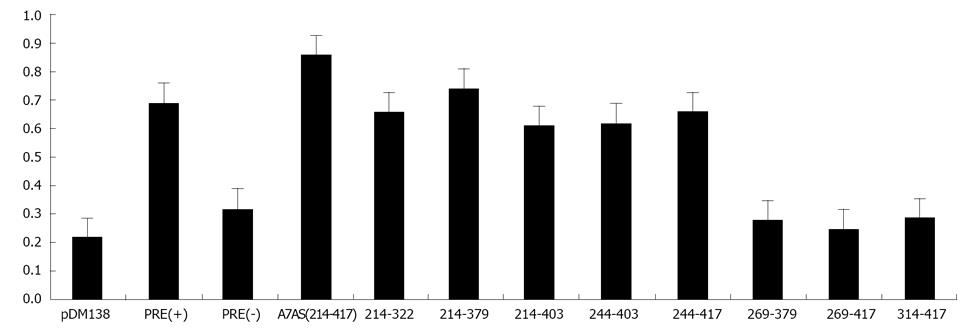
Figure 5 Analysis of chloranphenicol acetyl-transferase expression in HuH-7 cells transfected with plasmids pDM138, pDM138 (PRE+), pDM138 (PRE-), pDM138 A7AS (214-417), pDM138-314-417, pDM138-214-322, pDM138-269-379, pDM138-244-379, pDM138-269-417, pDM138-214-403, pDM138-244-403, and pDM138-244-417.
Chloranphenicol acetyl-transferase (CAT) and β-Gal expression levels were determined by enzyme-linked immunosorbent assay. The CAT expression values were normalized for transfection efficiency by transfecting HuH-7 cells with plasmid pSV-β-Gal (Promega) followed by determination of β-Gal expression. CAT expression values were divided by the corresponding β-Gal expression values, and the displayed results correspond to the mean of three independent experiments.
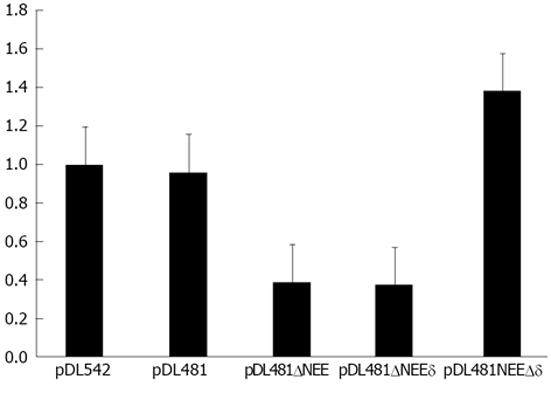
Figure 6 Nucleo-cytoplasmic distribution of hepatitis delta virus RNA in HuH-7 cells transfected with plasmids pDL481, pDl542, pDL481ΔNEE, pDL481ΔNEEδ, and pDL481Δδ.
The RNA in nuclear and cytoplasmic cell fractions was determined by real time-polymerase chain reaction using the 2-∆∆Ct method. Results are presented as the cytoplasmic /nuclear ratio (C/N) and correspond to the mean of three independent experiments. Bars indicate the standard deviation.
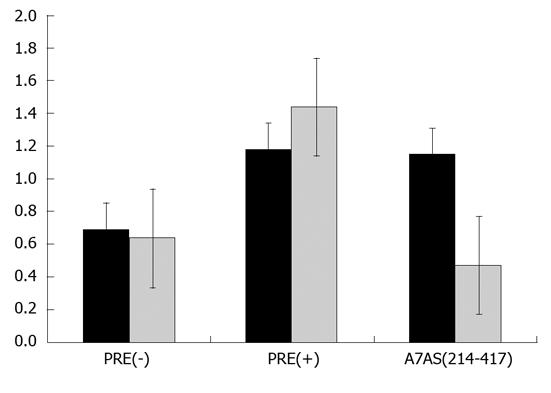
Figure 7 Analysis of chloranphenicol acetyl-transferase expression in HuH-7 cells transfected with plasmids pDM138 (PRE-), pDM138 (PRE+), and pDM138 A7AS, in the absence (black columns) and presence of 10 nmol/L leptomycin B (grey columns).
In order to normalize for transfection efficiency, cells were co-transfected with plasmid pSV-β-Gal (Promega). Chloranphenicol acetyl-transferase (CAT) and β-Gal expression levels were determined by enzyme-linked immunosorbent assay. Normalization of CAT expression levels was calculated by dividing the values obtained for the CAT protein by the values obtained for the β-Gal protein. The results correspond to the mean of three independent experiments. Bars represent the standard deviation.
- Citation: Freitas N, Cunha C. Searching for nuclear export elements in hepatitis D virus RNA. World J Virol 2013; 2(3): 123-135
- URL: https://www.wjgnet.com/2220-3249/full/v2/i3/123.htm
- DOI: https://dx.doi.org/10.5501/wjv.v2.i3.123


