Copyright
©The Author(s) 2024.
World J Virol. Sep 25, 2024; 13(3): 96369
Published online Sep 25, 2024. doi: 10.5501/wjv.v13.i3.96369
Published online Sep 25, 2024. doi: 10.5501/wjv.v13.i3.96369
Figure 1 Normal vs elevated transaminases according to different fibrosis stages.
A: Aspartate transaminase (AST); B: Alanine transaminase (ALT). The dashed line represents the upper limit of normal (ULN).
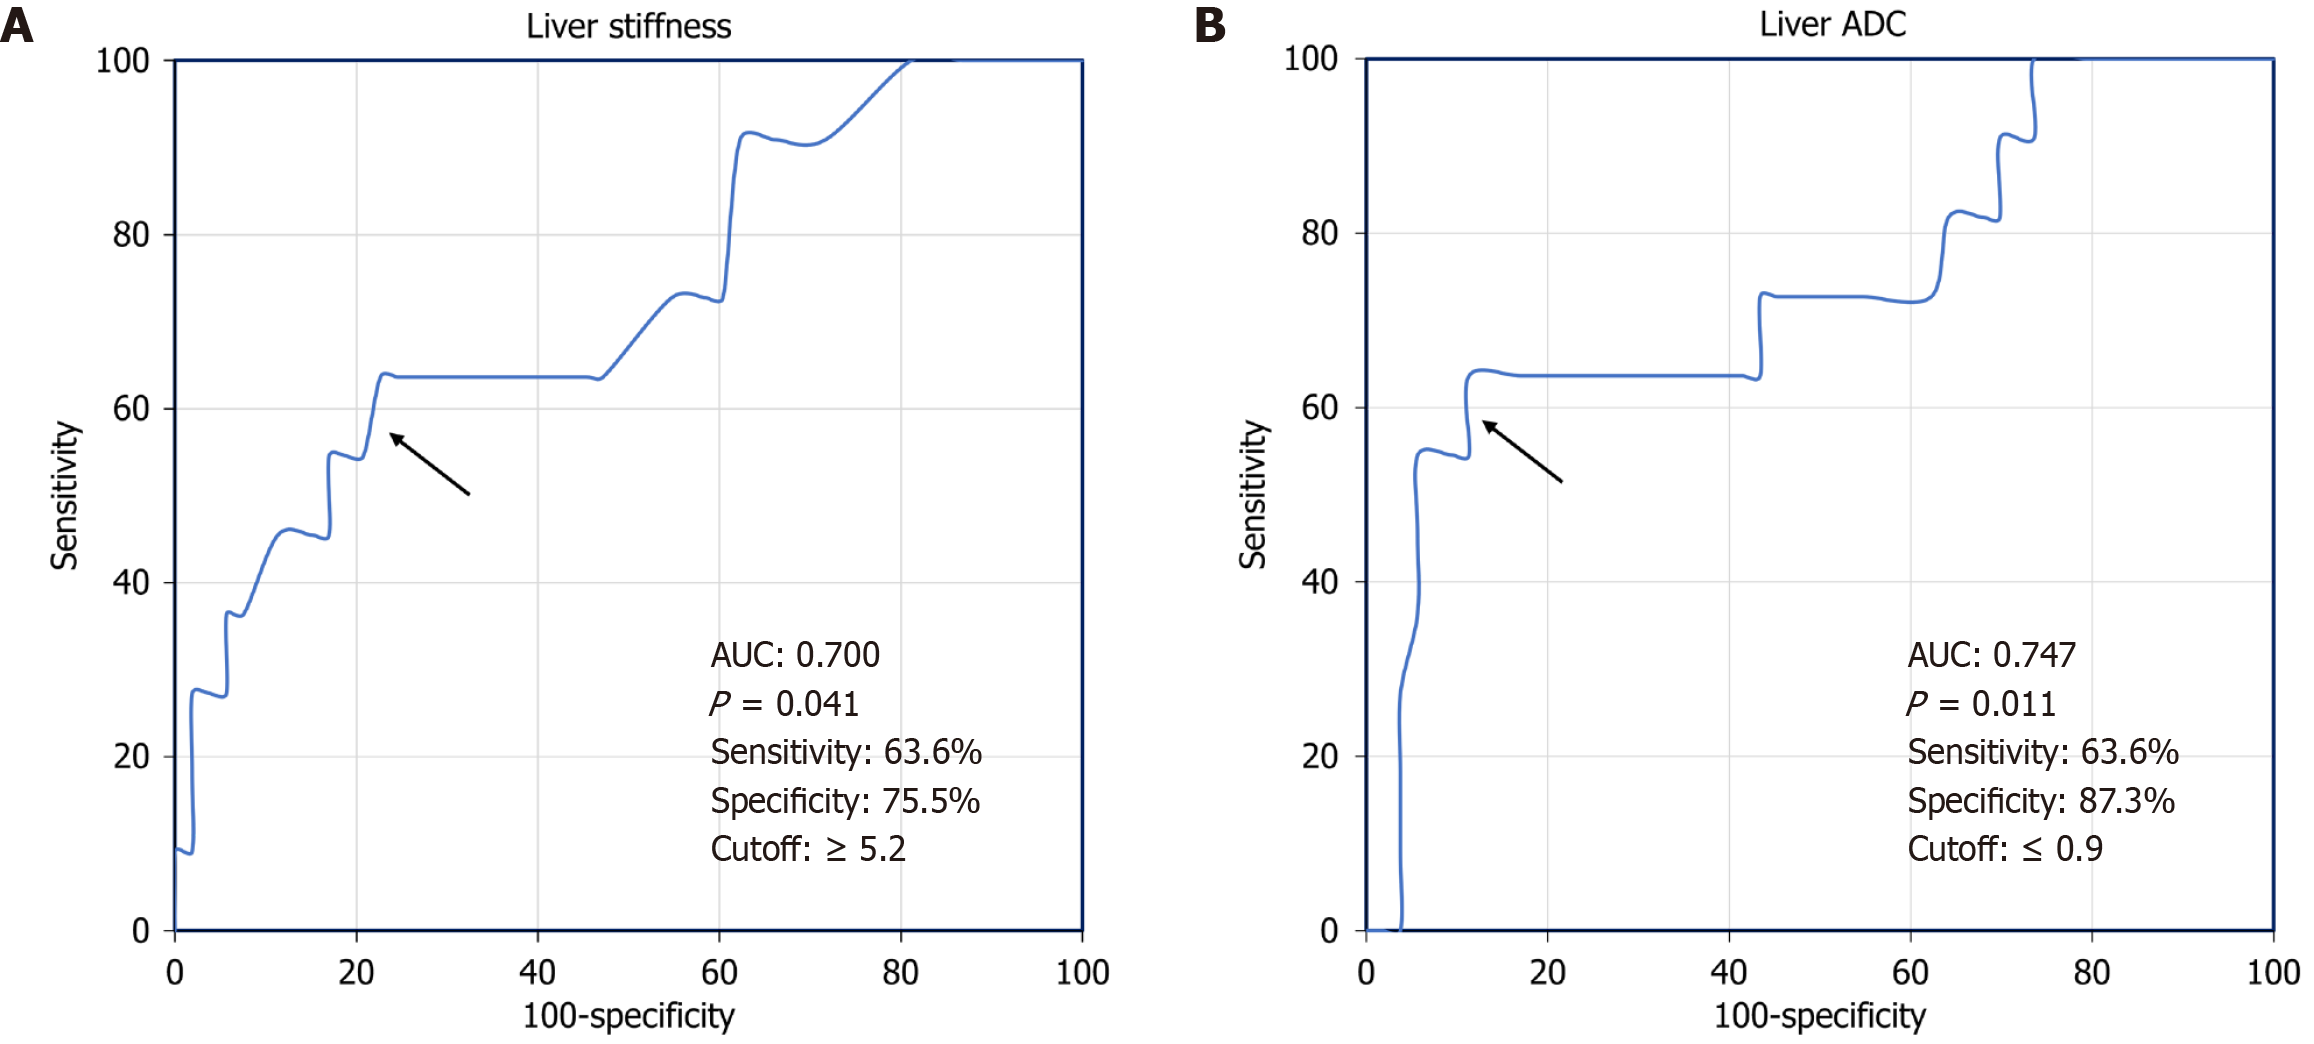
Figure 2 Diagnostic performance of noninvasive parameters of fibrosis in discriminating significant fibrosis (≥ F3).
A: Liver stiffness measurement; B: Liver apparent diffusion coefficient (ADC). AUC: Area under the curve.
- Citation: El-Guindi MA, Allam AA, Abdel-Razek AA, Sobhy GA, Salem ME, Abd-Allah MA, Sira MM. Transient elastography and diffusion-weighted magnetic resonance imaging for assessment of liver fibrosis in children with chronic hepatitis C. World J Virol 2024; 13(3): 96369
- URL: https://www.wjgnet.com/2220-3249/full/v13/i3/96369.htm
- DOI: https://dx.doi.org/10.5501/wjv.v13.i3.96369


