Copyright
©The Author(s) 2024.
World J Virol. Sep 25, 2024; 13(3): 95709
Published online Sep 25, 2024. doi: 10.5501/wjv.v13.i3.95709
Published online Sep 25, 2024. doi: 10.5501/wjv.v13.i3.95709
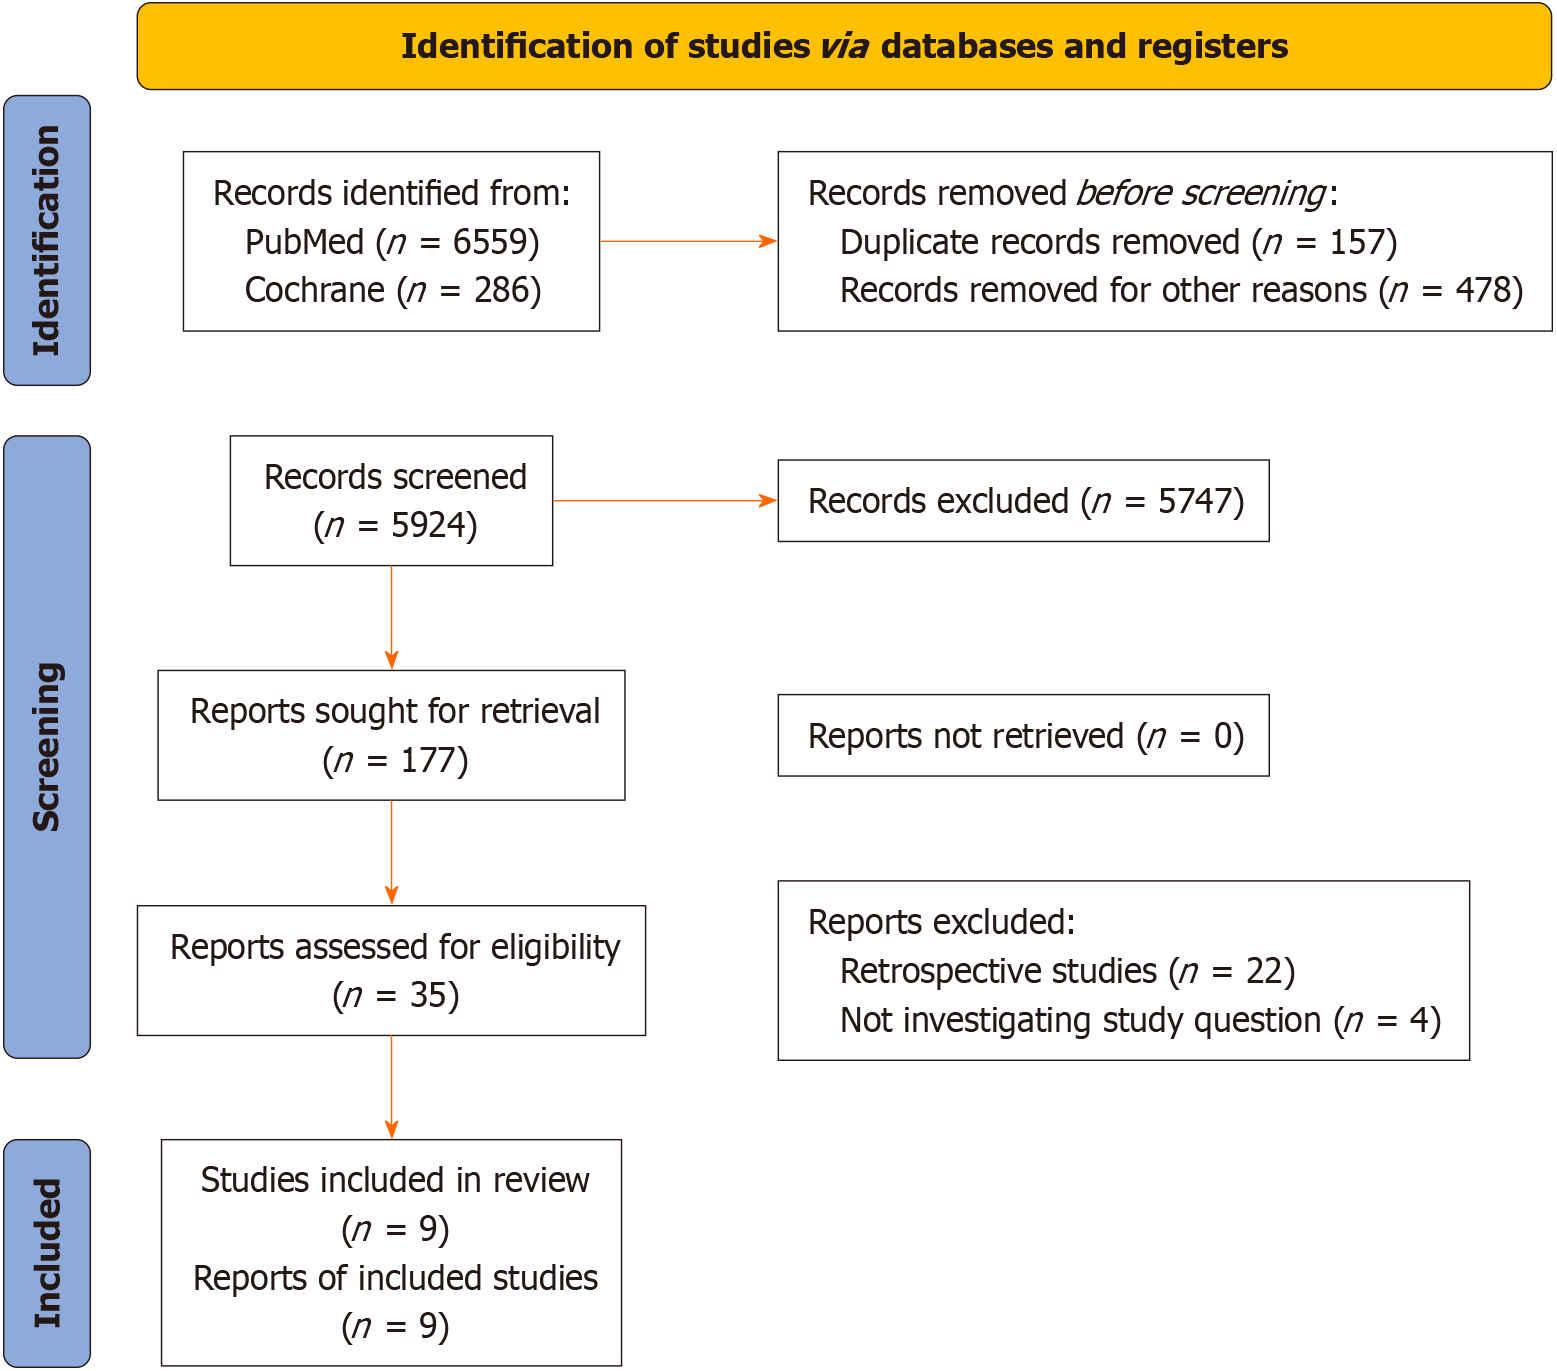
Figure 1 Study prisma flow chart.
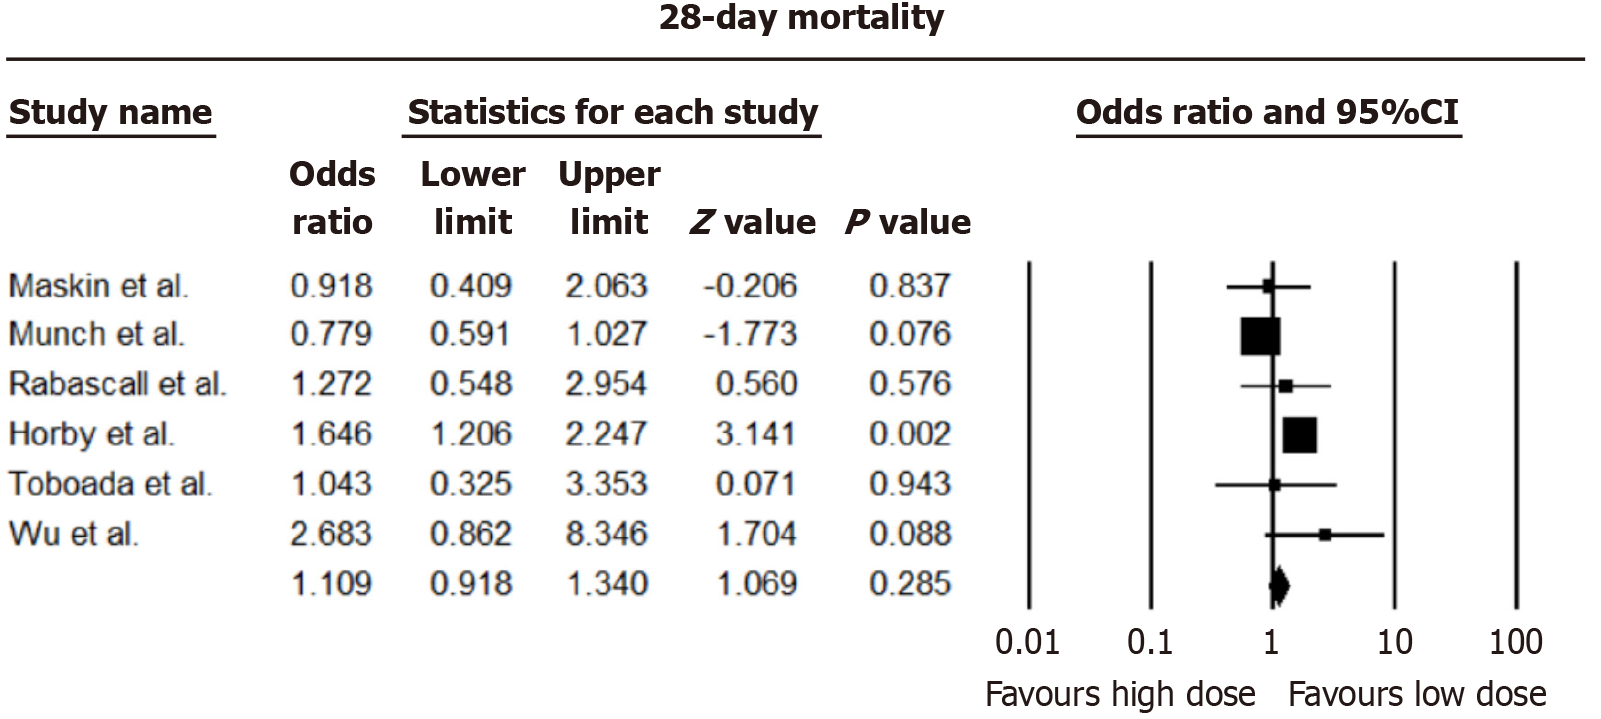
Figure 2 Pooled odds ratio for 28-day mortality rates.
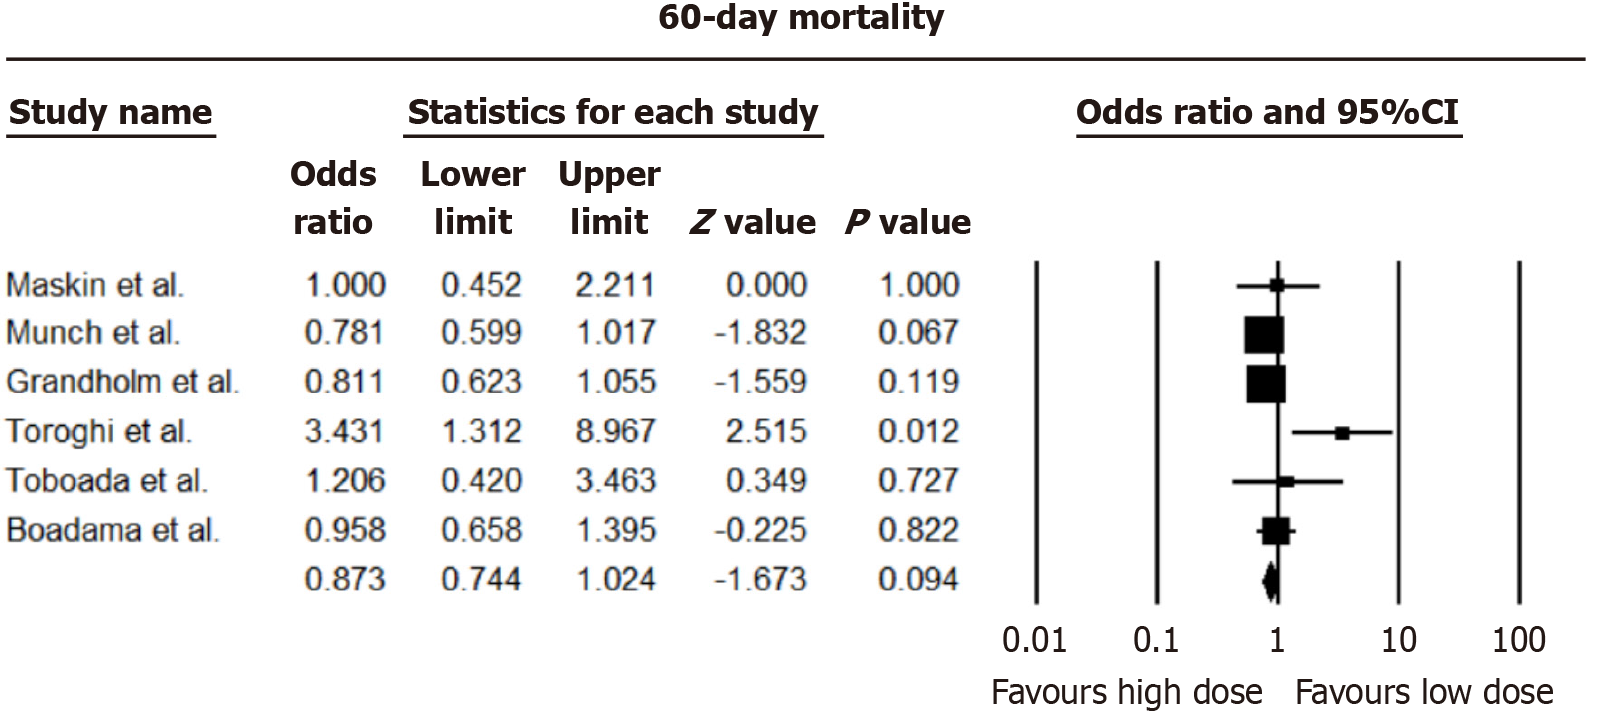
Figure 3 Pooled odds ratio for 60-day mortality rates.
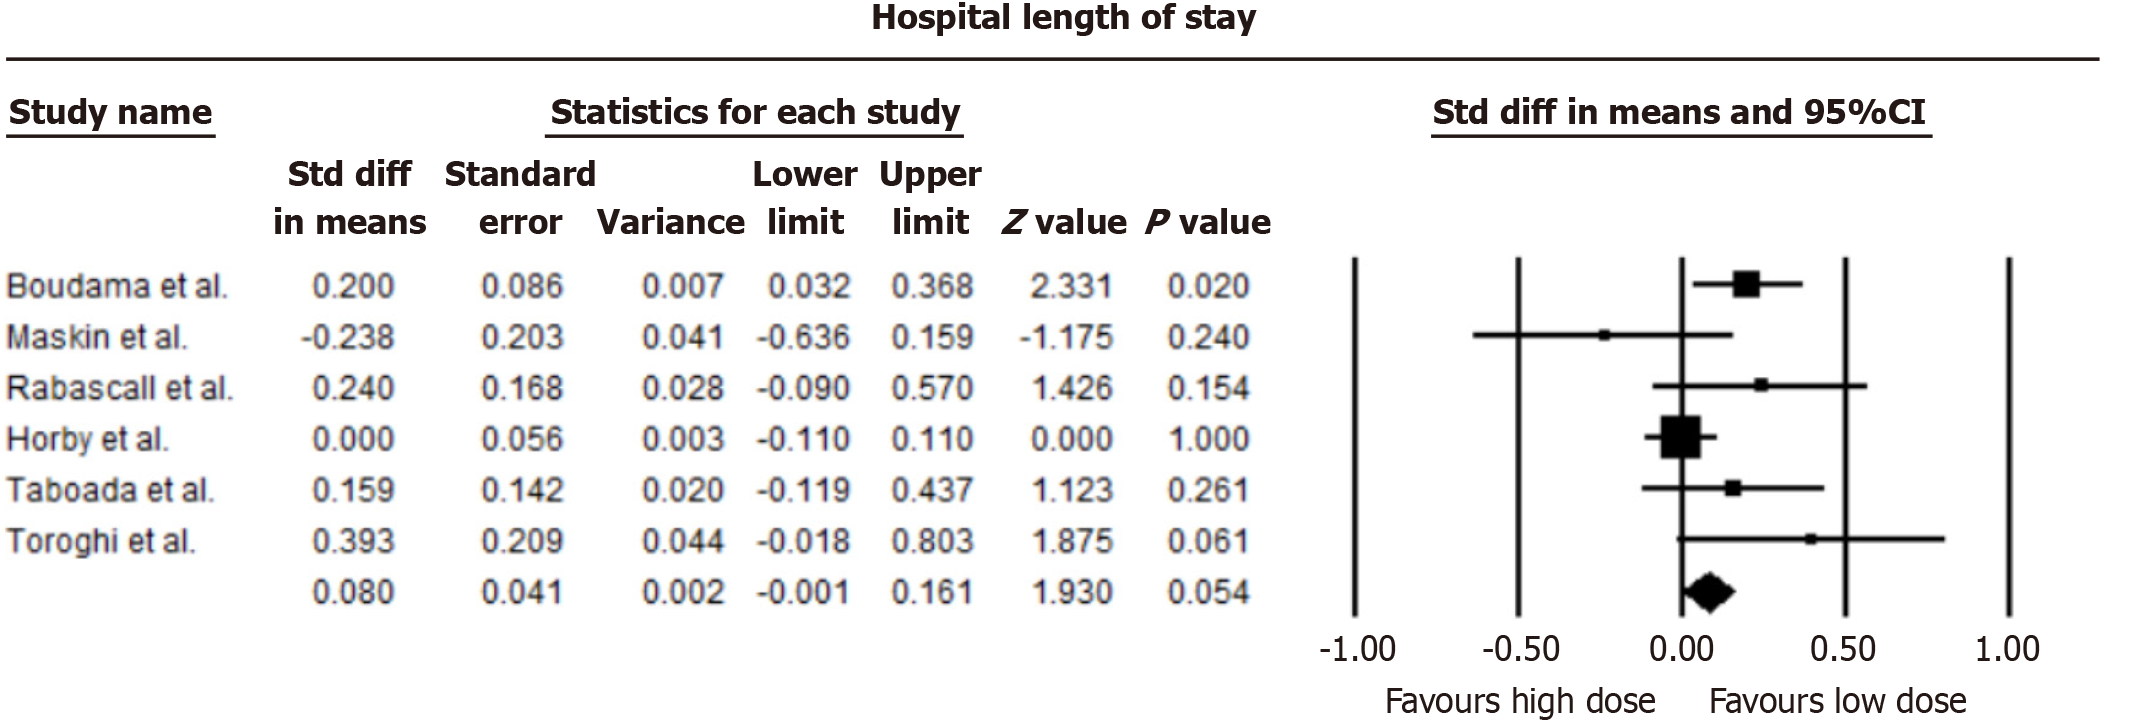
Figure 4 Comparison of average length of hospital stay.
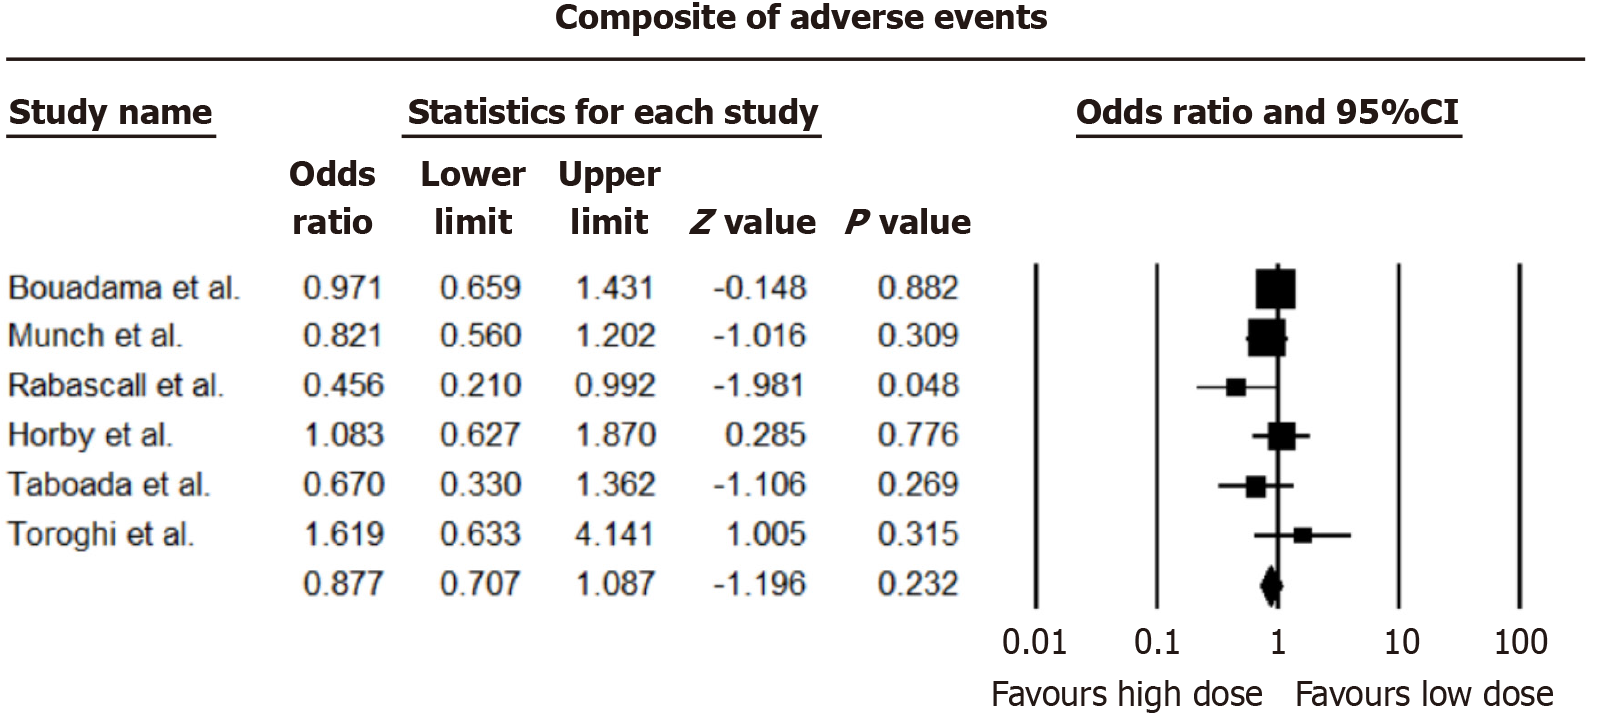
Figure 5 Incidence of adverse events in high-dose vs low-dose groups.
- Citation: Sethi I, Shaikh A, Sethi M, Chohan HK, Younus S, Khan SA, Surani S. Dosage and utilization of dexamethasone in the management of COVID-19: A critical review. World J Virol 2024; 13(3): 95709
- URL: https://www.wjgnet.com/2220-3249/full/v13/i3/95709.htm
- DOI: https://dx.doi.org/10.5501/wjv.v13.i3.95709


