Copyright
©The Author(s) 2024.
World J Virol. Mar 25, 2024; 13(1): 89469
Published online Mar 25, 2024. doi: 10.5501/wjv.v13.i1.89469
Published online Mar 25, 2024. doi: 10.5501/wjv.v13.i1.89469
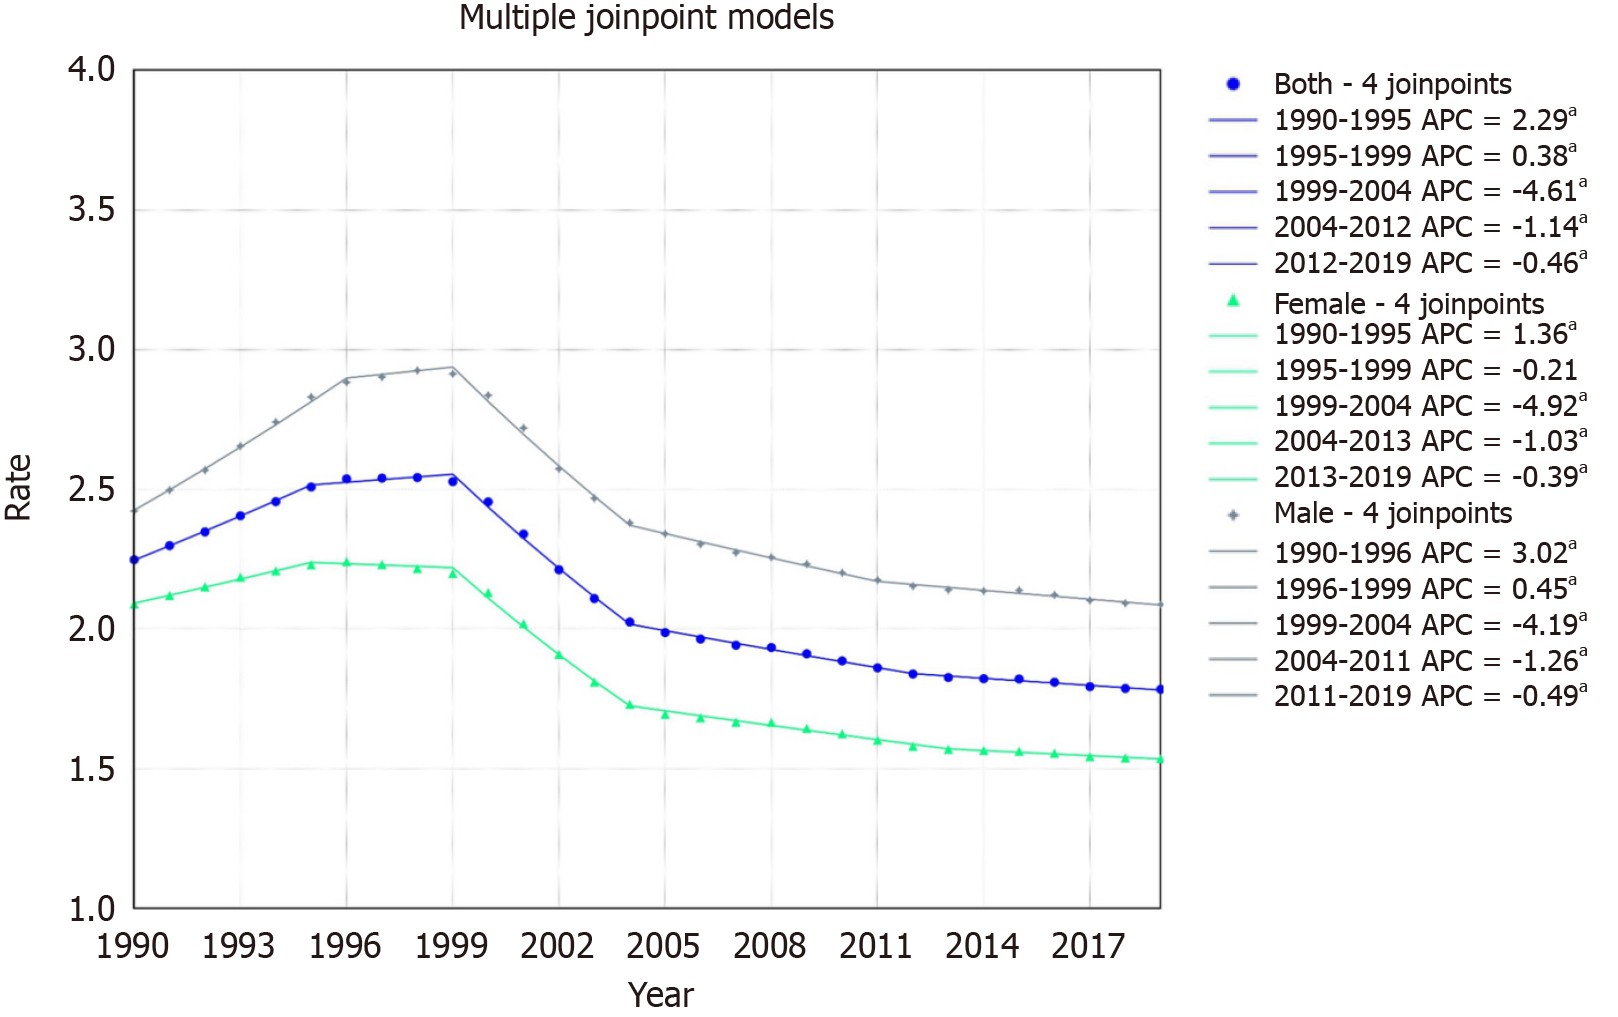
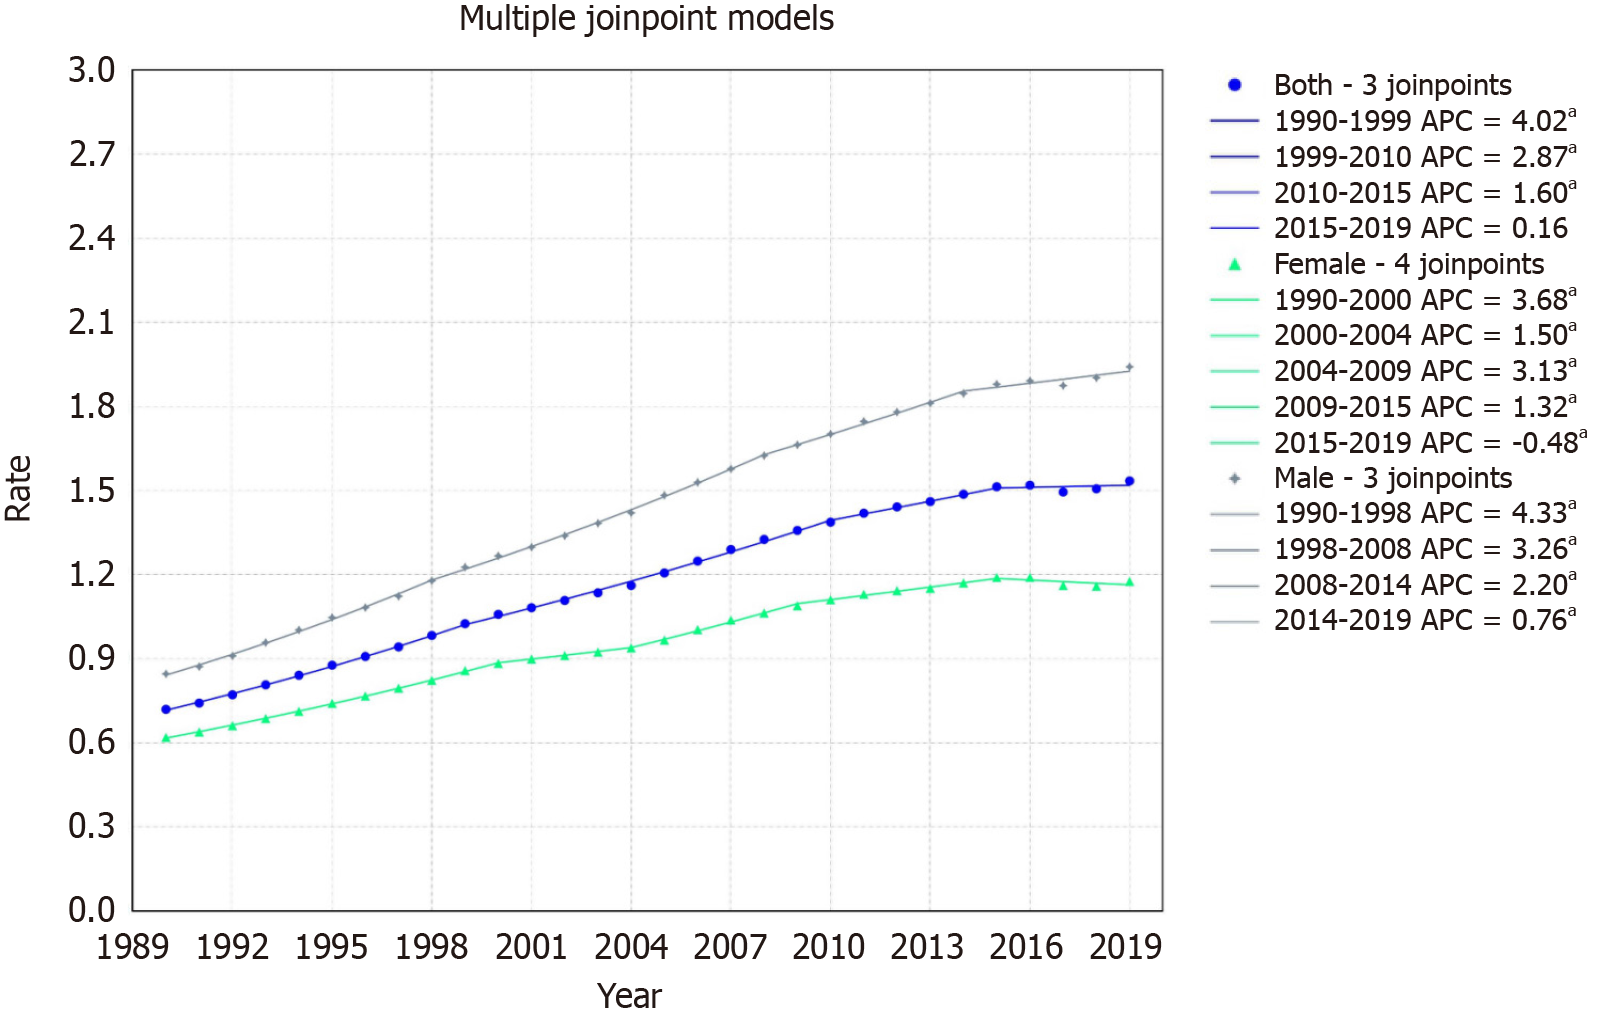
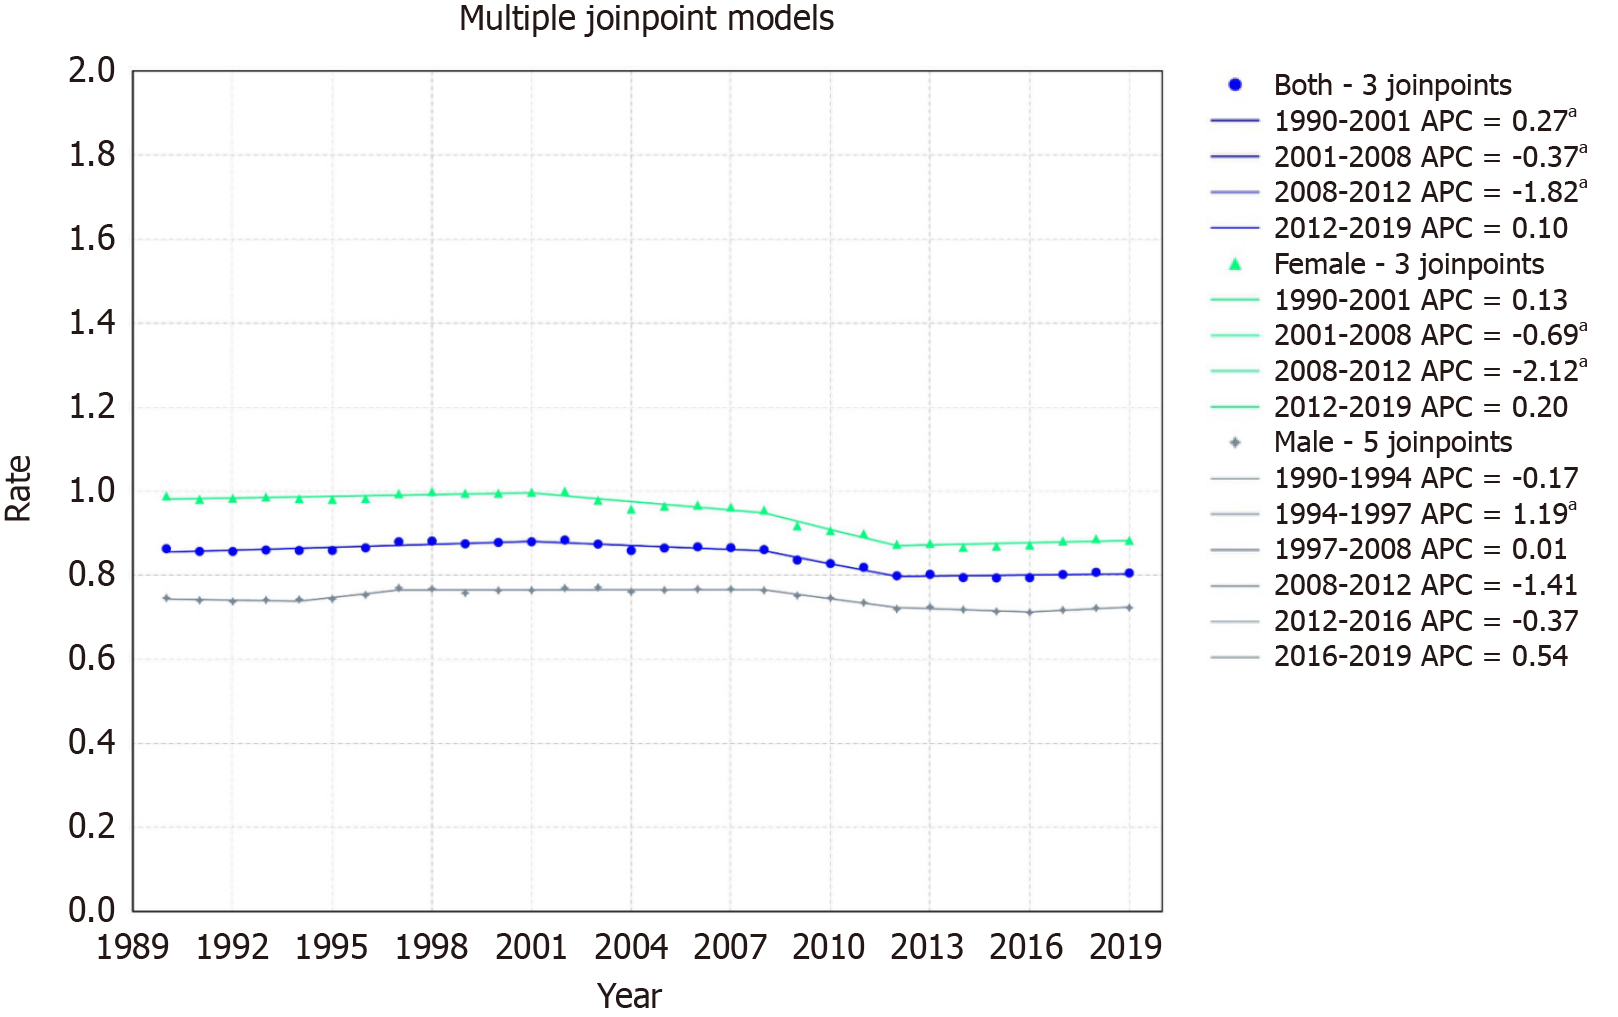
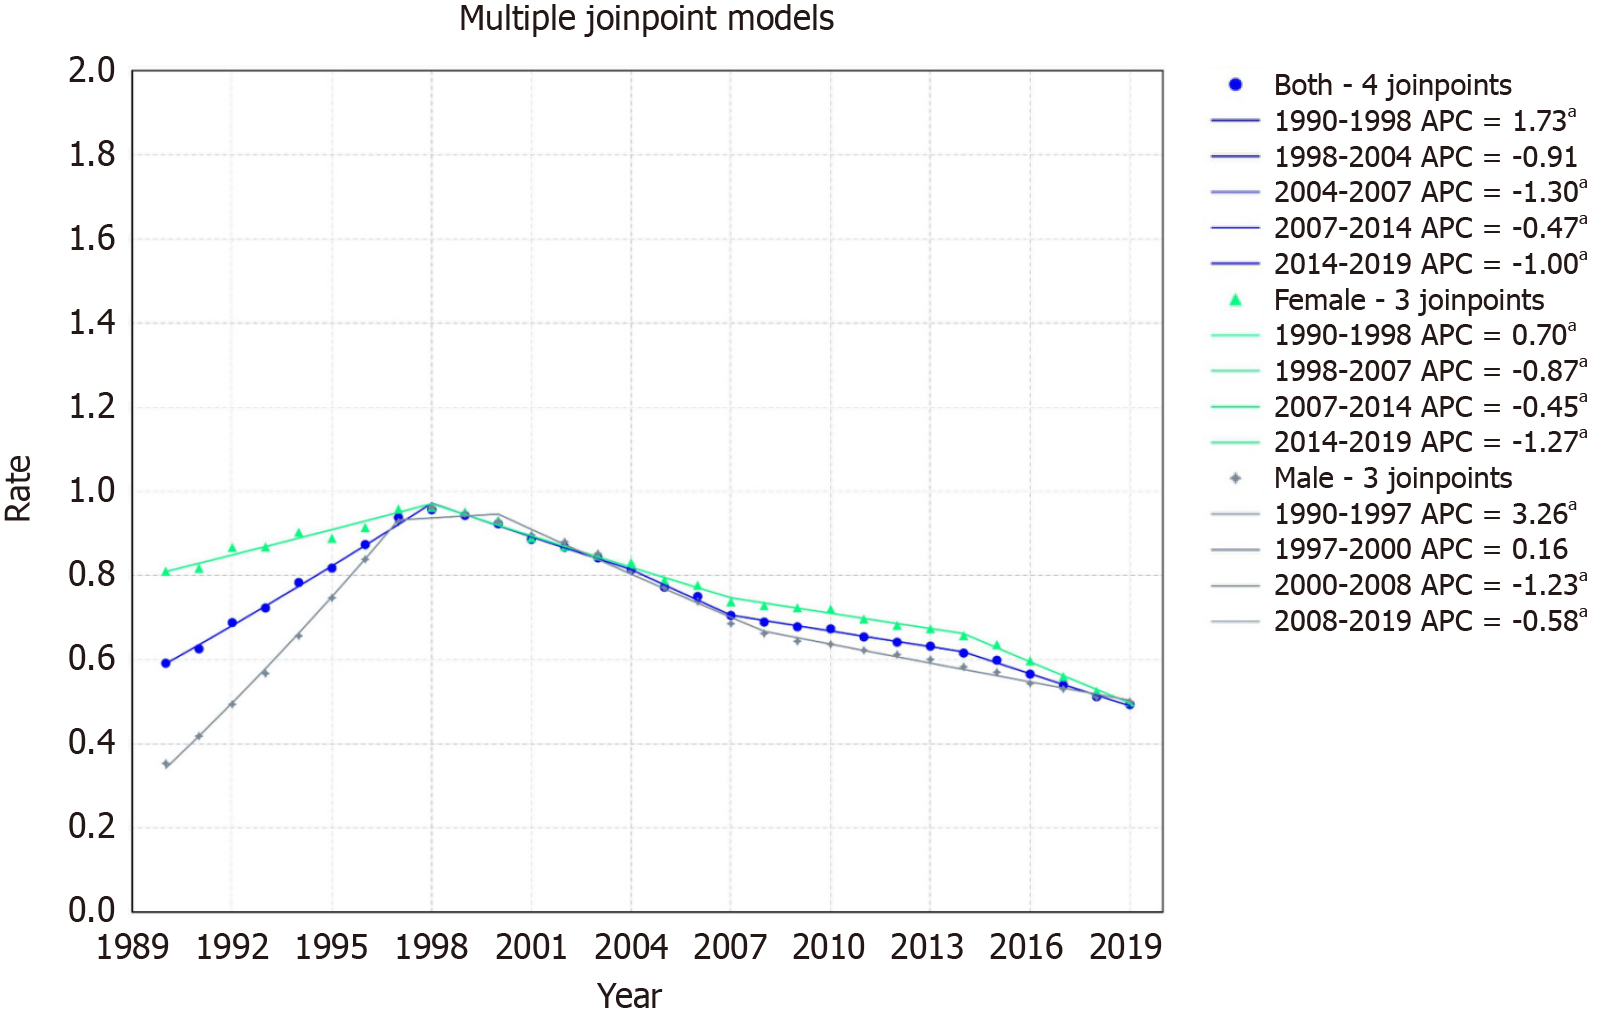
Figure 1 Hepatitis C-related hepatocellular carcinoma mortality rates per 100000 from 1999 to 2019 globally (World Bank regions).
aP value < 0.05, significant trend.
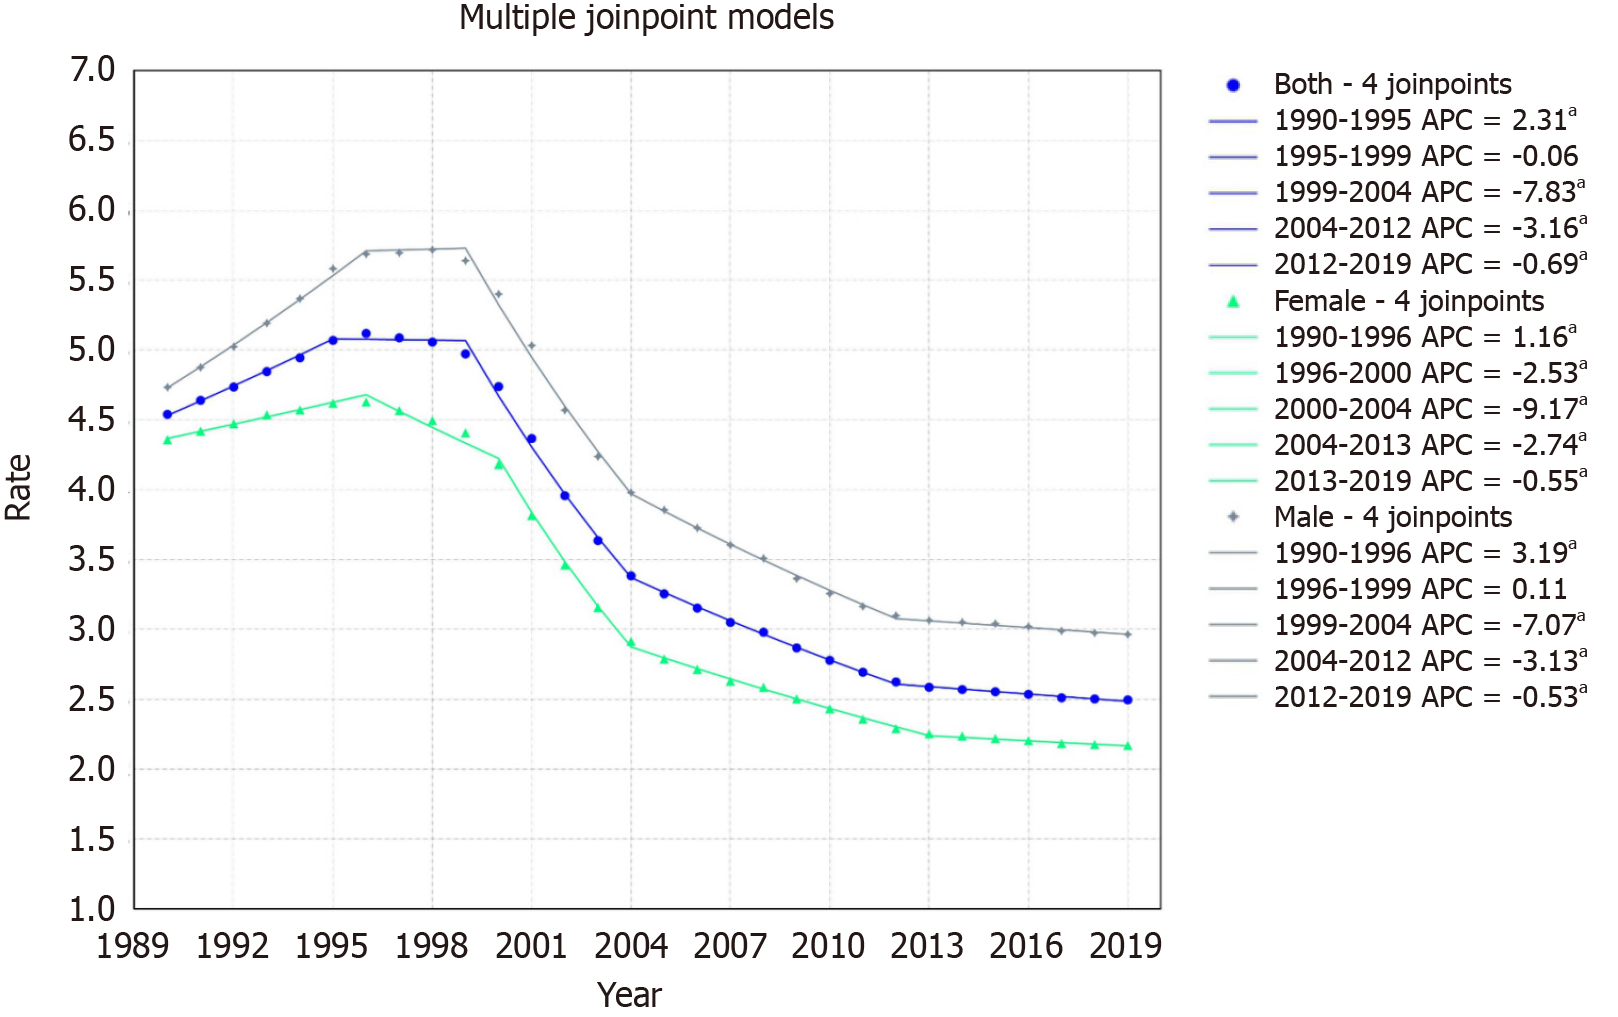
Figure 2 Hepatitis C-related hepatocellular carcinoma mortality rates per 100000 from 1999 to 2019 in East Asia and Pacific region.
aP value < 0.05, significant trend.
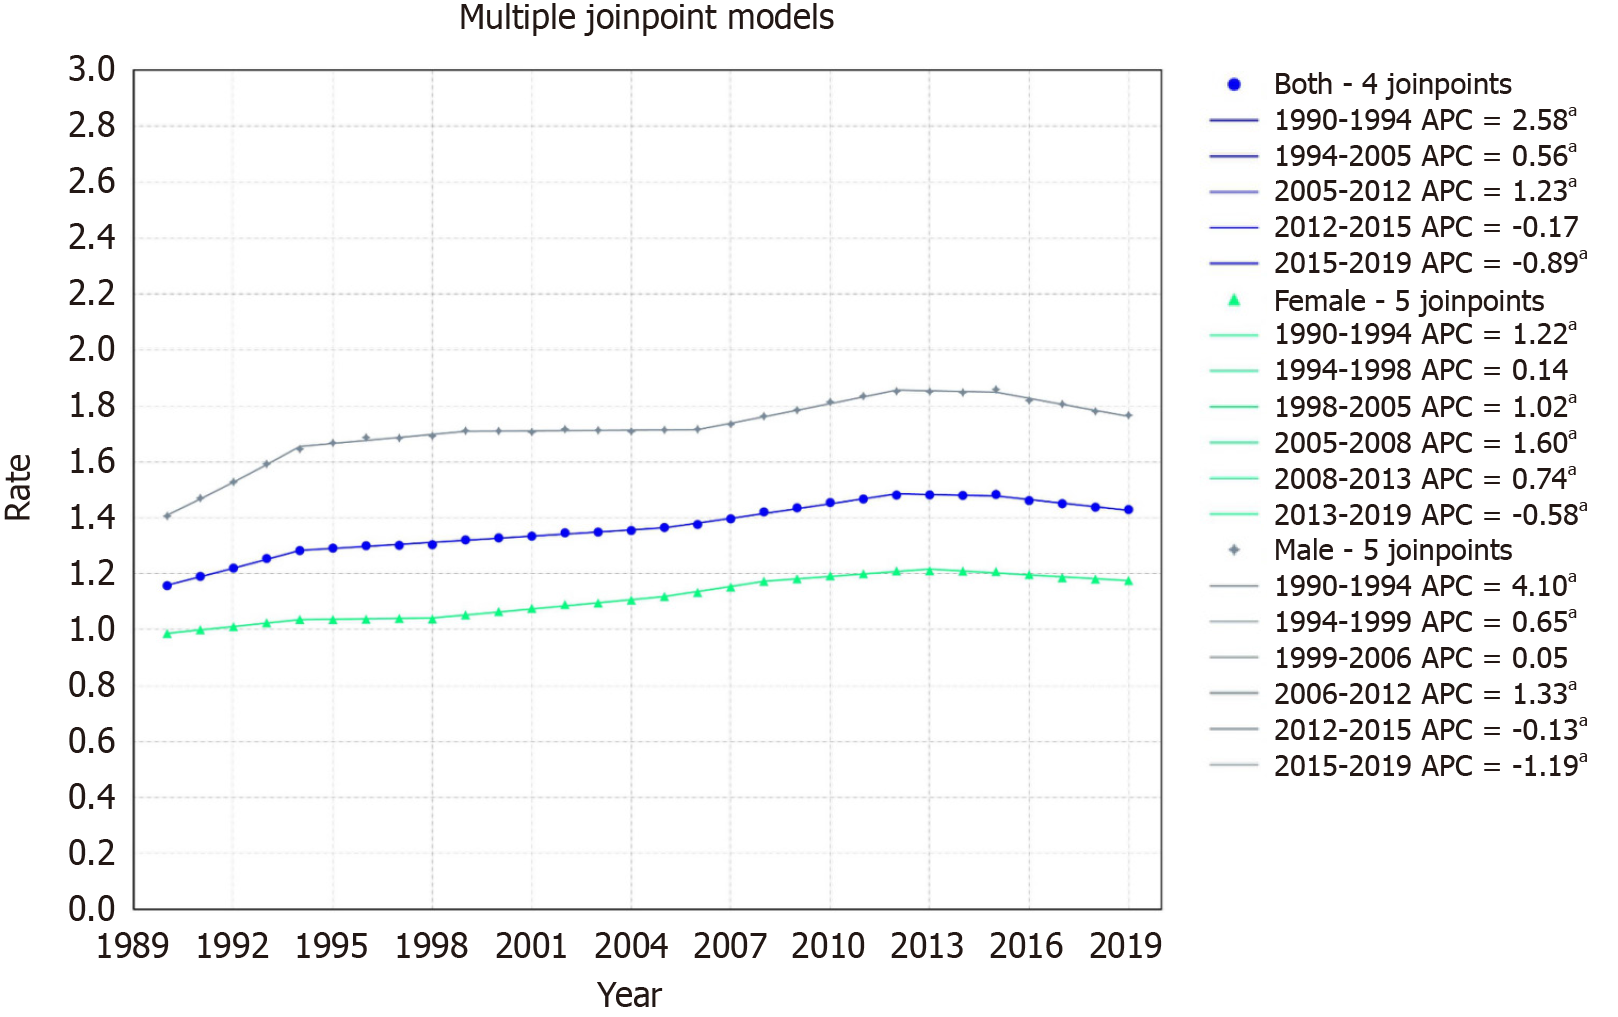
Figure 3 Hepatitis C-related hepatocellular carcinoma mortality rates per 100000 from 1999 to 2019 in Europe and Central Asia region.
aP value < 0.05, significant trend.
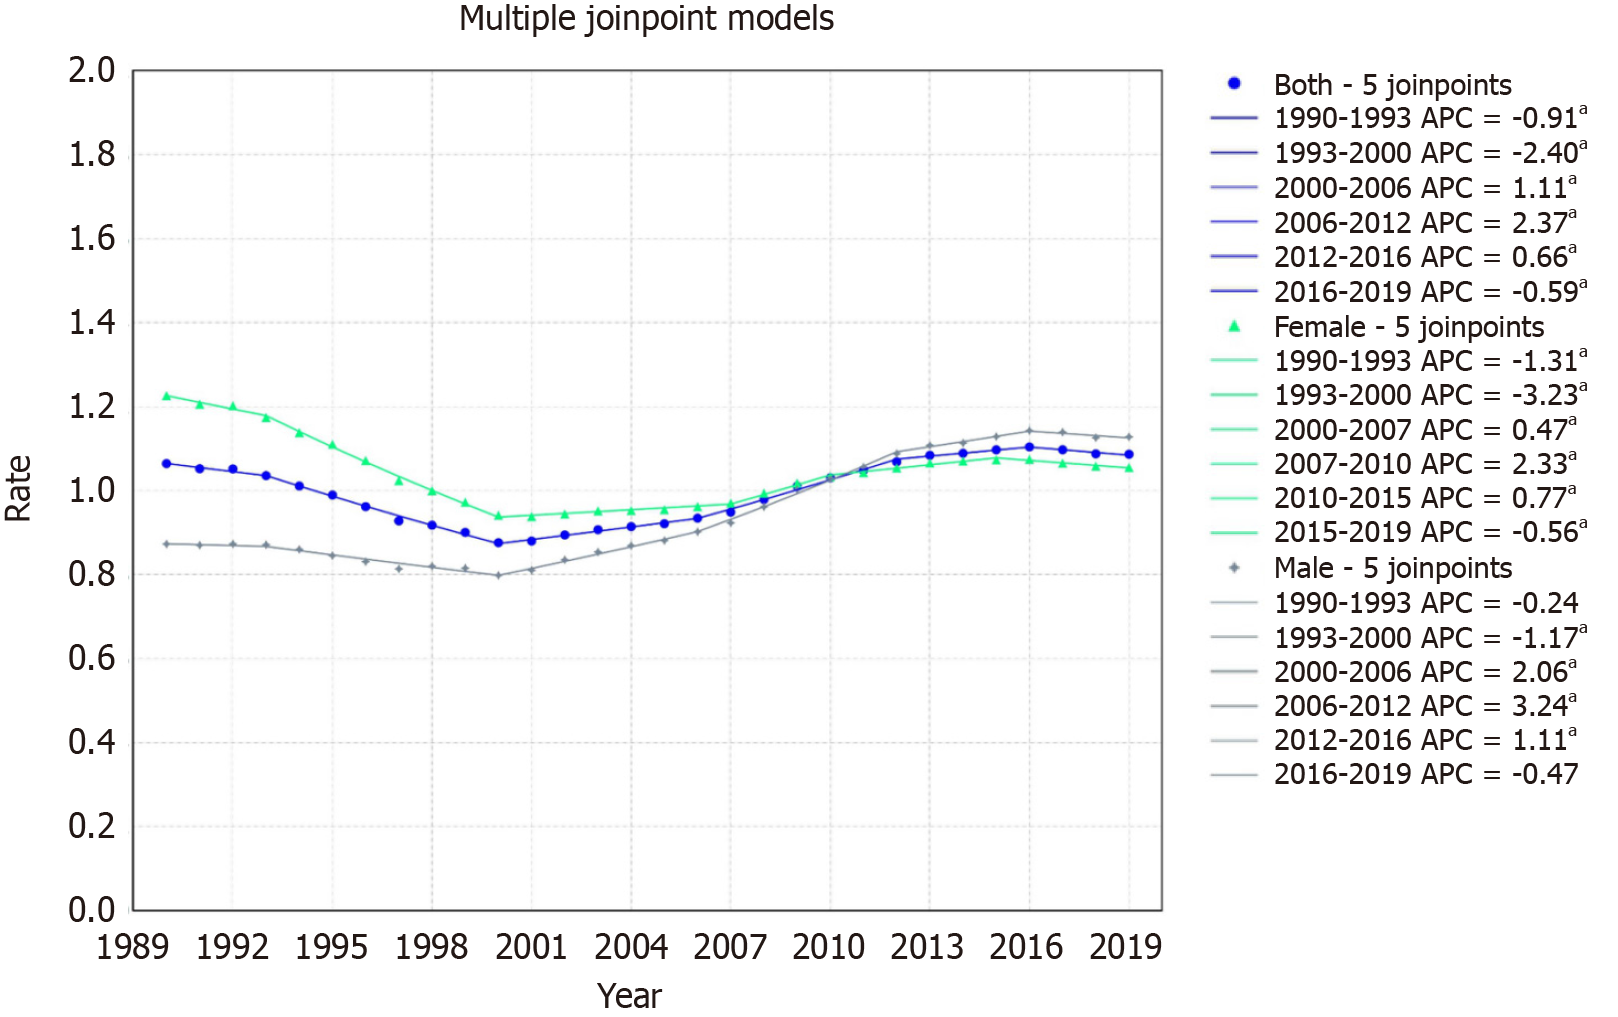
Figure 4 Hepatitis C-related hepatocellular carcinoma mortality rates per 100000 from 1999 to 2019 in Latin America and the Caribbean region.
aP value < 0.05, significant trend.
Figure 5 Hepatitis C-related hepatocellular carcinoma mortality rates per 100000 from 1999 to 2019 in the Middle East and North Africa region.
aP value < 0.05, significant trend.
Figure 6 Hepatitis C-related hepatocellular carcinoma mortality rates per 100,000 from 1999 to 2019 in the North America region.
aP value < 0.05, significant trend.
Figure 7 Hepatitis C-related hepatocellular carcinoma mortality rates per 100000 from 1999 to 2019 in the South Asia region.
aP value < 0.05, significant trend.
Figure 8 Hepatitis C-related hepatocellular carcinoma mortality rates per 100000 from 1999 to 2019 in the Sub Saharan African region.
aP value < 0.05, significant trend.
- Citation: Ali H, Vikash F, Moond V, Khalid F, Jamil AR, Dahiya DS, Sohail AH, Gangwani MK, Patel P, Satapathy SK. Global trends in hepatitis C-related hepatocellular carcinoma mortality: A public database analysis (1999-2019). World J Virol 2024; 13(1): 89469
- URL: https://www.wjgnet.com/2220-3249/full/v13/i1/89469.htm
- DOI: https://dx.doi.org/10.5501/wjv.v13.i1.89469


