Copyright
©The Author(s) 2024.
World J Virol. Mar 25, 2024; 13(1): 88660
Published online Mar 25, 2024. doi: 10.5501/wjv.v13.i1.88660
Published online Mar 25, 2024. doi: 10.5501/wjv.v13.i1.88660
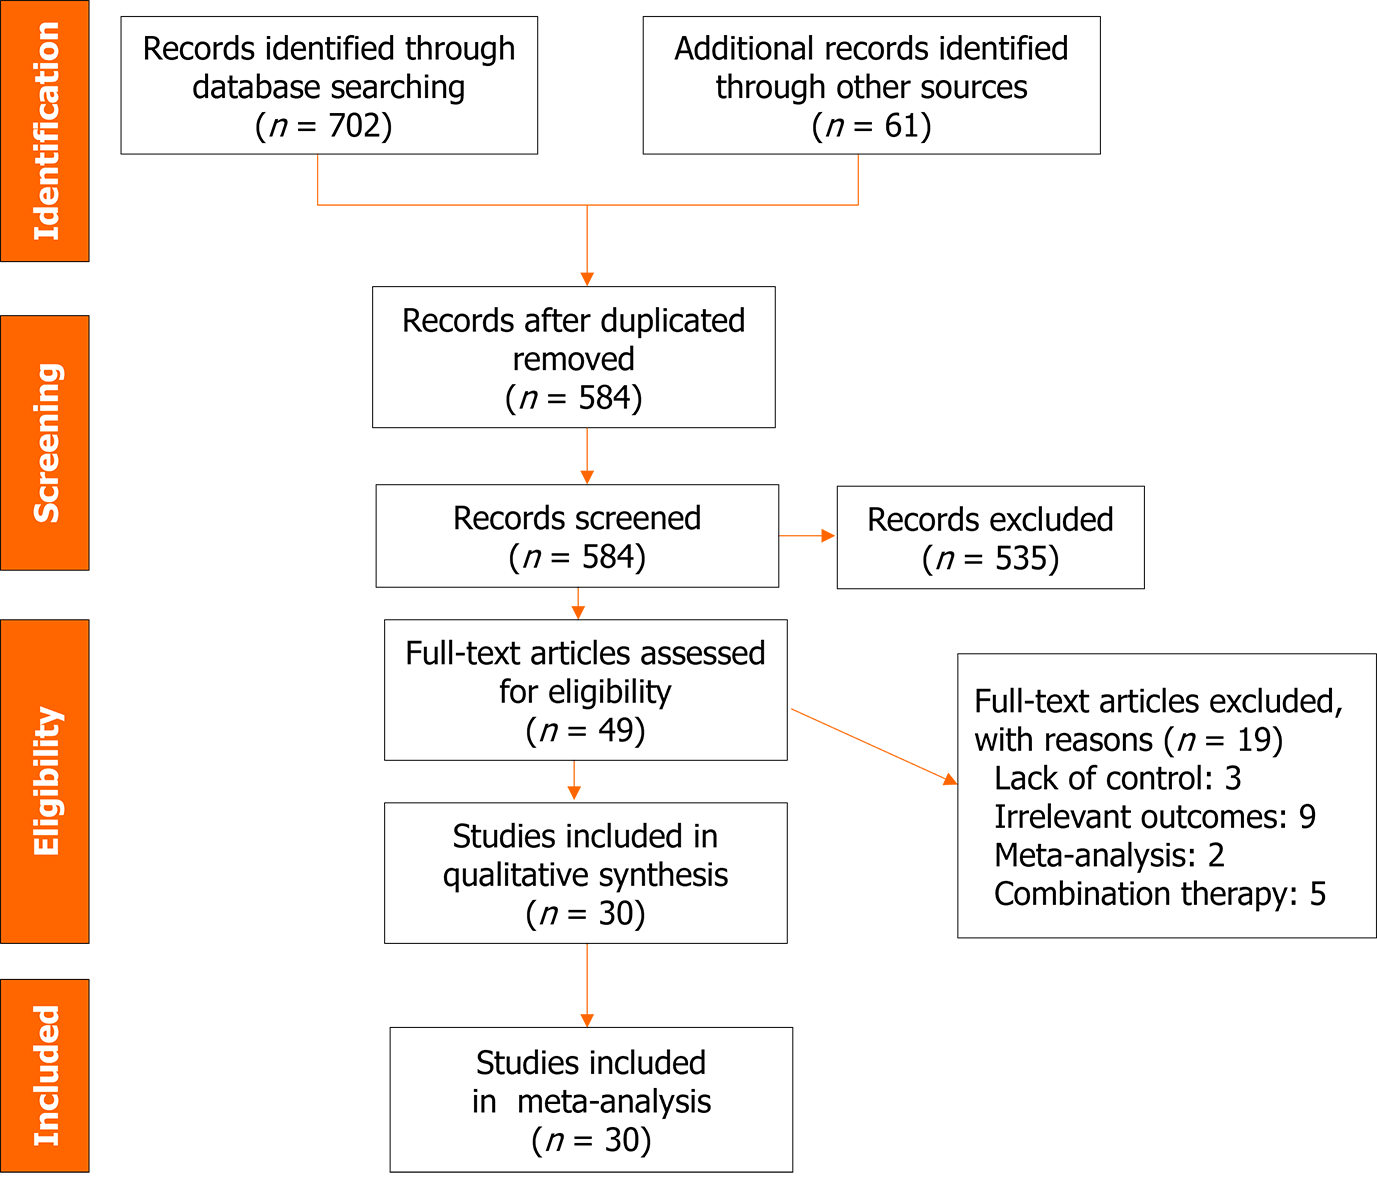
Figure 1 PRISMA flow diagram of study selection process.
Figure 2 Forest plot analysis.
A: Forest plot analysis for the outcome of mortality rate of bamlanivimab vs standard of care/placebo (SOC/PBO) in patients with coronavirus disease 2019 (COVID-19); B: Forest plot analysis for the outcome of hospitalization rate of bamlanivimab vs SOC/PBO in patients with COVID-19; C: Forest plot analysis for the outcome of emergency department visit of bamlanivimab vs SOC/PBO in patients with COVID-19; D: Forest plot analysis for the outcome of intensive care unit admission of bamlanivimab vs SOC/PBO in patients with COVID-19; E: Forest plot analysis for the outcome of adverse events of bamlanivimab vs SOC/PBO in patients with COVID-19. CI: Confidence interval.
- Citation: Amani B, Khodavirdilou L, Rajabkhah K, Kardan Moghaddam V, Akbarzadeh A, Amani B. Efficacy and safety of bamlanivimab in patients with COVID-19: A systematic review and meta-analysis. World J Virol 2024; 13(1): 88660
- URL: https://www.wjgnet.com/2220-3249/full/v13/i1/88660.htm
- DOI: https://dx.doi.org/10.5501/wjv.v13.i1.88660


