Copyright
©The Author(s) 2024.
World J Virol. Mar 25, 2024; 13(1): 87881
Published online Mar 25, 2024. doi: 10.5501/wjv.v13.i1.87881
Published online Mar 25, 2024. doi: 10.5501/wjv.v13.i1.87881
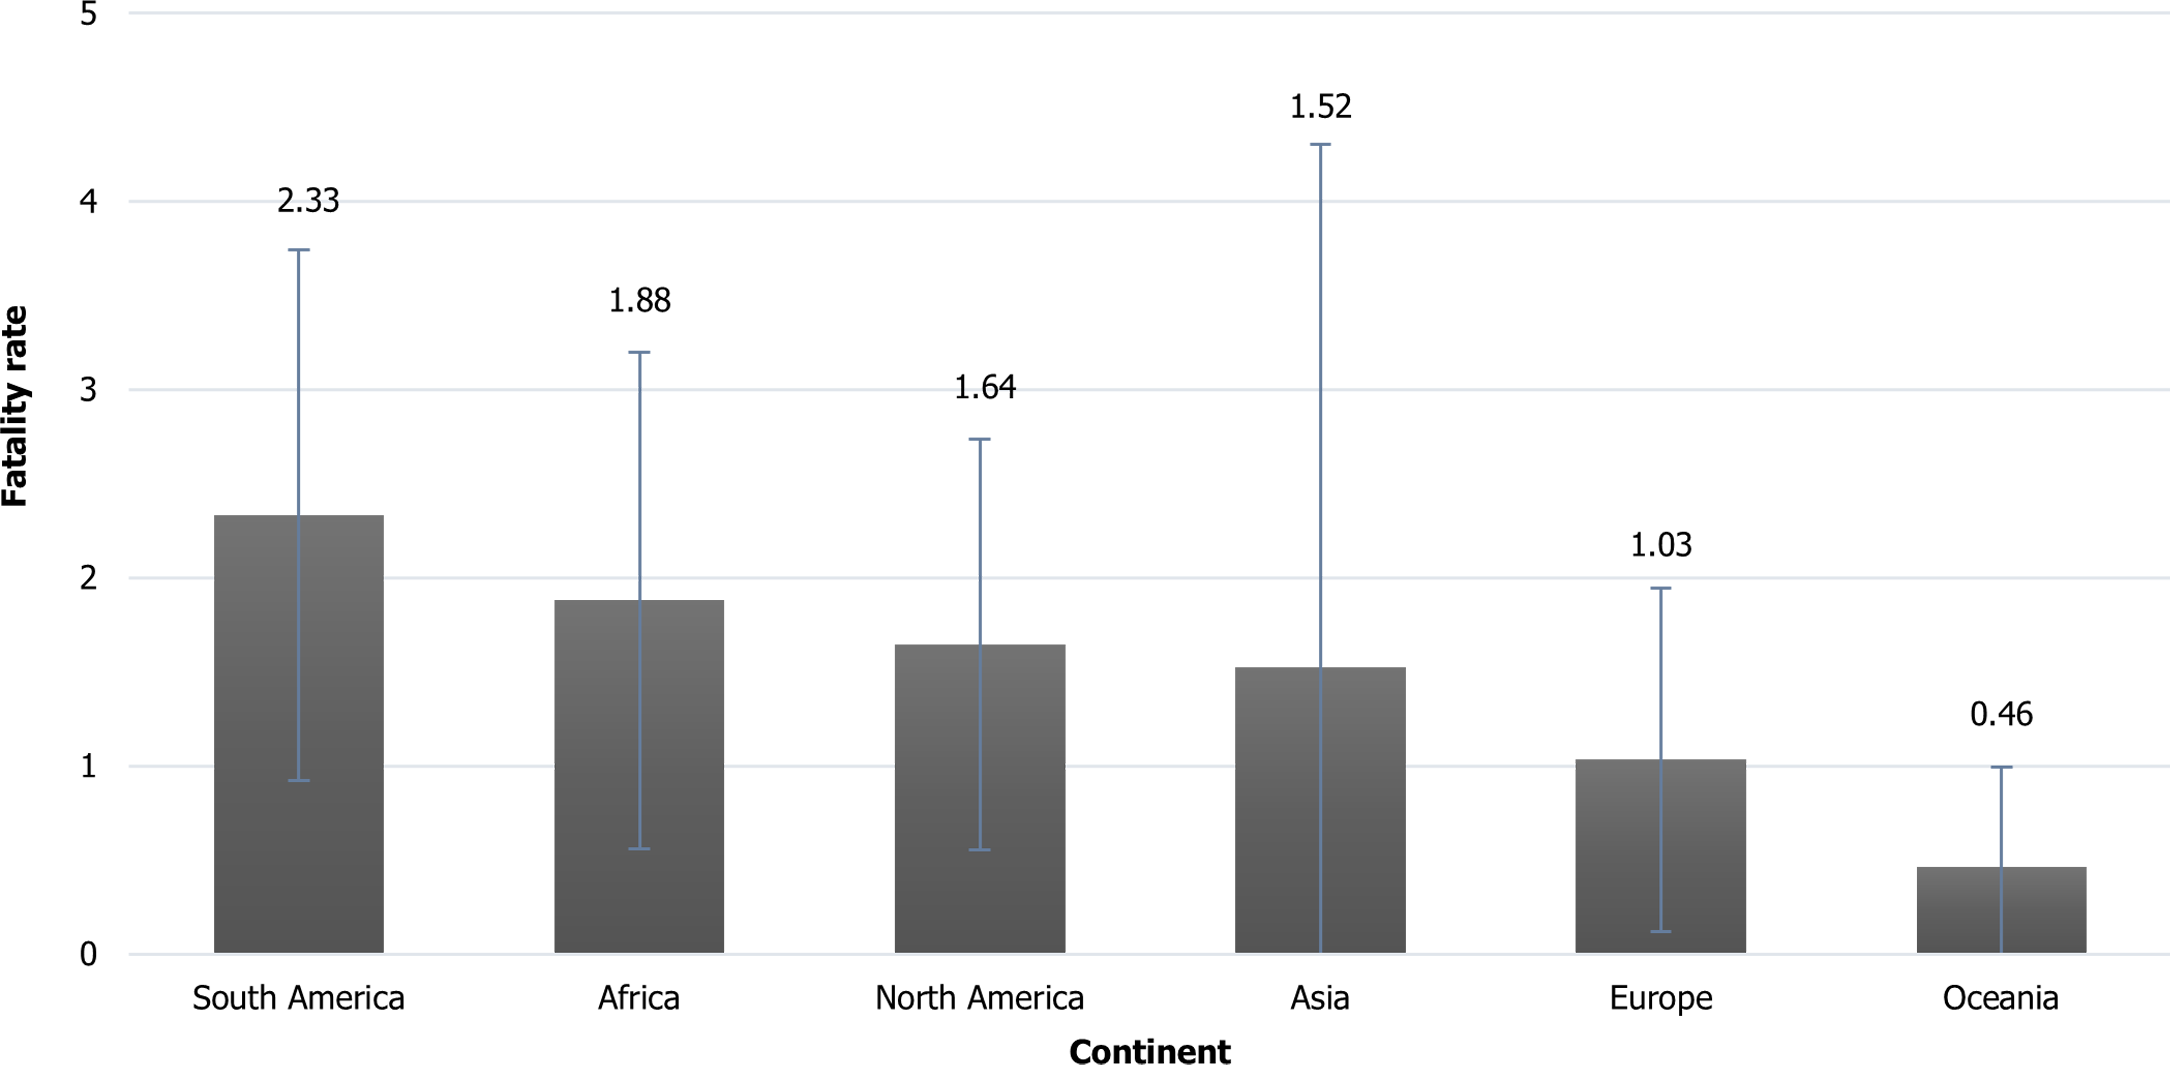
Figure 1 Coronavirus disease 2019 fatality rate by continent.
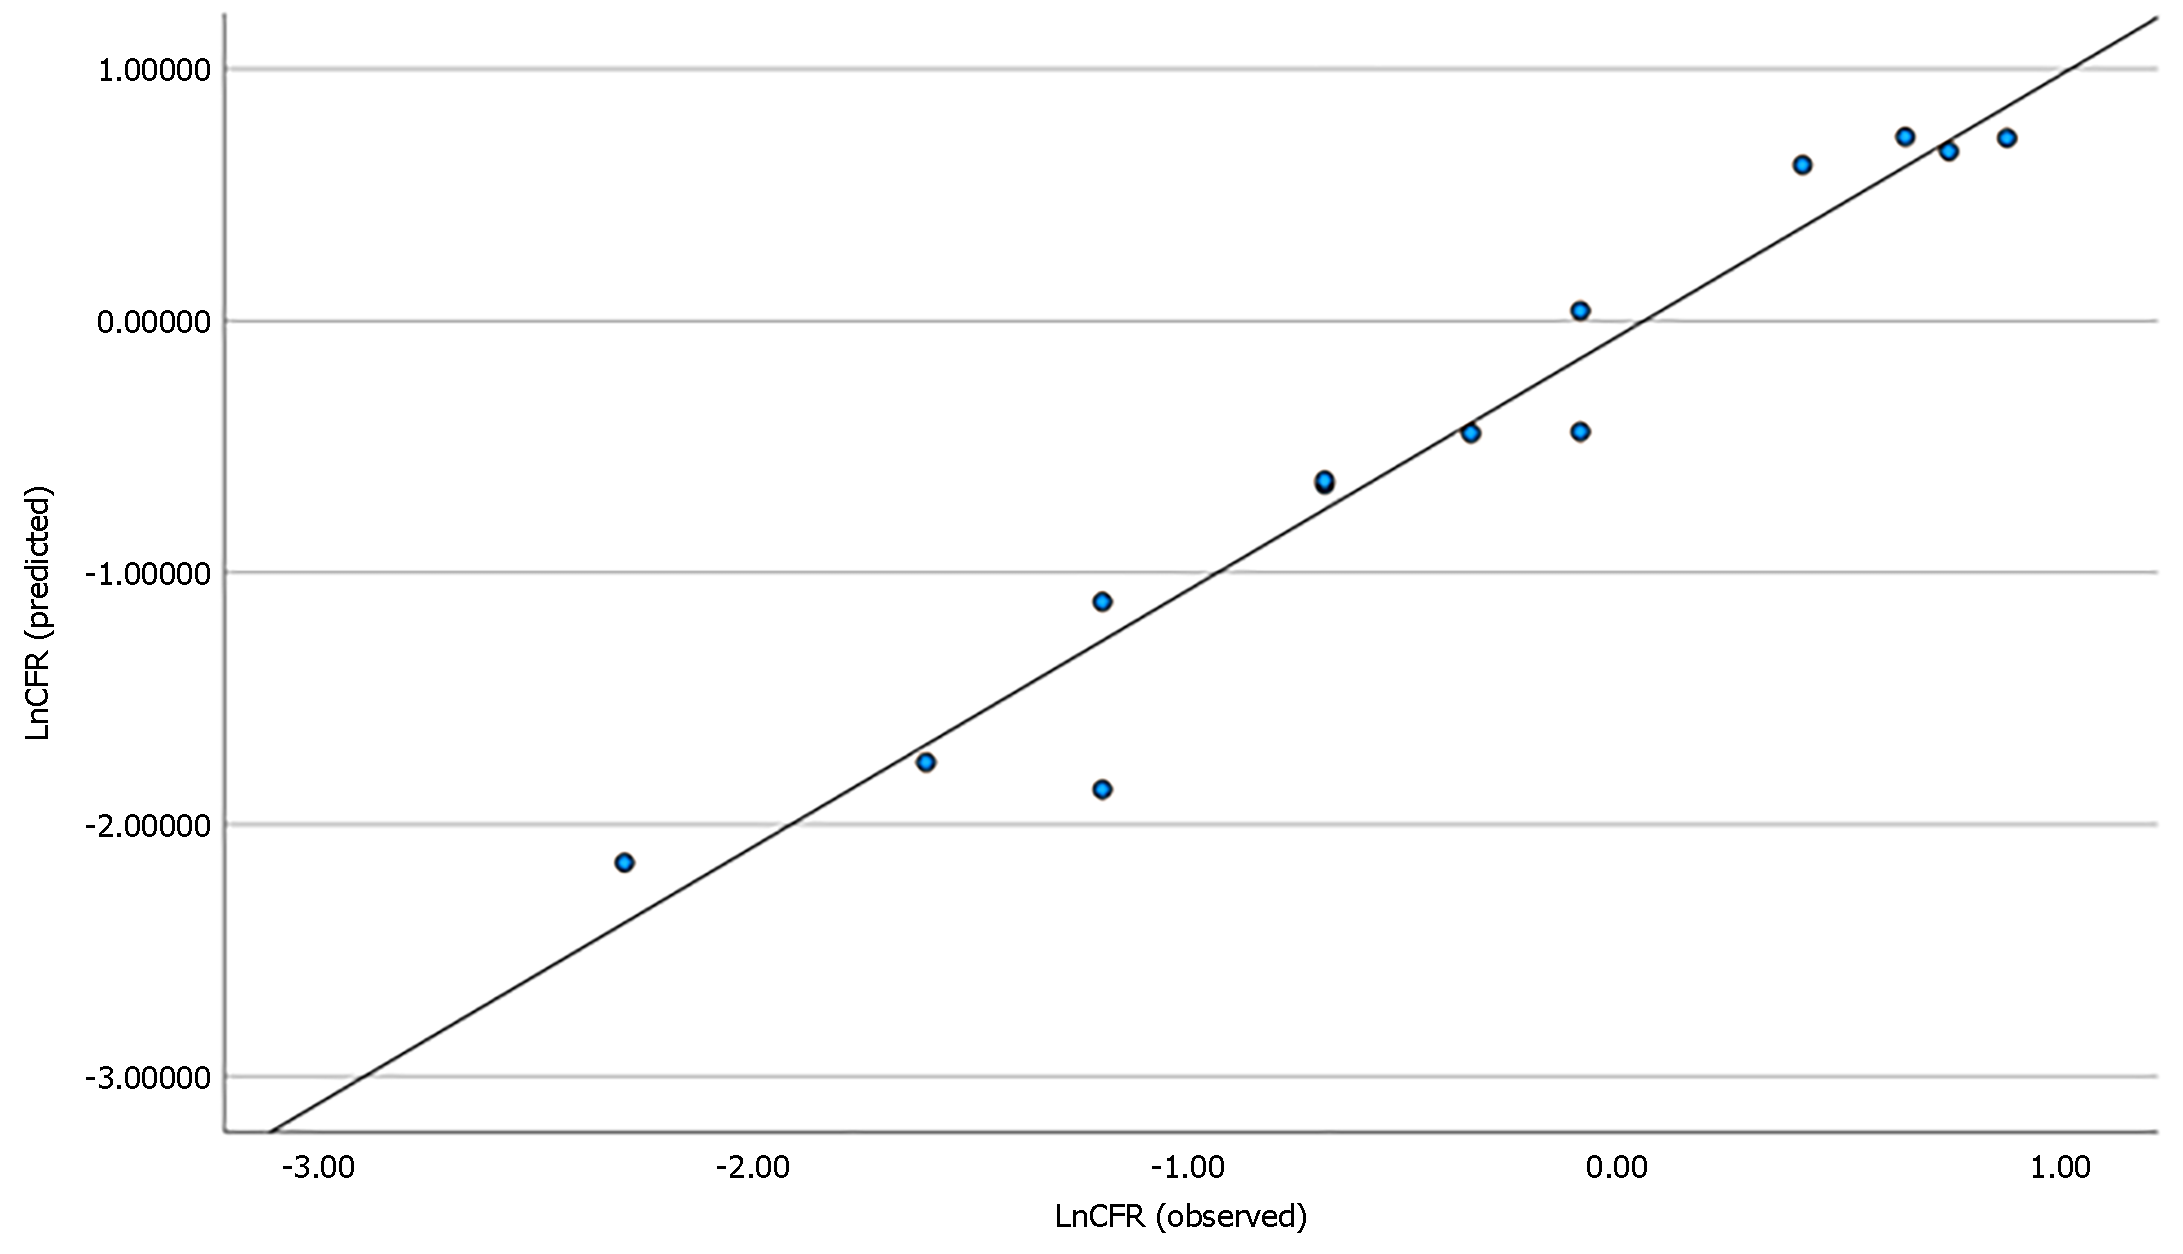
Figure 2 In this scatter plot, the relationship between the observed case fatality rate values and the estimated values obtained by the model can be seen.
Despite the fact that the model has shown a favorable fit, but due to the small number of data related to some variables, including the computed tomography scanners variable, we have lost a lot of data regarding case fatality rate. CFR: Case fatality rate.
- Citation: Sagheb S, Gholamrezanezhad A, Pavlovic E, Karami M, Fakhrzadegan M. Country-based modelling of COVID-19 case fatality rate: A multiple regression analysis. World J Virol 2024; 13(1): 87881
- URL: https://www.wjgnet.com/2220-3249/full/v13/i1/87881.htm
- DOI: https://dx.doi.org/10.5501/wjv.v13.i1.87881


