Copyright
©The Author(s) 2023.
World J Virol. Jun 25, 2023; 12(3): 209-220
Published online Jun 25, 2023. doi: 10.5501/wjv.v12.i3.209
Published online Jun 25, 2023. doi: 10.5501/wjv.v12.i3.209
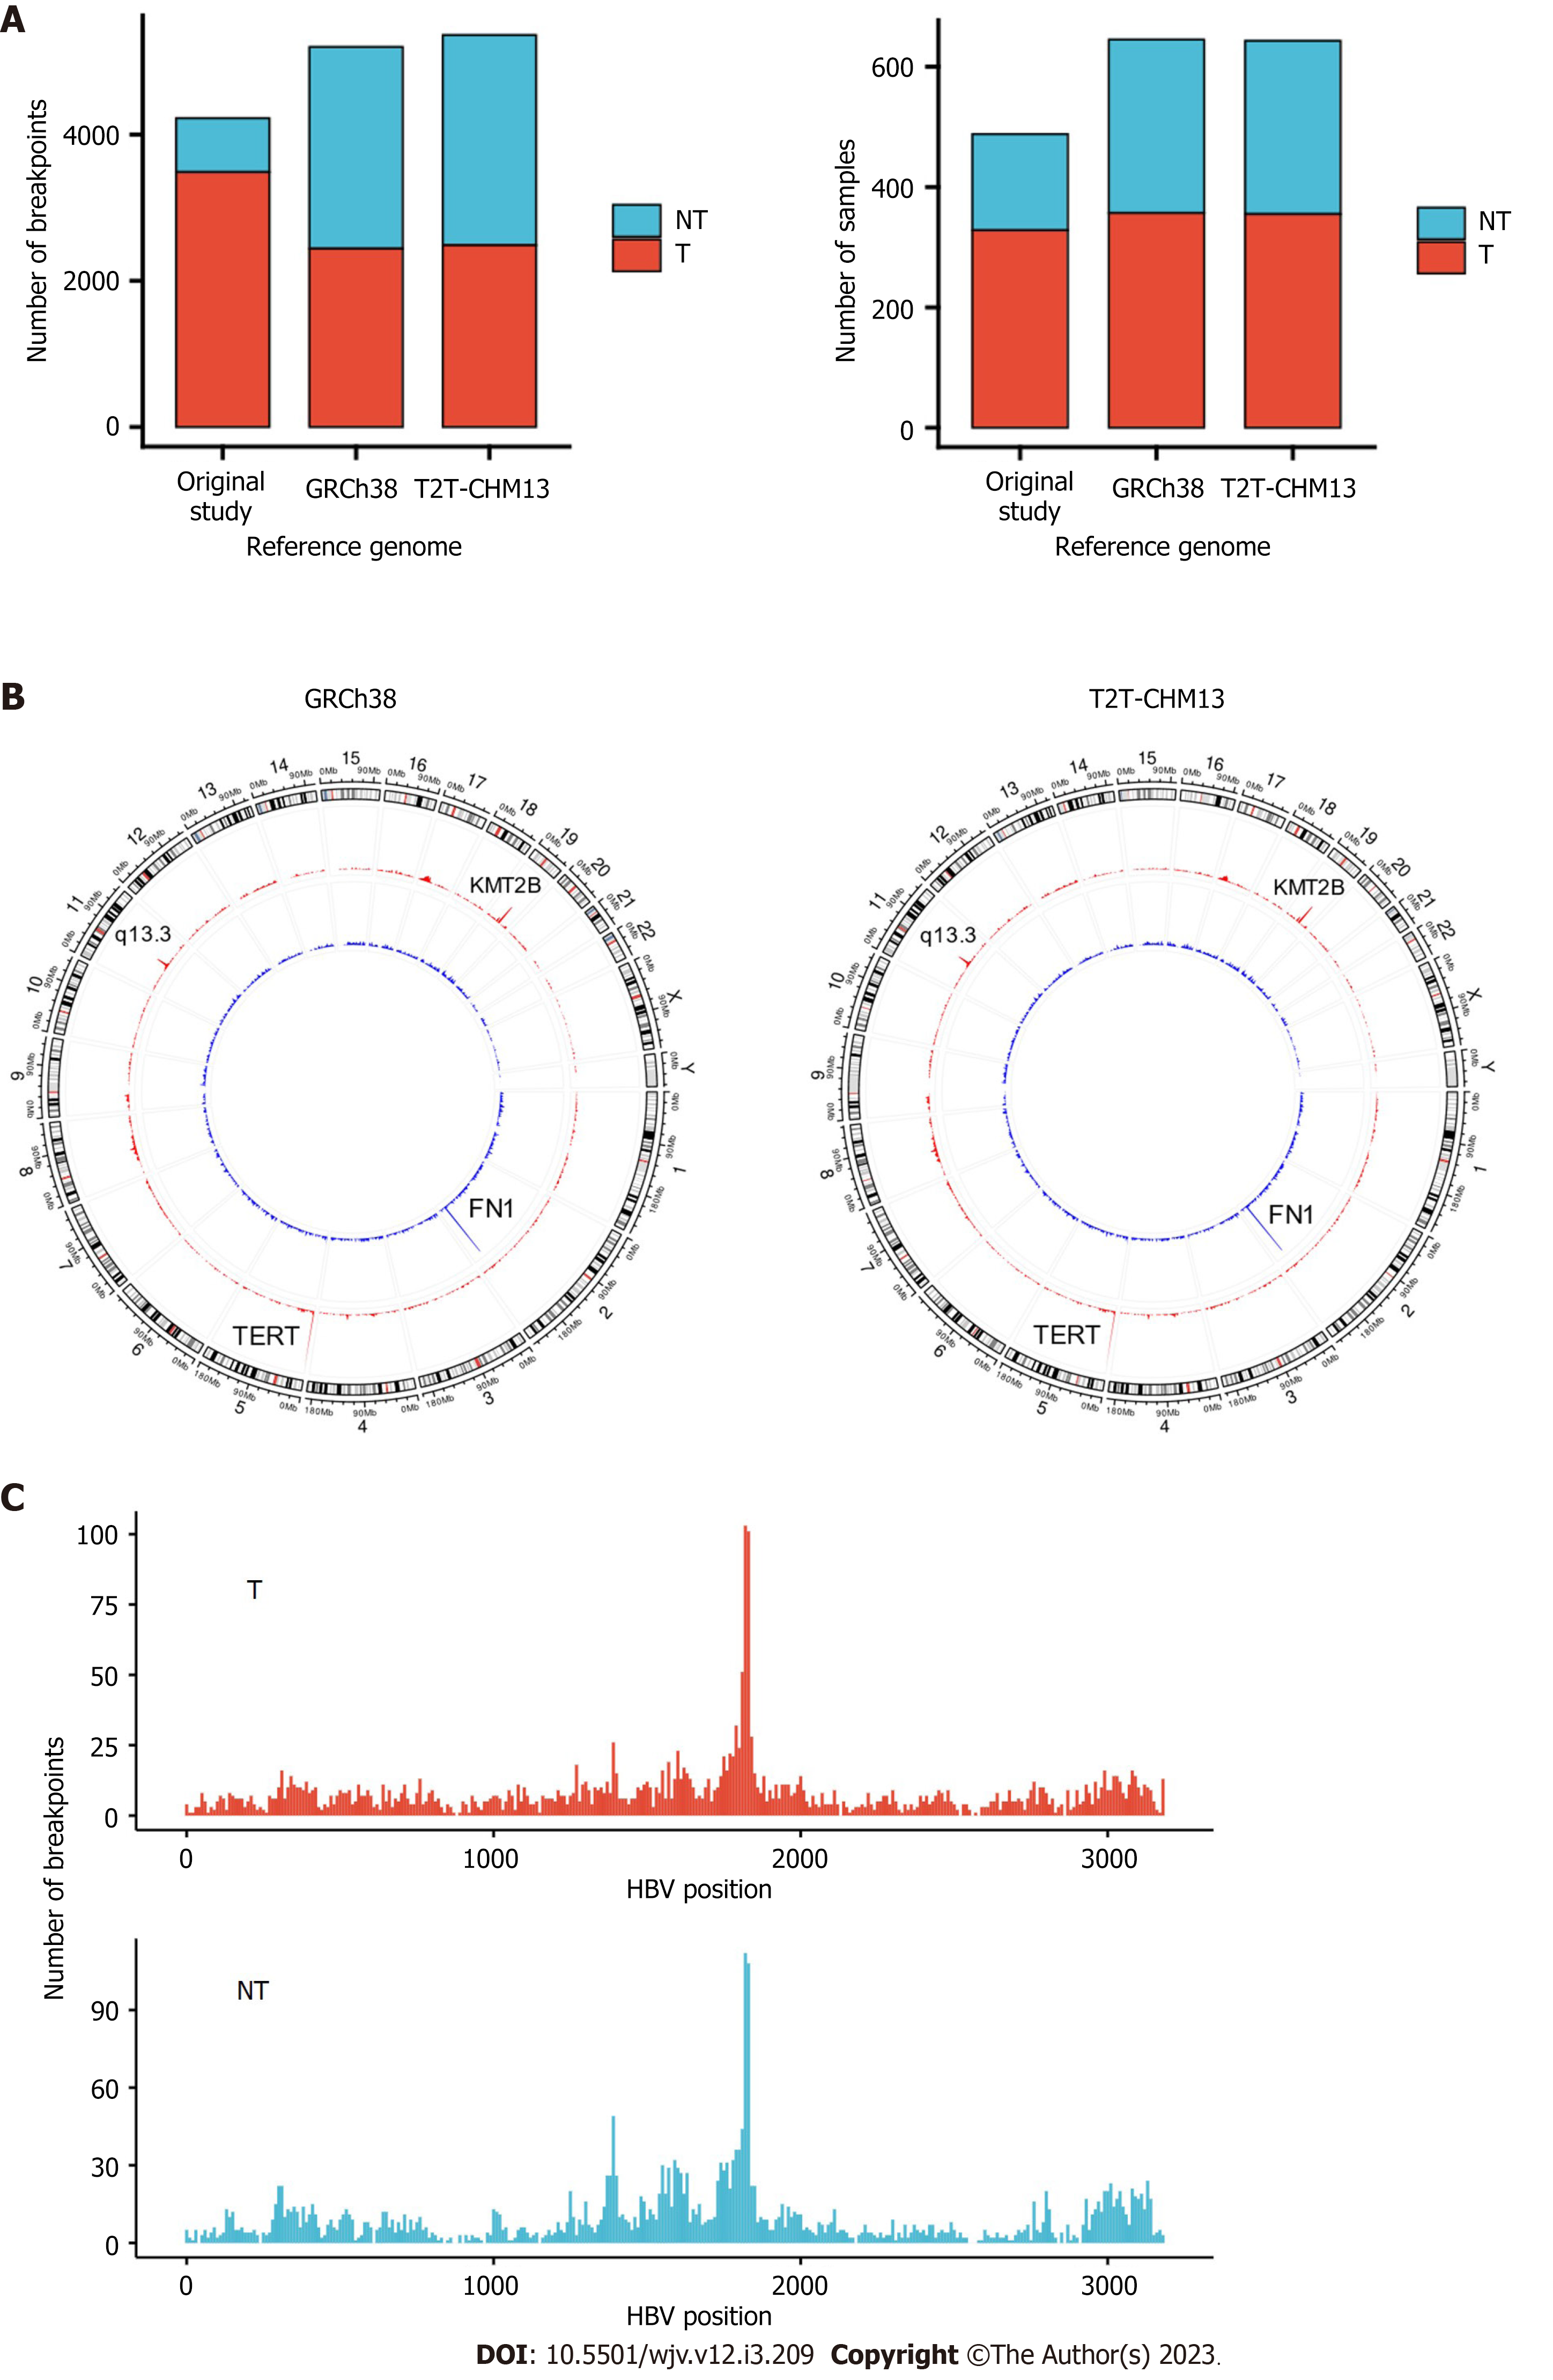
Figure 1 Hepatitis B virus integration breakpoints across the reference genomes.
A: Integration breakpoints in the human reference genomes in tumor and non-tumor samples; B: Circos plot of integration breakpoints. Red represents tumor samples, and blue represents non-tumor samples; C: Hepatitis B virus genome integration breakpoints. T: Tumor; N: Non-tumor.
Figure 2 Integration breakpoints at chromosome 11.
A: Circos plot of breakpoints at chromosome 11 in the human reference genomes; B: Integration breakpoints around 11q13.3 in relation to coding genes retrieved from Ensembl. Red represents tumor samples, and blue represents non-tumor samples; C: Comparison of integration breakpoints around 11q13.3 in the tumor samples. Actual represents actual number of integration breakpoints. Expected represents expected number of integration breakpoints assuming random distribution; D: Copy number of liver cancer samples from cBioPortal[18,19]. Red represents amplification, and blue represents deletion. E: Distribution of the number of fragments that provide breakend for the variant allele. T: Tumor; NT: Non-tumor.
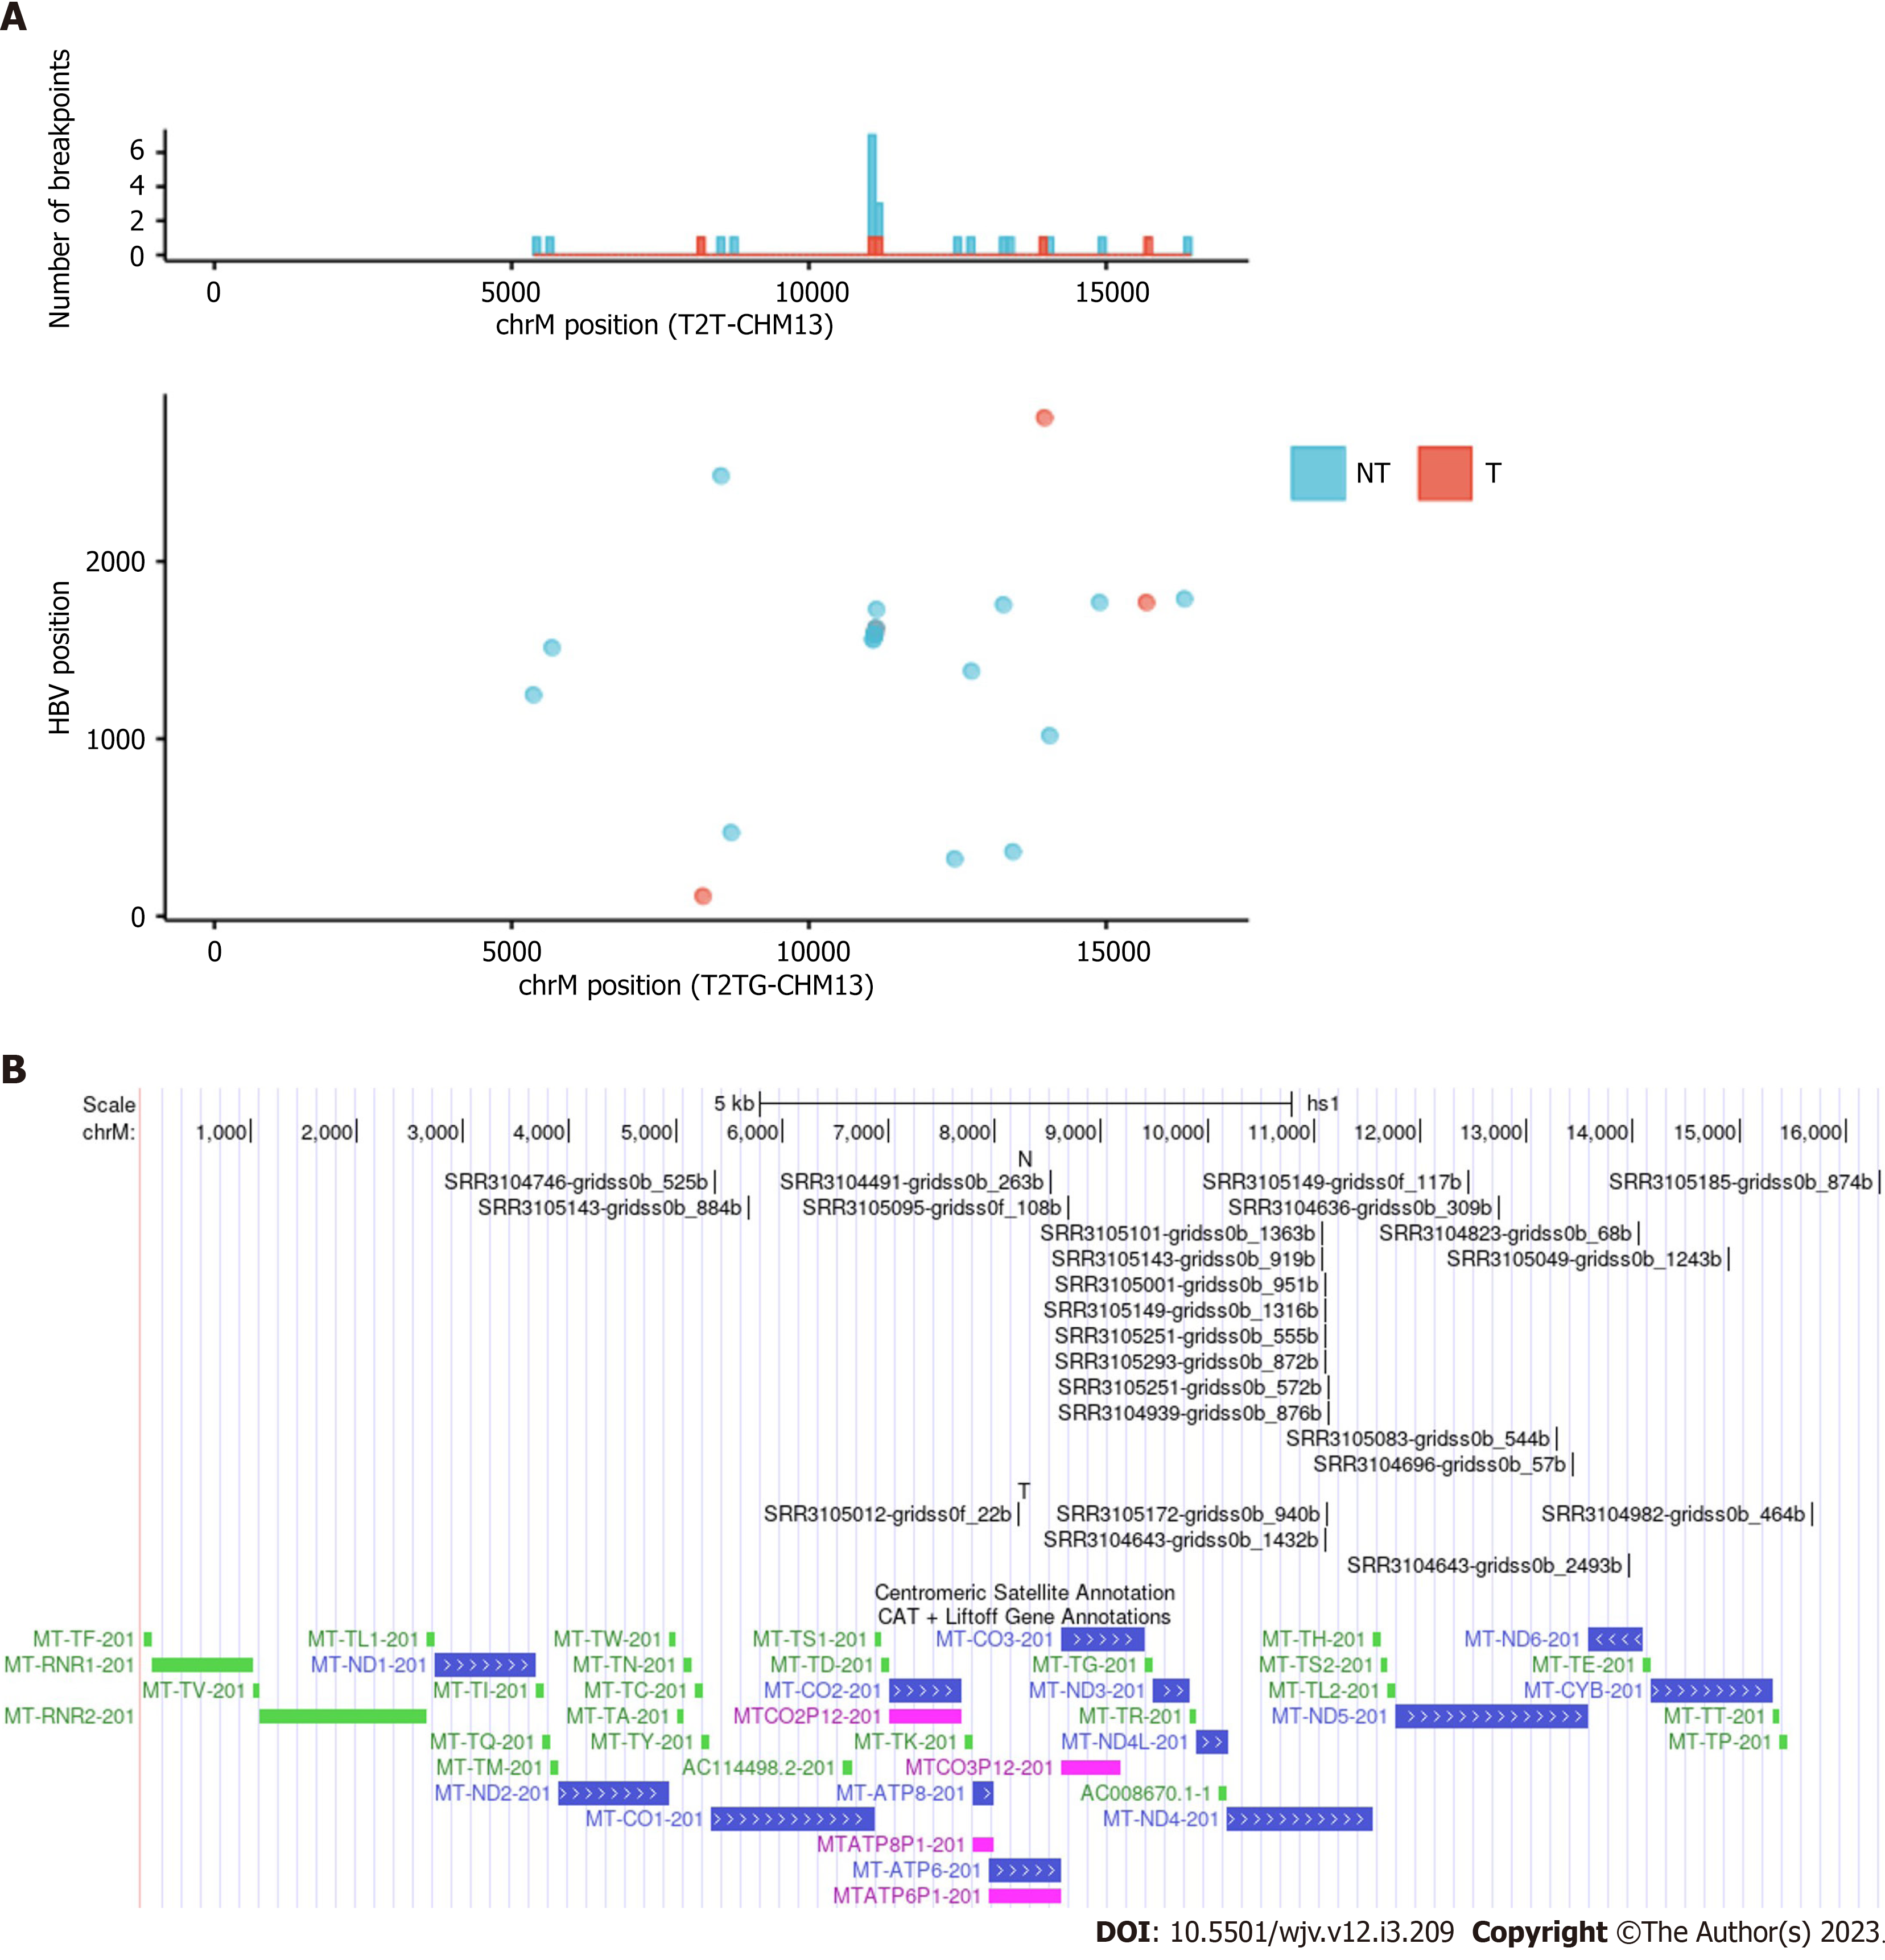
Figure 3 Integration breakpoints in the mitochondrial genome.
A: The upper panel displays integration breakpoints across mitochondrial genomes according to tumor and non-tumor samples, and the lower panel shows integration breakpoints along the human and hepatitis B virus genomes. Red represents tumor samples, and blue represents non-tumor samples; B: Integration breakpoints on the mitochondrial genome annotated using UCSC genome browser (NT: Non-tumor; T: Tumor)[22].
- Citation: Kojima R, Nakamoto S, Kogure T, Ma Y, Ogawa K, Iwanaga T, Qiang N, Ao J, Nakagawa R, Muroyama R, Nakamura M, Chiba T, Kato J, Kato N. Re-analysis of hepatitis B virus integration sites reveals potential new loci associated with oncogenesis in hepatocellular carcinoma. World J Virol 2023; 12(3): 209-220
- URL: https://www.wjgnet.com/2220-3249/full/v12/i3/209.htm
- DOI: https://dx.doi.org/10.5501/wjv.v12.i3.209


