Copyright
©The Author(s) 2023.
World J Virol. Mar 25, 2023; 12(2): 122-131
Published online Mar 25, 2023. doi: 10.5501/wjv.v12.i2.122
Published online Mar 25, 2023. doi: 10.5501/wjv.v12.i2.122
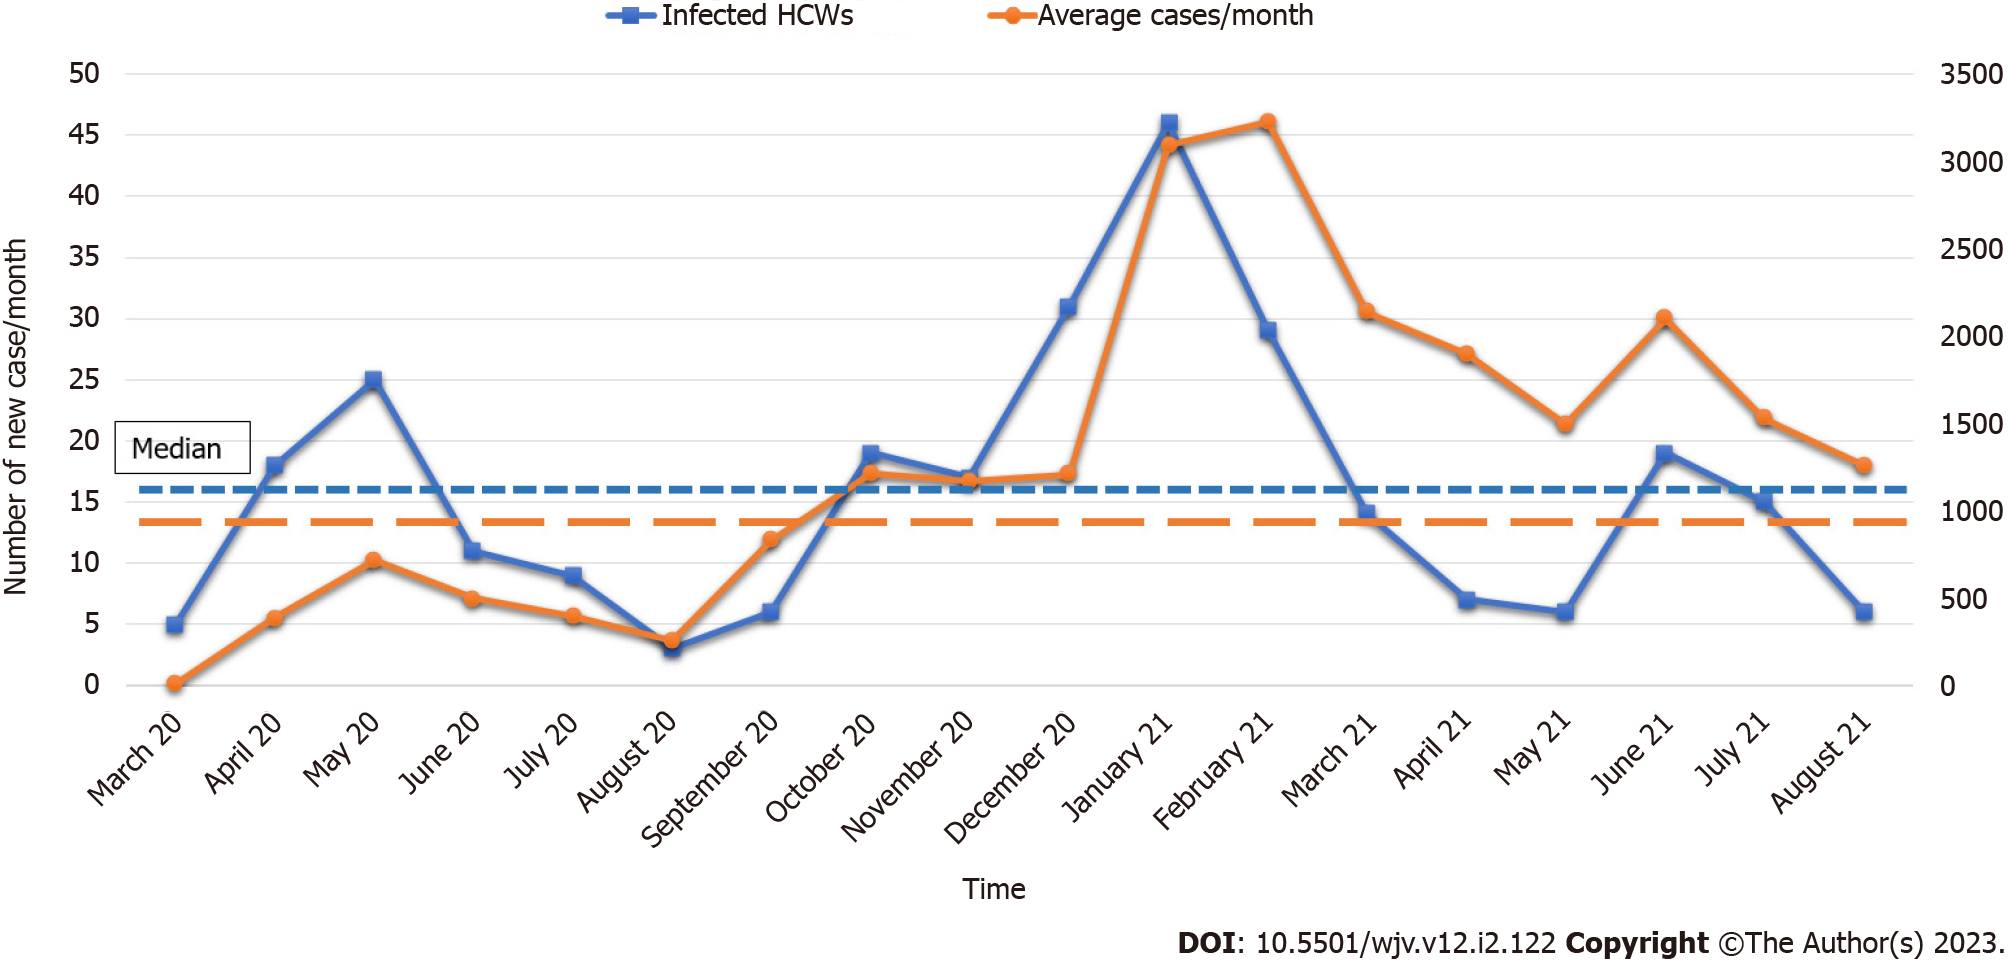
Figure 1 Trend-chart showing the month-wise distribution of infected healthcare workers and new cases in the community.
Infected healthcare workers (HCWs) are displayed in absolute numbers per month (orange color) and average cases of severe acute respiratory syndrome coronavirus 2 cases in the community (blue color). Median cases per month are displayed through dashed lines. There are three peaks observed in trend-line. The peaks coincided in the trend charts, representing an increased rate of infection among HCWs with high community transmission. HCWs: Healthcare workers.
- Citation: Nasa P, Modi P, Setubal G, Puspha A, Upadhyay S, Talal SH. Demographic and risk characteristics of healthcare workers infected with SARS-CoV-2 from two tertiary care hospitals in the United Arab Emirates. World J Virol 2023; 12(2): 122-131
- URL: https://www.wjgnet.com/2220-3249/full/v12/i2/122.htm
- DOI: https://dx.doi.org/10.5501/wjv.v12.i2.122


