Copyright
©2012 Baishideng.
World J Virol. Aug 12, 2012; 1(4): 115-130
Published online Aug 12, 2012. doi: 10.5501/wjv.v1.i4.115
Published online Aug 12, 2012. doi: 10.5501/wjv.v1.i4.115
Figure 1 Diagrams representing Akt signaling alterations in adult T-cell leukemia/lymphoma cells under treatment with heat shock protein 90 inhibitors (A) and Tax contribution on Akt signaling (B).
A: In adult T-cell leukemia/lymphoma (ATLL) cells, geldanamycin-derivates inhibition of heat shock protein 90 (Hsp-90) promotes Akt inactivation and hence GSK3 activation for β-catenin degradation, and cell death; B: Activation of Jak/Stat or T cell receptor signaling or Tax expression promote phosphatidylinositol-3-kinase (PI3K) activation, Akt activation and Mdm2 activation with subsequent inactivation of Bad and degradation of forkhead box O-4 (FoxO-4) and p53. Question marks represent hypothesis; P: Phosphorylation; Ub: Ubiquitin; black thin arrows represent activation, grey thin arrows represent enzymatic reactions; dashed arrow, inhibition; protein overexpression in infected cells is represented by thick arrow.
Figure 2 Cell cycle deregulation in infected cells and Tax-expressing cells.
G1 progression begins with cyclin D expression, formation of the Cdk4/cyclin D complex that in turn phosphorylates retinoblastoma protein (Rb), inducting E2F1 transcription. Cyclin D is upregulated by Tax and by Ras-Raf-ERK stimulation. It is stabilized by interaction with Pin1, overexpressed in infected cells. G1/S phase transition, promoted by the Cdk2/cylclin E complex is antagonized by p30 and by overexpressed p27/Kip1. Overexpressed p21/Waf1 inhibits Cdk2/cyclin A-promoted S/G2 transition. In turn, overactivation of Akt inhibits p27/Kip1 and p21/Waf1 functions. Tax promotes, through cdc20-associated anaphase promoting complex (Cdc20-APC) activation, cyclin B degradation. At the same level acts p30, that activates Cdk1 by Cdc25-dependent de-phosphorylation. Cyclic stability of Cdk/cyclin complexes are represented with fading arcs; P: Phosphorylation; Ub: Ubiquitin; black thin arrows represent activation, grey thin arrows represent enzymatic reactions; protein overexpression in infected cells is represented by thick straight arrows.
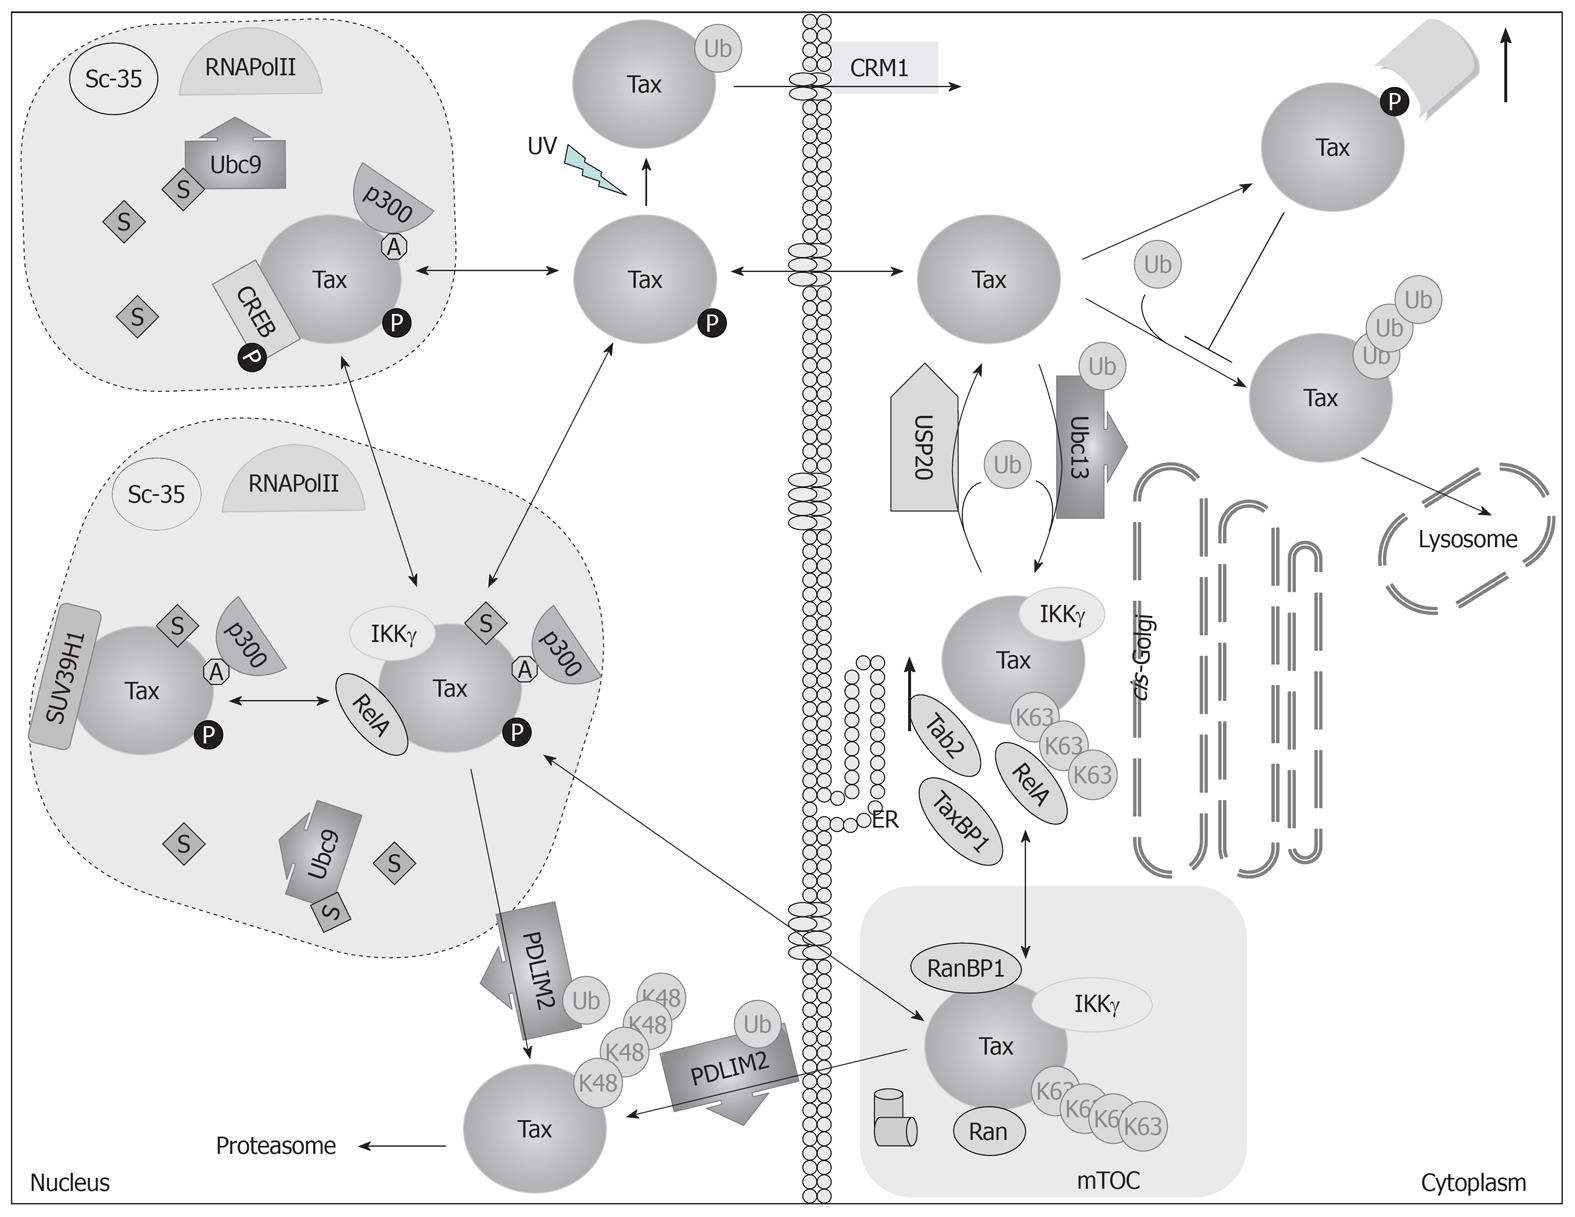
Figure 3 Diagram representing Tax localization and function controlled by protein post-translational modifications.
After translation, Tax could be phosphorylated at Ser-160 and hence stabilized by Pin1, preventing its poly-ubiquitination with subsequent lysosomal degradation (top right). Tax is K-63 poly-ubiquitinated by Ubc13, promoting its relocation to a region between endoplasmic reticulum (ER) and cis-Golgi, where it interacts with I-κB kinase (IKK)γ, the overexpressed Tab2 and RelA. UPS20 can de-ubiquitinate Tax (centre). From cis-Golgi, Tax shuttles to MTOC, where it interacts with IKKγ, RanBP1 and Ran. From MTOC, Tax shuttles to Tax-related nuclear bodies containing Sc-35 and RNAPolII. There, it is acetylated by p300 and SUMOylated, probably by Ubc9 (left). In nuclear bodies, Tax interacts with p300, IKKγ, RelA and the methyltransferase SUV39H1. Furthermore, Tax interacts also with phosphorylated cyclic AMP response element binding protein (CREB). PDLIM2 has proven to cause K48 poly-ubiquitination of Tax, promoting its nuclear proteosomal degradation after translocation from nuclear bodies and MTOC (bottom left). Tax displays its nuclear functions when Ser-300 or Ser-301 are phosphorylated (nucleus). After UV treatment, mono-ubiquitinated Tax is exported to the cytoplasm through CRM1 (top). Thin arrows represent relocation or modification; P: Phosphorylation; S: SUMO1; A: Acetylation; Ub: Ubiquitin; K48 or K63: Chains of ubiquitin; UV: Ultraviolet light exposure; protein overexpression in infected cells is represented by thick arrows.
- Citation: Bidoia C. Human T-lymphotropic virus proteins and post-translational modification pathways. World J Virol 2012; 1(4): 115-130
- URL: https://www.wjgnet.com/2220-3249/full/v1/i4/115.htm
- DOI: https://dx.doi.org/10.5501/wjv.v1.i4.115


