Copyright
©The Author(s) 2018.
World J Transplantation. Sep 10, 2018; 8(5): 188-197
Published online Sep 10, 2018. doi: 10.5500/wjt.v8.i5.188
Published online Sep 10, 2018. doi: 10.5500/wjt.v8.i5.188
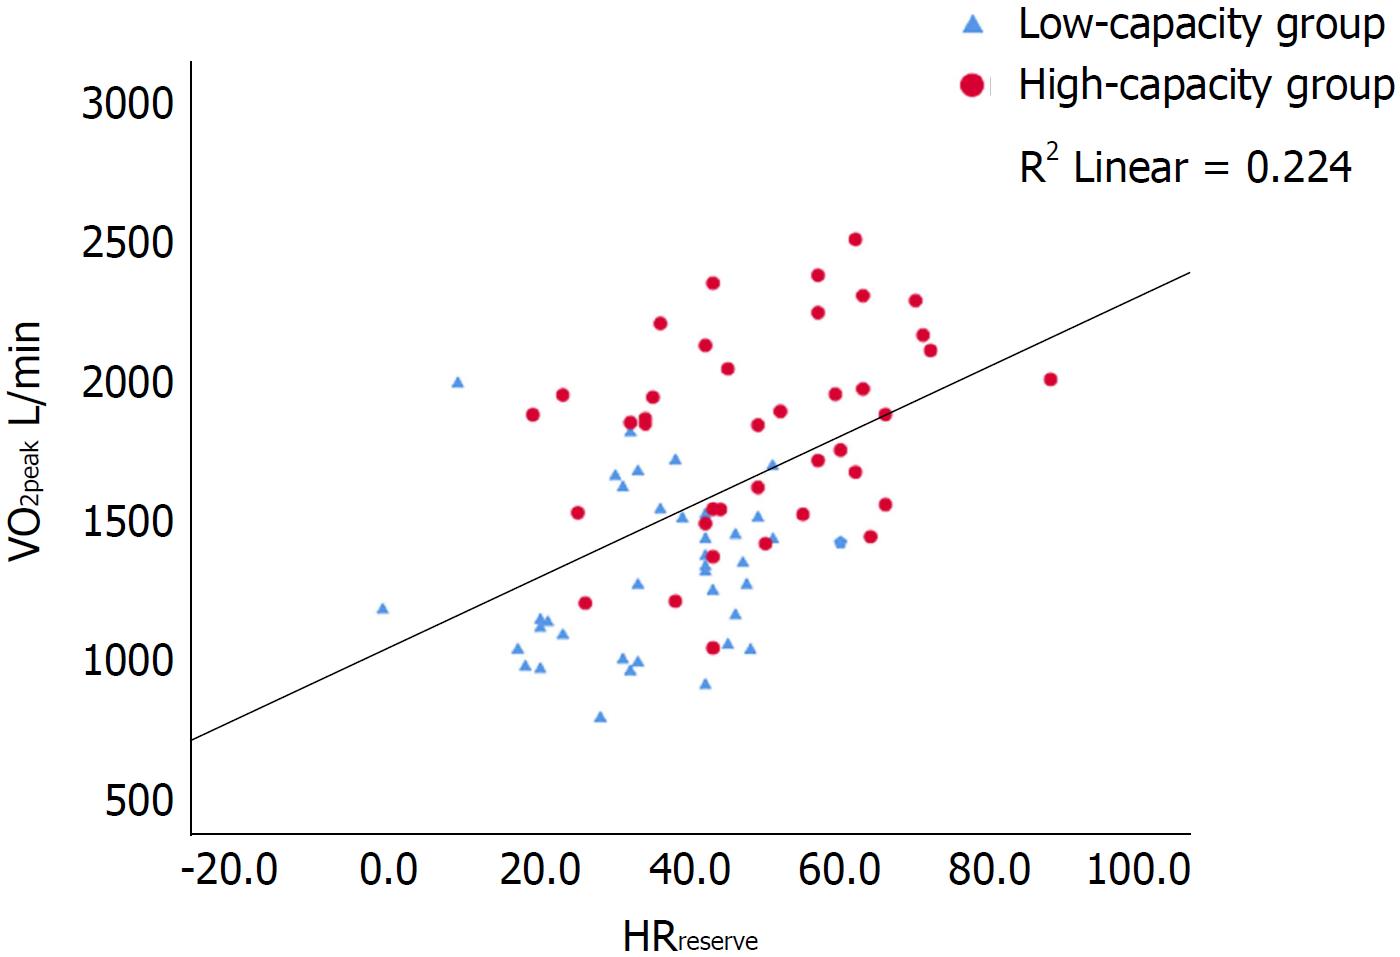
Figure 1 Scatterplot of the correlation between peak oxygen consumption (L/min) and heart rate reserve with inserted regression line.
R2 = 0.224. Pearsons r 0.473, P < 0.001. VO2peak: Peak oxygen consumption; HRreserve: Heart rate reserve.
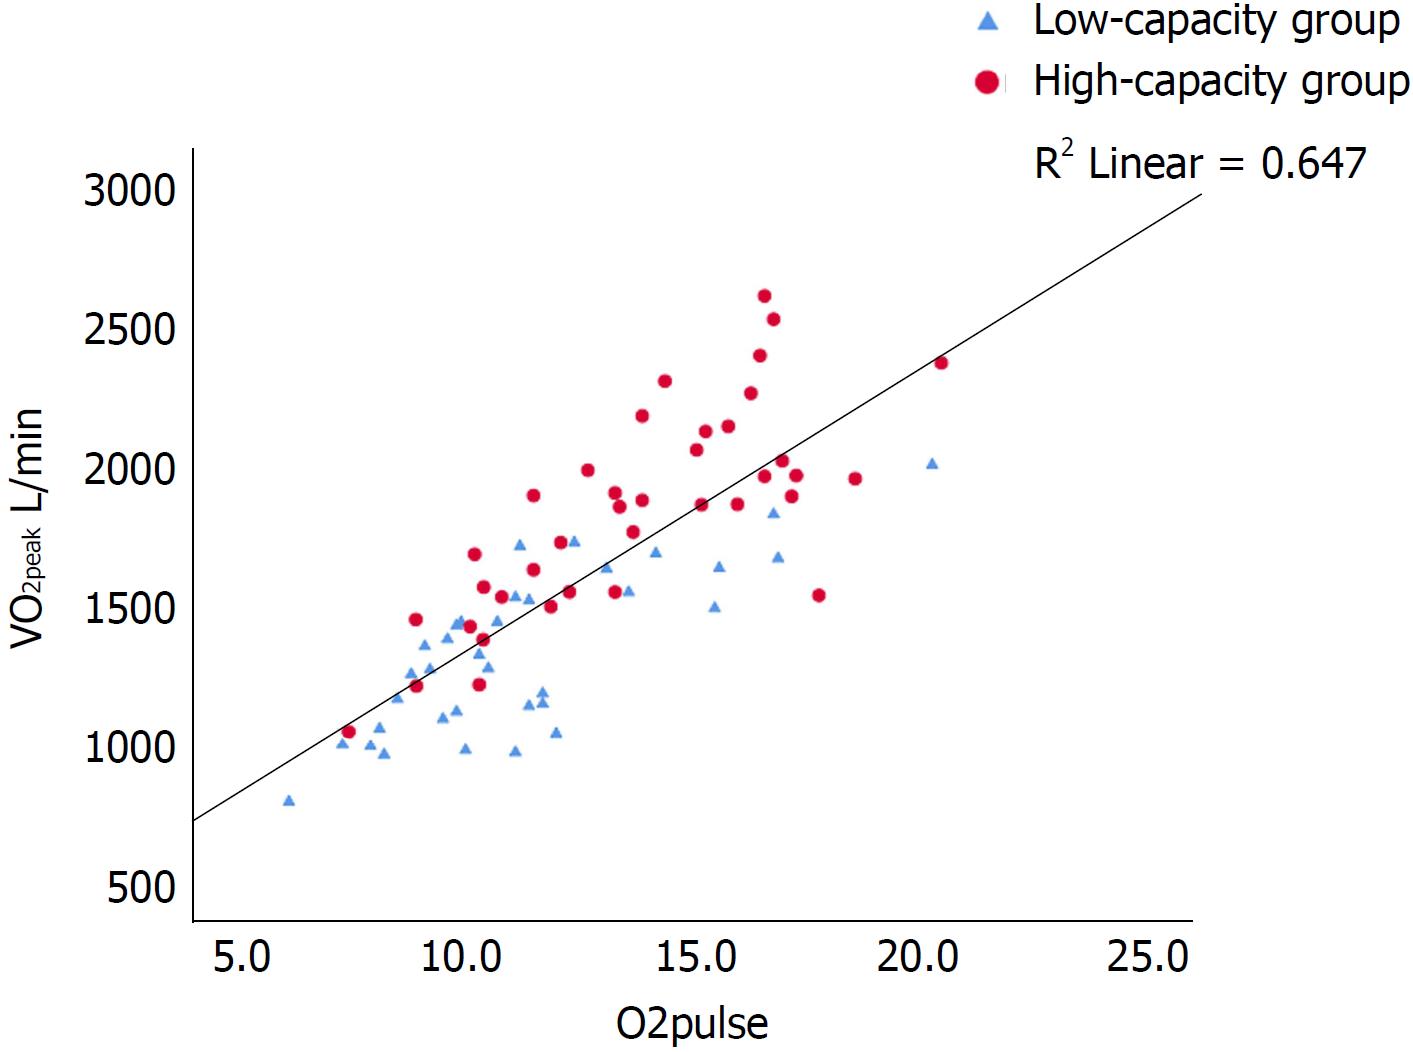
Figure 2 Scatterplot of the correlation between peak oxygen consumption (L/min) and O2 pulse with inserted regression line.
R2 = 0.647. Pearsons r 0.804, P < 0.001. VO2peak: Peak oxygen consumption.
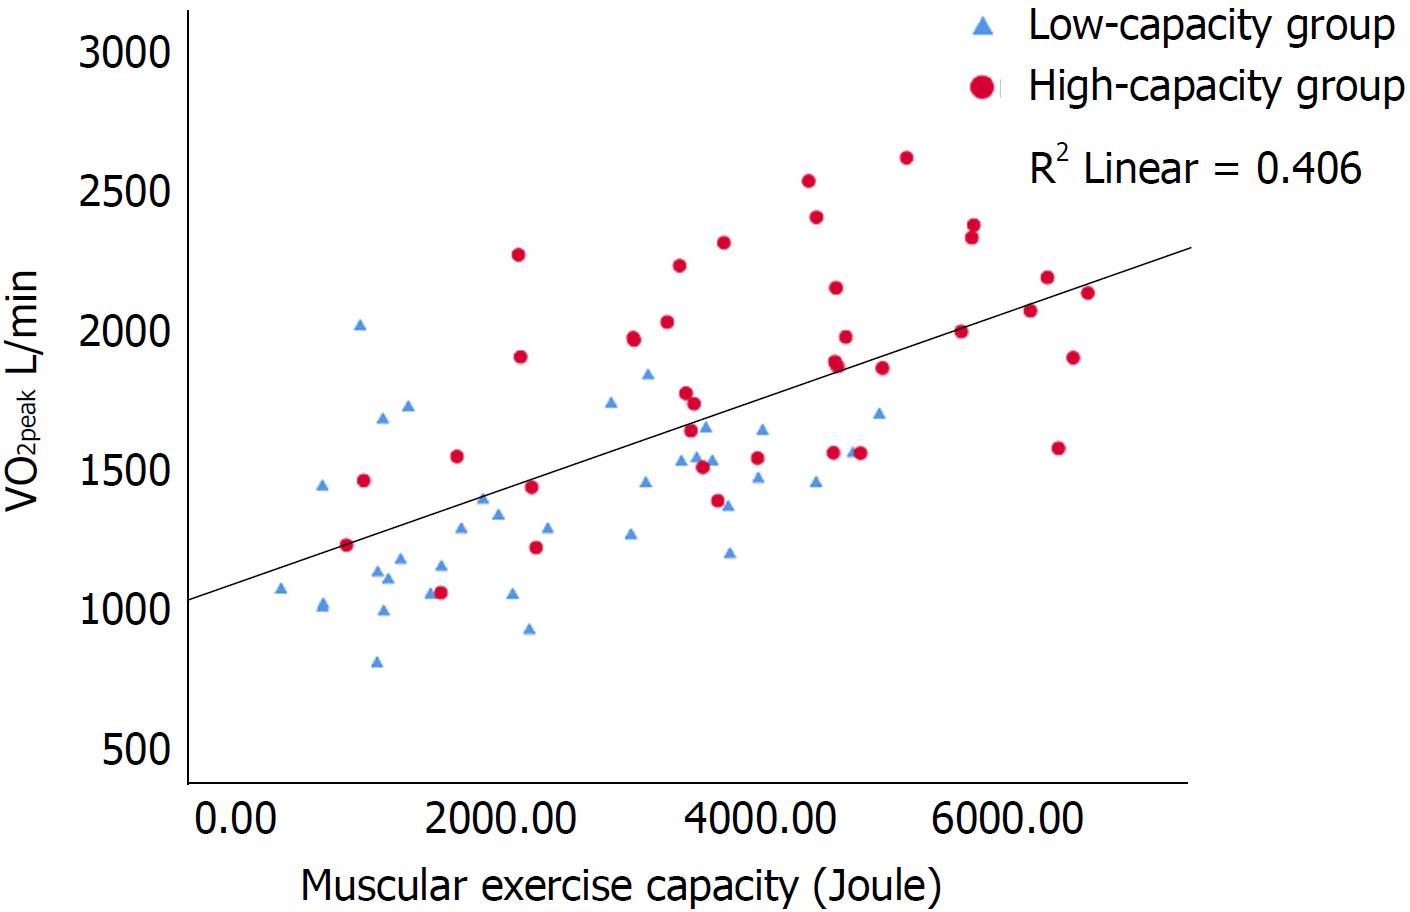
Figure 3 Scatterplot of the correlation between peak oxygen consumption (L/min) and muscular exercise capacity (Joule) with inserted regression line.
R2 = 0.406. Pearsons r 0.637, P < 0.001. VO2peak: Peak oxygen consumption.
- Citation: Rolid K, Andreassen AK, Yardley M, Bjørkelund E, Karason K, Wigh JP, Dall CH, Gustafsson F, Gullestad L, Nytrøen K. Clinical features and determinants of VO2peak in de novo heart transplant recipients. World J Transplantation 2018; 8(5): 188-197
- URL: https://www.wjgnet.com/2220-3230/full/v8/i5/188.htm
- DOI: https://dx.doi.org/10.5500/wjt.v8.i5.188


