Copyright
©The Author(s) 2018.
World J Transplant. Feb 24, 2018; 8(1): 1-12
Published online Feb 24, 2018. doi: 10.5500/wjt.v8.i1.1
Published online Feb 24, 2018. doi: 10.5500/wjt.v8.i1.1
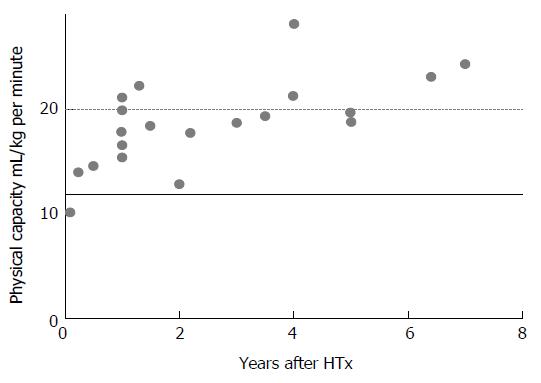
Figure 1 Physical capacity, as assessed by VO2peak after heart transplantation from published studies, illustrated by years after surgery.
Black line at 12 mL/kg per minute, show the threshold to be candidates for HTx, dotted line at 20 mL/min per kilogram, show the start of Weber function class A, representing good physical condition. The measurements are carried out from exercise tests from; Bernandi et al[85], Carter et al[86], Dall et al[35], Ewert et al[87], Givertz et al[88], Gullestad et al[89], Habedank et al[90], Haykowski et al[91], Hermann et al[36], Hognestad et al[92], Karpolat et al[93], Kavanagh et al[94], Kemp et al[95], Kobashigawa et al[96], Nytrøen et al[37], Osada et al[5], Renlund et al[97], Schwaiblmair et al[98], Squires et al[99], Tegtbur et al[100], Wu et al[77]. HTx: Heart transplantation.
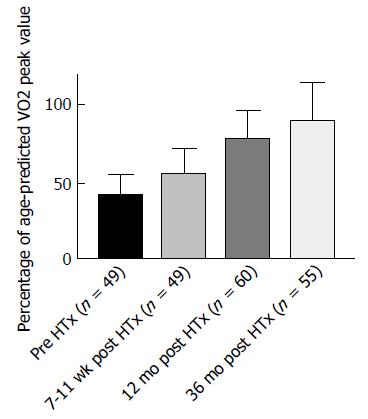
Figure 2 Illustration of the increase in peak VO2 from pre heart transplantation to 36 mo post heart transplantation.
The data presented in the figure is from the unpublished Schedule trial.
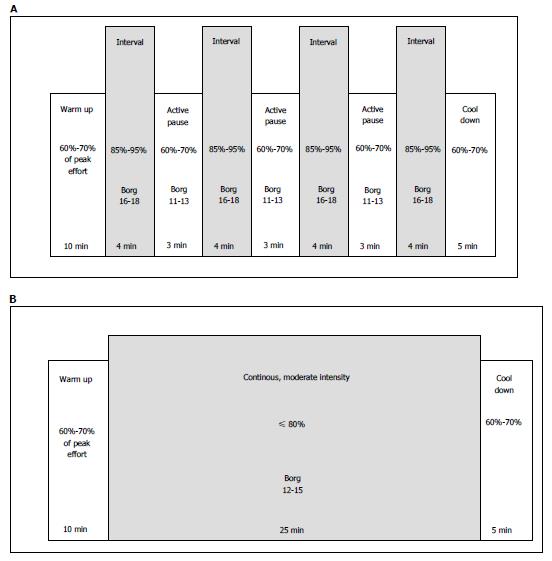
Figure 3 Illustration of two different exercise modalities.
A: Illustration of a session with high-intensity interval training (HIT). HIT is an exercise strategy with alternating short periods of intense endurance exercise with less-intense recovery periods. A usual HIT session may include 4 × 4 min periods with high intensity (85%-95% of maximal capacity), with active recovery periods of 3min between each interval (with 60%-70% of maximal capacity); B: Illustration of a session with moderate intensity continuous training (MICT). MICT is an exercise strategy with moderate intensity (60%-70% of maximal capacity) of endurance exercise in periods for usually 25-30 min, with no recovery periods.
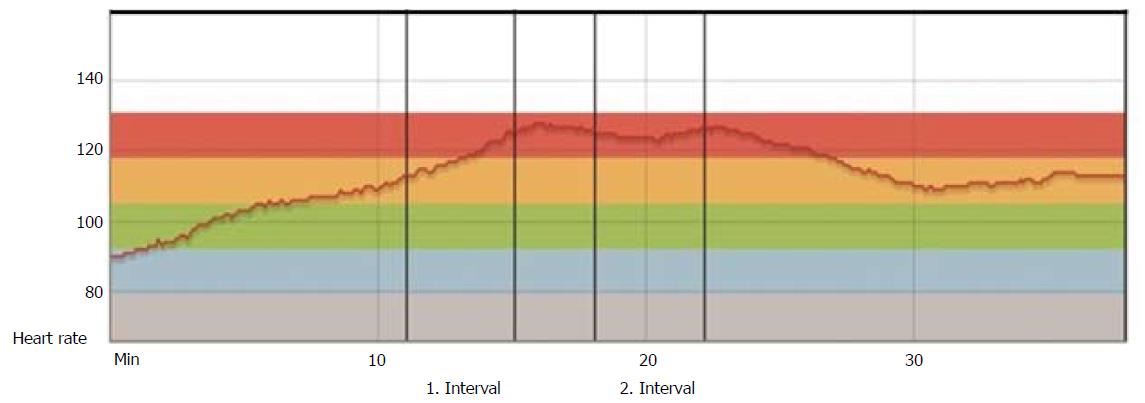
Figure 4 Heart rate during exercise 3 mo post heart transplantation.
Patient from our hospital, 3 mo post-HTx: HR curve during warm-up, two high-intensity intervals divided by one recovery period and cool-down. The curve shows a typical pattern of impaired HR responses in the early stage after HTx. HTx: Heart transplantation.
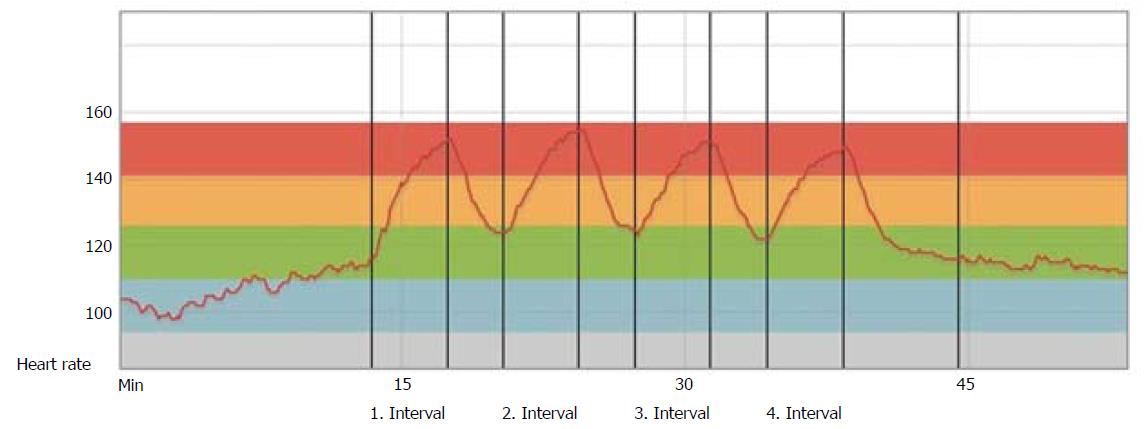
Figure 5 Heart rate during exercise 12 mo post heart transplantation.
The same patient 12 mo post-HTx: Heart rate curve during warm-up four high-intensity intervals divided by 3 recovery periods and cool-down. The curve shows a largely normalized HR, with immediate HR adaptions to exercise intensity. HTx: Heart transplantation.
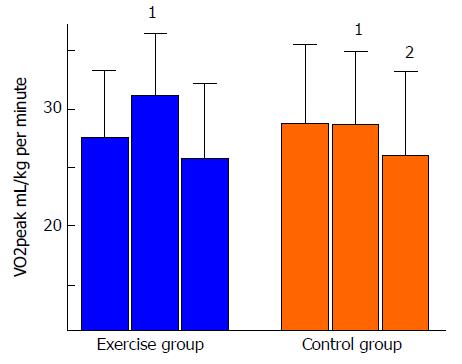
Figure 6 Measurements of VO2peak at baseline, 1-year and 5-year follow-up.
1Significant changes between groups; 2Significant changes from baseline to 5-year follow-up within group.
- Citation: Yardley M, Gullestad L, Nytrøen K. Importance of physical capacity and the effects of exercise in heart transplant recipients. World J Transplant 2018; 8(1): 1-12
- URL: https://www.wjgnet.com/2220-3230/full/v8/i1/1.htm
- DOI: https://dx.doi.org/10.5500/wjt.v8.i1.1


