Copyright
©The Author(s) 2017.
World J Transplant. Aug 24, 2017; 7(4): 222-234
Published online Aug 24, 2017. doi: 10.5500/wjt.v7.i4.222
Published online Aug 24, 2017. doi: 10.5500/wjt.v7.i4.222
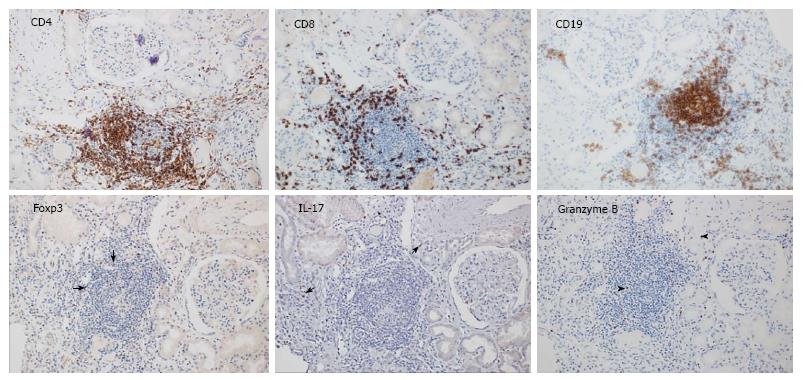
Figure 1 Representative T cell subsets infiltrating a kidney transplant undergoing acute T cell-mediated rejection using antibodies to CD4, CD8, CD19, Foxp3, IL-17 and granzyme B as labeled on the pictures (the arrows indicate positive cells).
All pictures derived from the same region cut at consecutive levels (immunohistochemistry staining, magnification × 200).
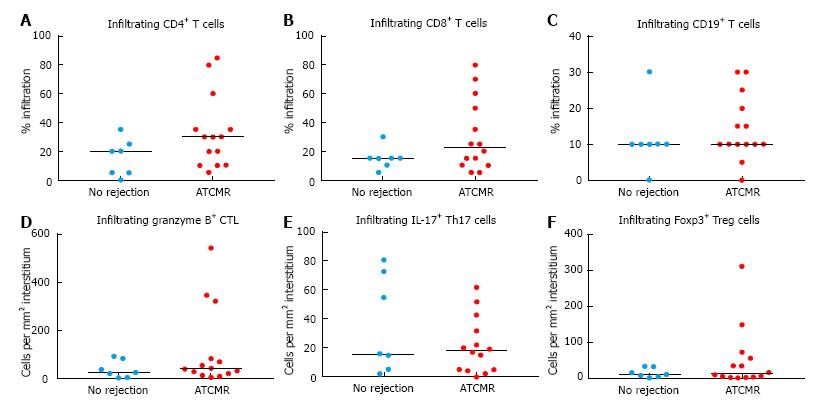
Figure 2 T cell subsets infiltrating kidney tissue, including %CD4+ cells (A), %CD8+ cells (B), %CD19+ cells (C), granzyme B+ cells/mm2 (D), IL-17+ cells/mm2 (E) and Foxp3+ cells/mm2 (F) (all detected by immunohistochemistry) are compared between patients with acute T cell-mediated rejection in the kidney transplant (n = 14) and patients with no rejection (n = 7).
The horizontal lines indicate the median values. Wilcoxon rank-sum test P values for all comparisons were statistically non-significant. ATCMR: Acute T cell-mediated rejection; CTL: Cytotoxic T lymphocyte.
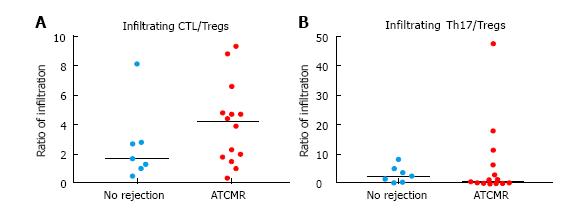
Figure 3 The ratios of (A) infiltrating granzyme B+ cells (CTL) over Foxp3+ cells (Tregs) and of (B) of infiltrating IL-17+ cells (Th17) over Foxp3+ cells (Tregs) are compared between patients with acute T cell-mediated rejection in the kidney transplant (n = 14) and patients with no rejection (n = 7).
All cell types were detected by immunohistochemistry. The horizontal lines indicate the median values. Wilcoxon rank-sum test p values for both comparisons were statistically non-significant. ATCMR: Acute T cell-mediated rejection; CTL: Cytotoxic T lymphocyte.
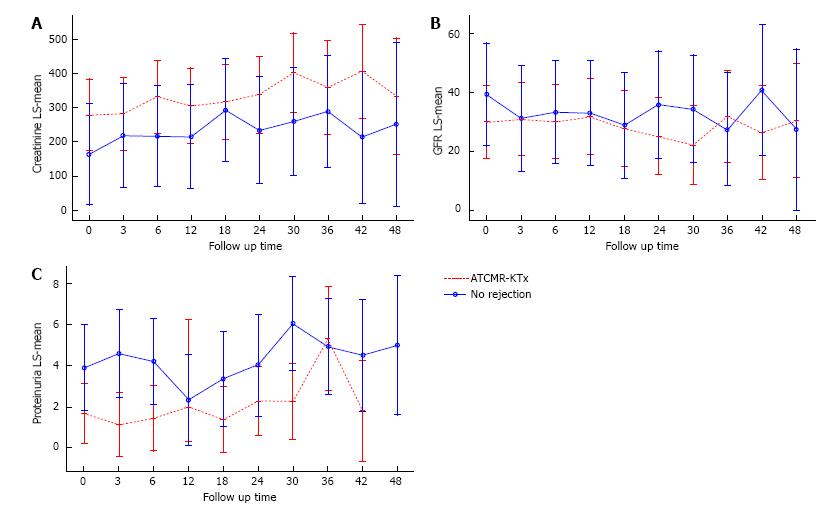
Figure 4 Longitudinal analysis comparing the dynamic changes in serum creatinine (A), glomerular filtration rate (B) and proteinuria (C) throughout the follow up period in the acute T cell-mediated rejection in the kidney transplant (red non-continuous line) and non-rejection (blue continuous line) groups.
The comparisons between overall mean values and mean values at follow-up times were statistically non- significant. Upper and lower limits for 95%CIs at the different time points are indicated. ATCMR-KTx: Acute T cell-mediated rejection in the kidney transplant; GFR: Glomerular filtration rate.
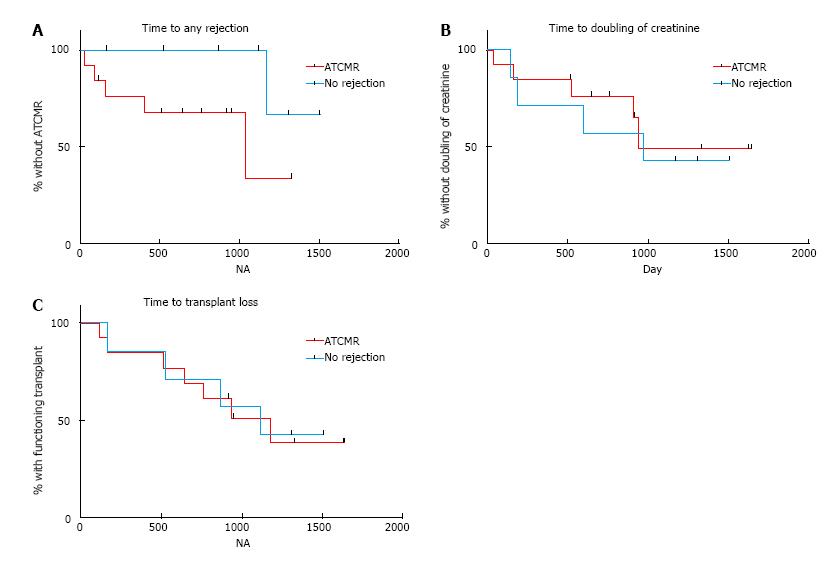
Figure 5 Time-to-event plots of (A) time to any rejection (borderline, acute T cell-mediated rejection in the kidney transplant or antibody-mediated rejection) post-biopsy, of (B) time to doubling of creatinine post-biopsy, and of (C) time to confirmed or suspected immune-mediated transplant loss in patients with acute T cell-mediated rejection in the kidney transplant (n = 14) and patients with no rejection (n = 7).
Log-rank test P values for all the comparisons were statistically not significant. ATCMR: Acute T cell-mediated rejection.
- Citation: Salcido-Ochoa F, Hue SSS, Peng S, Fan Z, Li RL, Iqbal J, Allen Jr JC, Loh AHL. Histopathological analysis of infiltrating T cell subsets in acute T cell-mediated rejection in the kidney transplant. World J Transplant 2017; 7(4): 222-234
- URL: https://www.wjgnet.com/2220-3230/full/v7/i4/222.htm
- DOI: https://dx.doi.org/10.5500/wjt.v7.i4.222


