Copyright
©The Author(s) 2017.
World J Transplant. Feb 24, 2017; 7(1): 70-80
Published online Feb 24, 2017. doi: 10.5500/wjt.v7.i1.70
Published online Feb 24, 2017. doi: 10.5500/wjt.v7.i1.70
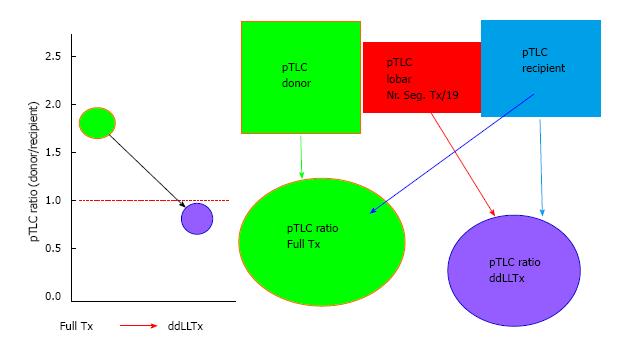
Figure 1 The parameter(s) used for the size matching were extracted for each study.
For all studies that did not report recipient pTLC (pTLCrecipient), full donor pTLC (pTLCdonorFull) and donor pTLC after lobar resection (pTLCdonorLobar) the study authors were contacted and asked to provide: Recipient age, height and sex (to calculate pTLCrecipient); donor age, height and sex (to calculate pTLCdonorFull) and information on donor lobes transplanted [to calculate pTLCdonorLobar = (pTLCdonorFull) × (number donor lung segments transplanted/19)] for each donor and recipient pair. From this the pTLCratio that would have occurred using the entire donor lungs was calculated as pTLCratioFull = pTLCdonorFull/pTLCrecipient. The pTLC ratio that was actually transplanted via the lobar transplantation was calculated as pTLCratioLobar = pTLCdonorLobar/pTLCrecipient. ddLLTx: Deceased-donor-lobar lung transplantation.
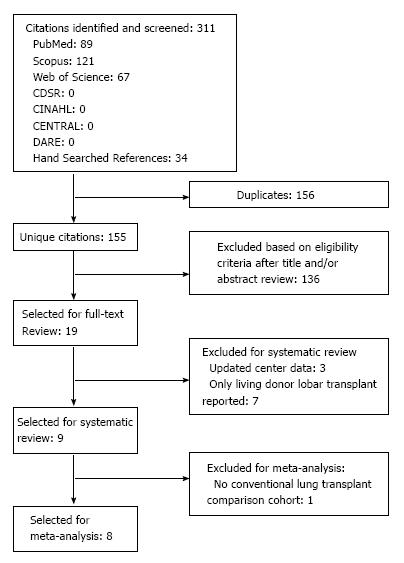
Figure 2 PRISMA diagram detailing study selection.
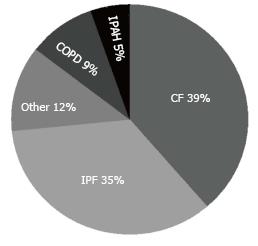
Figure 3 Pie chart of transplant indications.
IPAH: Idiopathic pulmonary arterial hypertension; COPD: Chronic obstructive pulmonary disease; IPF: Idiopathic pulmonary fibrosis; CF: Cystic fibrosis.
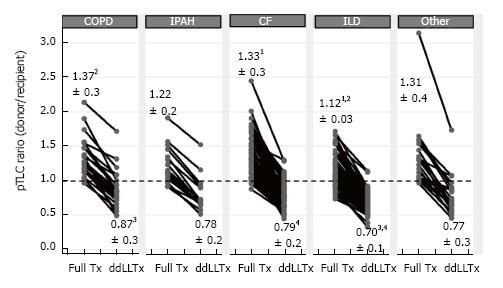
Figure 4 Donor to recipient size matching based on the donor to recipient predicted total lung capacity ratio, stratified by transplant indication.
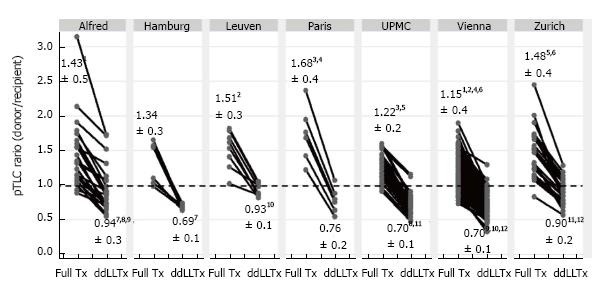
The predicted total lung capacity (pTLC) ratio that would have occurred using the entire donor lungs was calculated as pTLCratioFull = pTLCdonorFull/pTLCrecipient. The pTLC ratio that was actually transplanted via the lobar transplantation was calculated as pTLCratioLobar = pTLCdonorLobar/pTLCrecipient, where pTLCdonorLobar = [pTLCdonorFull] × [number donor lung segments transplanted/19]. Each grey circle pair connected with black line represents one donor/recipient pair. The numbers represent the mean pTLCratio ± standard deviation. CF: Cystic fibrosis; IPF: Idiopathic pulmonary fibrosis; IPAH: Idiopathic pulmonary arterial hypertension; OB: Obliterative bronchiolitis; COPD: Chronic obstructive pulmonary disease; Tx: Lungtransplant; ddLLTx: Deceased donor lobar lung transplant. 1, 2Indicate a significant difference in pTLCratioFull (one-way-anova P-value < 0.05) of pairwise comparisons between transplant indications, after Bonferroni adjustment for multiple comparisons; 3,4Indicate a significant difference in pTLCratioLobar (one-way-anova P-value < 0.05) of pairwise comparisons between transplant indications, after Bonferroni adjustment for multiple comparisons.
Figure 5 Donor to recipient size matching based on the donor to recipient predicted total lung capacity ratio, stratified by transplant center.
See figure legend 3 for further details. 1,2,3,4,5,6Indicate a significant difference in pTLCratioFull (one-way-anova P-value < 0.05) of pairwise comparisons between transplant centers, after Bonferroni adjustment for multiple comparisons; 7,8,9,10,11,12Indicate a significant difference in pTLCratioLobar (one-way-anova P-value < 0.05) of pairwise comparisons between transplant centers, after Bonferroni adjustment for multiple comparisons. pTLC: Predicted total lung capacity.
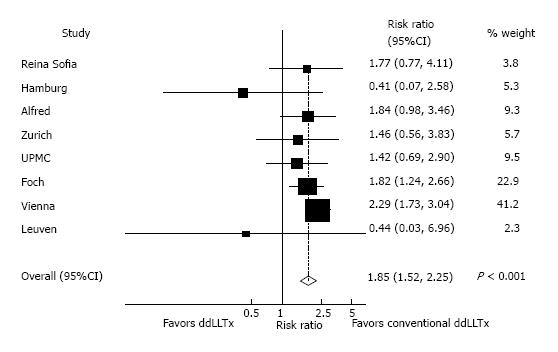
Figure 6 Forest plot for pooled analysis of 1 year survival comparing deceased donor lobar lung transplantation to conventional lung transplant.
Vertical line is the “no difference” point in 1 year mortality between dLLTx and CLTx cohorts. Horizontal lines are 95%CI. ■ = Relative Risk (RR) and the size of each square denotes the proportion of information provided by each trial. ◊ = pooled RR for all studies combined. dLLTx: Donor lobar Lung transplantation; CLTx: Conventional lung transplant.
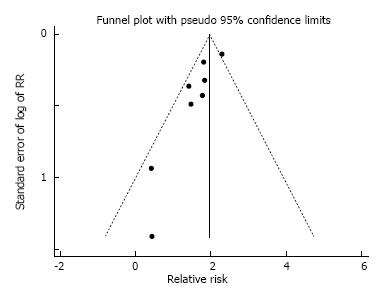
Figure 7 Funnel plot for assessment of publication bias in 1 year mortality results.
- Citation: Eberlein M, Reed RM, Chahla M, Bolukbas S, Blevins A, Van Raemdonck D, Stanzi A, Inci I, Marasco S, Shigemura N, Aigner C, Deuse T. Lobar lung transplantation from deceased donors: A systematic review. World J Transplant 2017; 7(1): 70-80
- URL: https://www.wjgnet.com/2220-3230/full/v7/i1/70.htm
- DOI: https://dx.doi.org/10.5500/wjt.v7.i1.70


