Copyright
©The Author(s) 2017.
World J Transplant. Feb 24, 2017; 7(1): 26-33
Published online Feb 24, 2017. doi: 10.5500/wjt.v7.i1.26
Published online Feb 24, 2017. doi: 10.5500/wjt.v7.i1.26
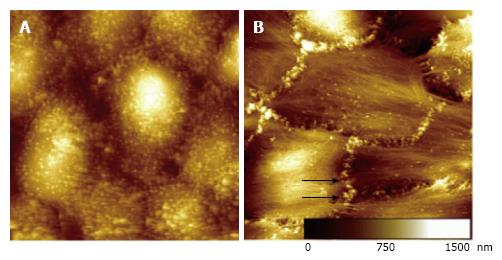
Figure 1 Morphological changes of cells undergoing epithelial to mesenchymal transformation.
Images from atomic force microscopy of glutardialdehyde fixed cells in fluid (highest sample areas are represented in white). A: Typically, epithelial tubular cells (NRK-52E), (50 μm)2, appear with numerous microvillus compatible structures on the cellular surface; B: Tubular cells after six days of TGF-β1 treatment (50 μm)2. Cells show a fibrillary surface structure with rarefied microvilli. Nodular protrusions developed at the cell borders (black arrows)[35]. ©IOP Publishing. Reproduced with permission. All rights reserved. TGF: Transforming growth factor.
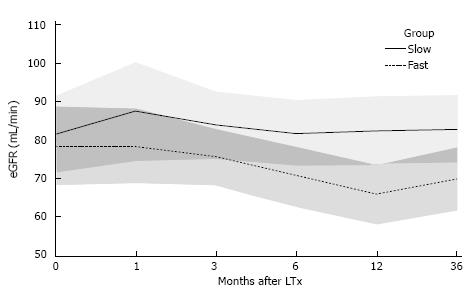
Figure 2 Estimated renal function measured by estimated glomerular filtration rate (Cockcroft-Gault eGFR, mL/min) after liver transplantation.
There was no noticeable difference between fast and slow tacrolimus metabolizers at liver transplantation at 1 mo or 3 mo after liver transplantation. After 6, 12, and 36 mo, slow tacrolimus metabolizers had a significantly better renal function than fast metabolizers. Mean estimates and corresponding 95% confidence intervals from the multivariable linear mixed model are plotted; overlapping areas are shown in dark grey[59]. eGFR: Estimated glomerular filtration rate.
- Citation: Thölking G, Gerth HU, Schuette-Nuetgen K, Reuter S. Influence of tacrolimus metabolism rate on renal function after solid organ transplantation. World J Transplant 2017; 7(1): 26-33
- URL: https://www.wjgnet.com/2220-3230/full/v7/i1/26.htm
- DOI: https://dx.doi.org/10.5500/wjt.v7.i1.26


