Copyright
©The Author(s) 2016.
World J Transplant. Jun 24, 2016; 6(2): 356-369
Published online Jun 24, 2016. doi: 10.5500/wjt.v6.i2.356
Published online Jun 24, 2016. doi: 10.5500/wjt.v6.i2.356
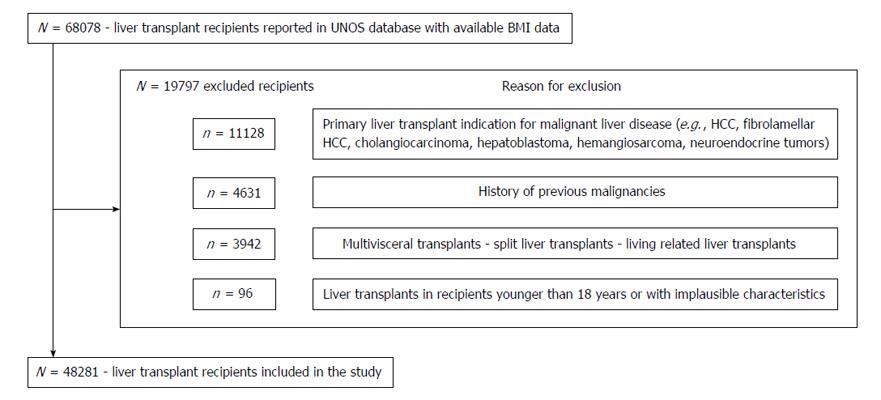
Figure 1 Flowchart of all the include and exclude patients in this study.
BMI: Body mass index; UNOS: United Network for Organ Sharing; HCC: Hepatocellular carcinoma.
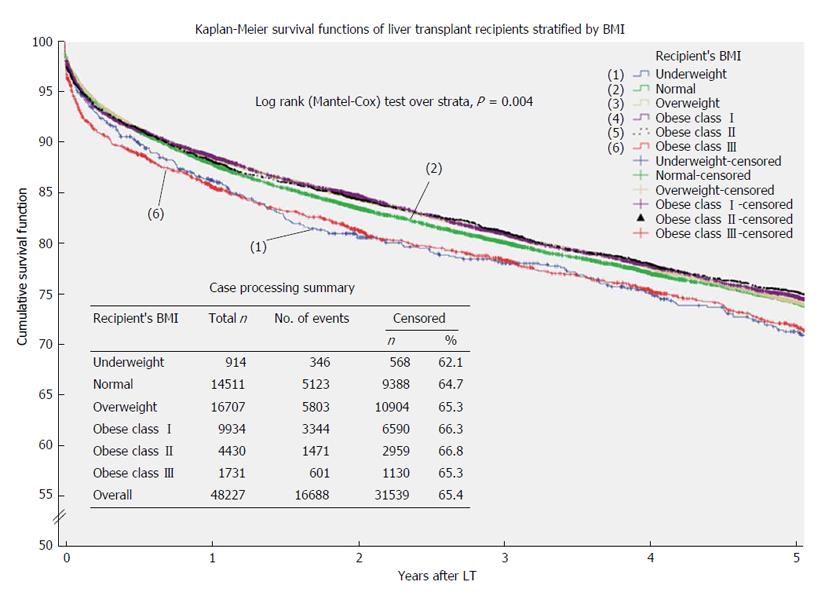
Figure 2 Kaplan-Meier overall survival functions of liver transplant recipients during the first 5 years stratified by their body mass index.
Log rank (Mantel-Cox) test over strata showed significant survival difference (P = 0.004). In comparison to normal weight recipients, underweight recipients (P = 0.034) and class III obese patients (P = 0.001) experienced significant lower probability of overall survival. BMI: Body mass index; LT: Liver transplantation.
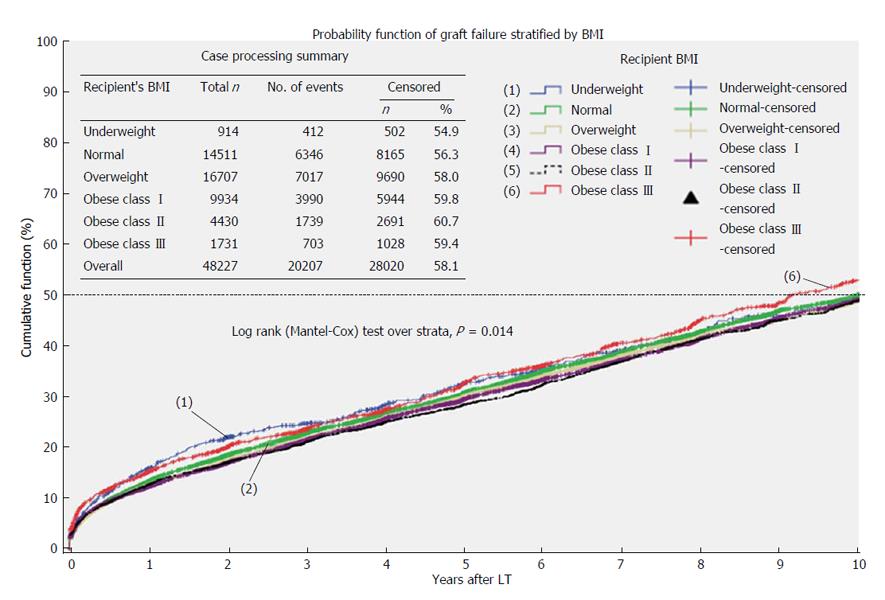
Figure 3 Kaplan-Meier functions of graft survival stratified by recipients’ body mass index.
BMI: Body mass index; LT: Liver transplantation.
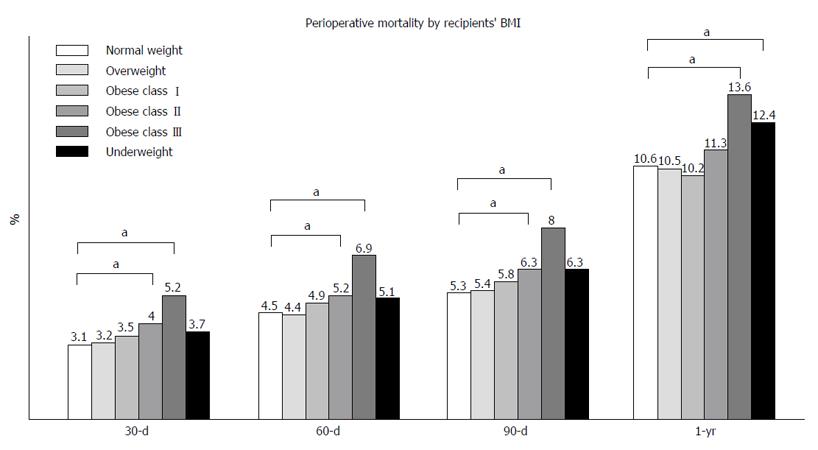
Figure 4 Graphical representation of perioperative and 1-year mortality stratified by recipients’ body mass index.
Statistical significant difference in perioperative mortality at 30 d, 60 d and 90 d post liver transplantation was found between normal weight recipients and class II and class III obese patients. At 1 year after surgery, a statistical significant difference in mortality was noted between normal weight recipient and class III obese patients. aP≤ 0.05. BMI: Body mass index.
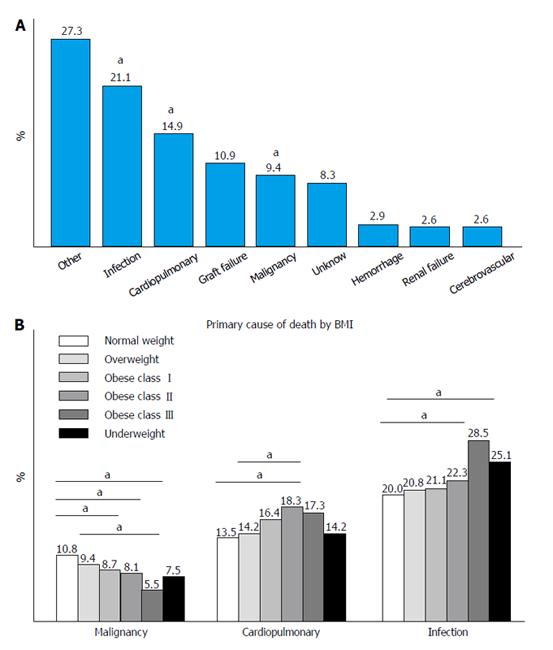
Figure 5 All causes of deaths after liver transplantation.
A “a” represent statistical significant differences among recipients’ BMI categories (A). Infections were more frequently observed in class II and class III obese recipients in comparison to normal weight patients. Similarly, deaths caused by cardiopulmonary complications were more frequent in class II obese patients vs normal weight or overweight recipients. On the other hand, deaths caused by malignancies were more frequent in normal weight and overweight recipients in comparison to other BMI categories (B). aP≤ 0.05. BMI: Body mass index.
- Citation: Ayloo S, Hurton S, Cwinn M, Molinari M. Impact of body mass index on outcomes of 48281 patients undergoing first time cadaveric liver transplantation. World J Transplant 2016; 6(2): 356-369
- URL: https://www.wjgnet.com/2220-3230/full/v6/i2/356.htm
- DOI: https://dx.doi.org/10.5500/wjt.v6.i2.356


