Copyright
©The Author(s) 2015.
World J Transplant. Dec 24, 2015; 5(4): 338-347
Published online Dec 24, 2015. doi: 10.5500/wjt.v5.i4.338
Published online Dec 24, 2015. doi: 10.5500/wjt.v5.i4.338
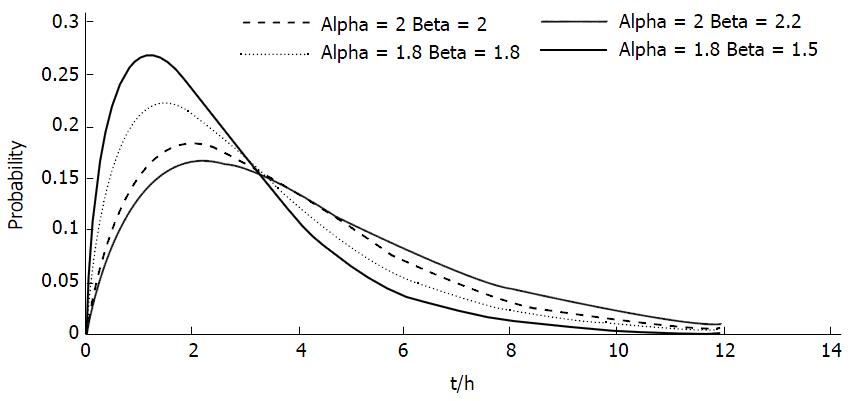
Figure 1 Gamma distribution curves with varying alpha and beta parameters.
Figure 2 Kidney allograft function estimated by plasma creatinine (A) and glomerular filtration rate estimated by mdrd formula (B).
MMF: Mycophenolate mofetyl.
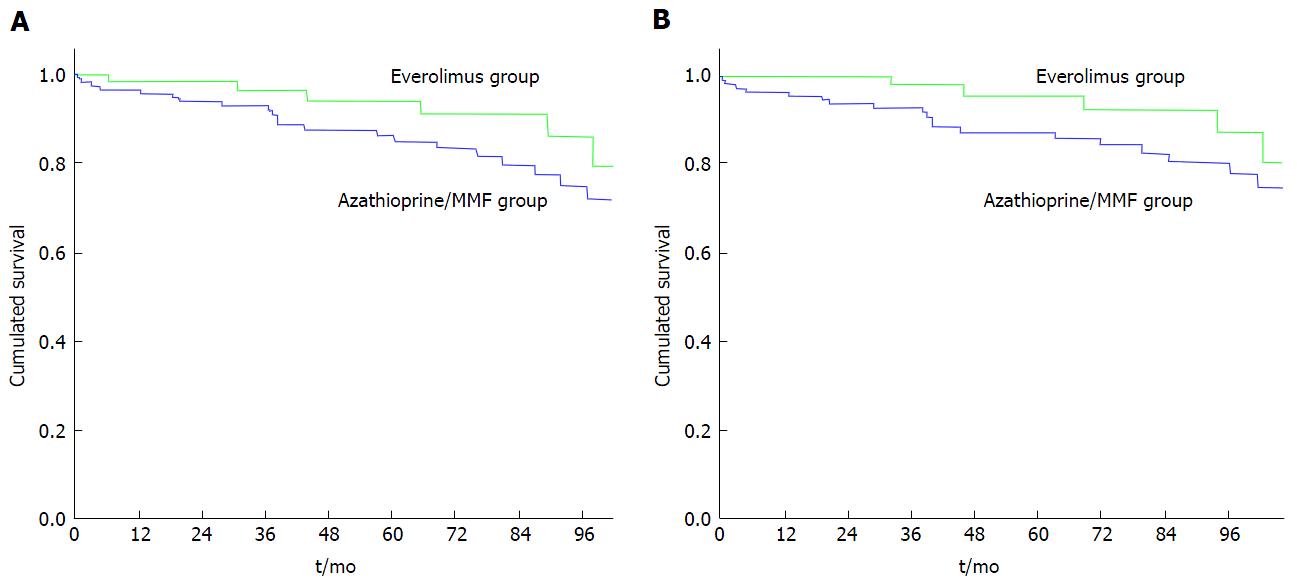
Figure 3 Graft survival un-censored (A) and graft survival censored (B) for patient death with a functioning graft.
MMF: Mycophenolate mofetyl.
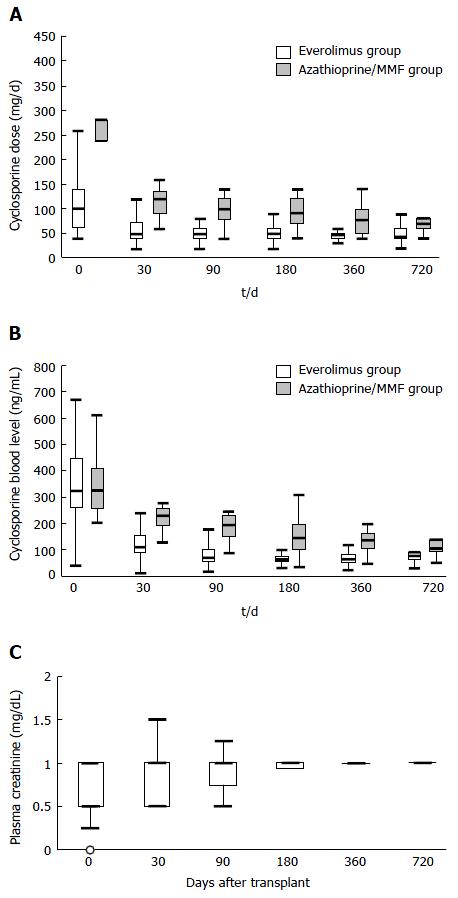
Figure 4 Cyclosporine daily dose (A), cyclosporine blood concentrations (B) and everolimus daily dose (C) during the first two years of follow-up.
MMF: Mycophenolate mofetyl.
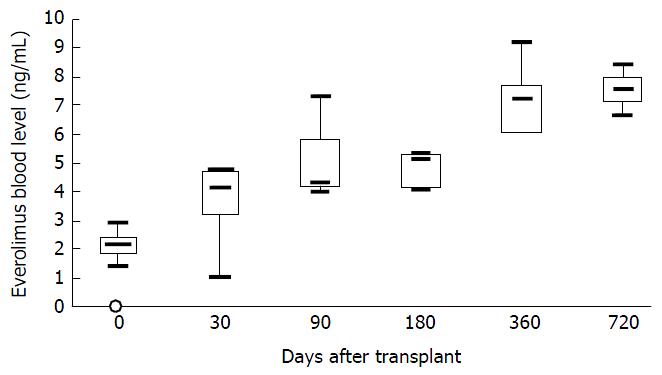
Figure 5 Everolimus blood concentrations during the first years of follow-up.
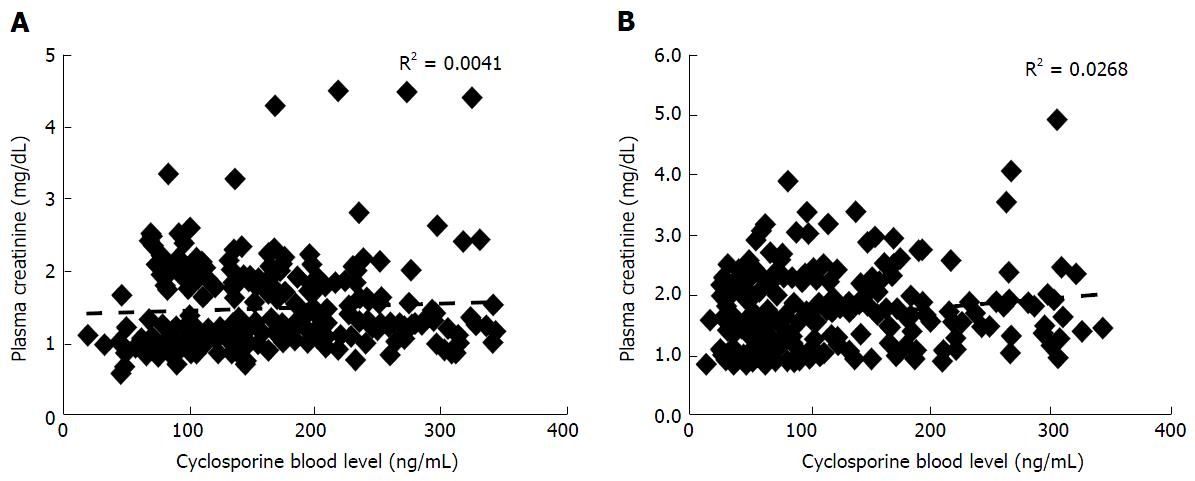
Figure 6 Correlation between plasma creatinine and blood cyclosporine concentration in the everolimus group (A) and mycophenolate mofetyl group (B).
- Citation: González F, Valjalo R. Combining cytochrome P-450 3A4 modulators and cyclosporine or everolimus in transplantation is successful. World J Transplant 2015; 5(4): 338-347
- URL: https://www.wjgnet.com/2220-3230/full/v5/i4/338.htm
- DOI: https://dx.doi.org/10.5500/wjt.v5.i4.338


