Copyright
©The Author(s) 2015.
World J Transplant. Dec 24, 2015; 5(4): 292-299
Published online Dec 24, 2015. doi: 10.5500/wjt.v5.i4.292
Published online Dec 24, 2015. doi: 10.5500/wjt.v5.i4.292
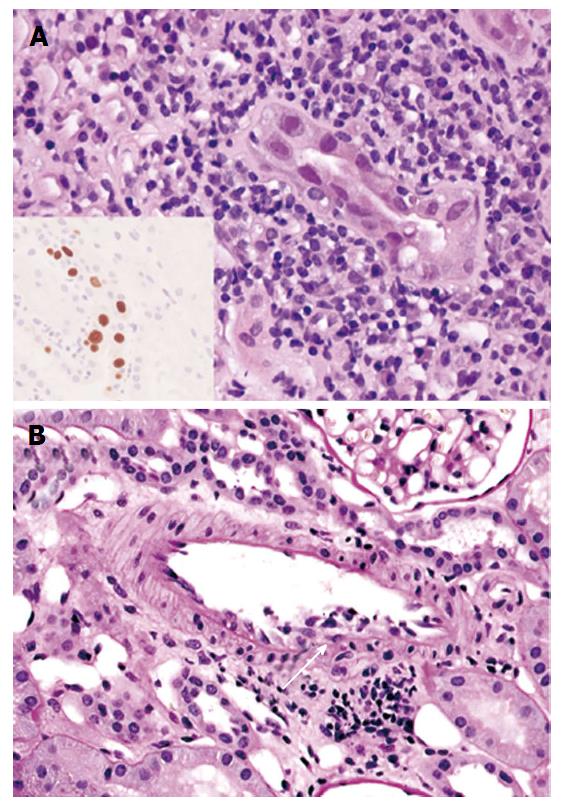
Figure 1 Diagnostic features of acute rejection from biopsies with concurrent polyomavirus nephropathy.
Representative images of (A) nuclear inclusions characteristic of polyomavirus cytopathic effect (hematoxylin and eosin) and nuclear large-T antigen staining (inset, highlighted in brown) and (B) intimal arteritis (v1 by Banff criteria), as demonstrated by lymphocytes undermining the endothelium (white arrow).
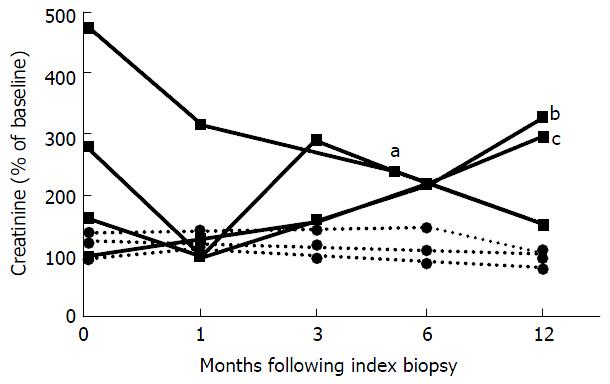
Figure 2 Creatinine trends after identification of concurrent acute rejection and polyomavirus nephropathy.
Serum creatinine values are depicted relative to the baseline creatinine at 1, 3, 6 and 12 mo following the index biopsy. Patients with a prior decrease of IS are represented by solid lines and squares. Patients with no known change of IS are represented by dashed lines and circles. aNephrectomy at 144 d; bNephrectomy at 483 d; cClinical graft loss at 1 year. IS: Immunosuppression.
- Citation: McGregor SM, Chon WJ, Kim L, Chang A, Meehan SM. Clinical and pathological features of kidney transplant patients with concurrent polyomavirus nephropathy and rejection-associated endarteritis. World J Transplant 2015; 5(4): 292-299
- URL: https://www.wjgnet.com/2220-3230/full/v5/i4/292.htm
- DOI: https://dx.doi.org/10.5500/wjt.v5.i4.292


