Copyright
©The Author(s) 2015.
World J Transplant. Dec 24, 2015; 5(4): 231-242
Published online Dec 24, 2015. doi: 10.5500/wjt.v5.i4.231
Published online Dec 24, 2015. doi: 10.5500/wjt.v5.i4.231
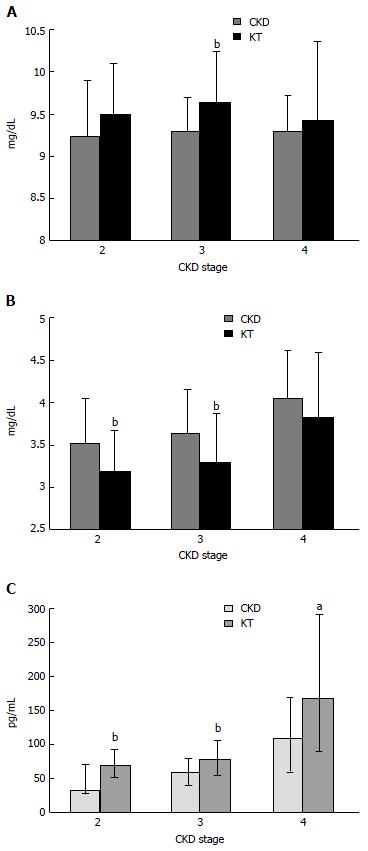
Figure 1 Serum calcium (mean ± SD) (A) and serum phosphate (mean ± SD) (B) in chronic kidney disease patients and kidney transplant recipients according to chronic kidney disease stages, intact parathyroid hormone levels [median (interquartile range)] in chronic kidney disease patients and kidney transplant recipients according to chronic kidney disease stages[8] (C).
aP < 0.05 vs CKD, bP < 0.001 vs CKD. CKD: Chronic kidney disease; KT: Kidney transplant.
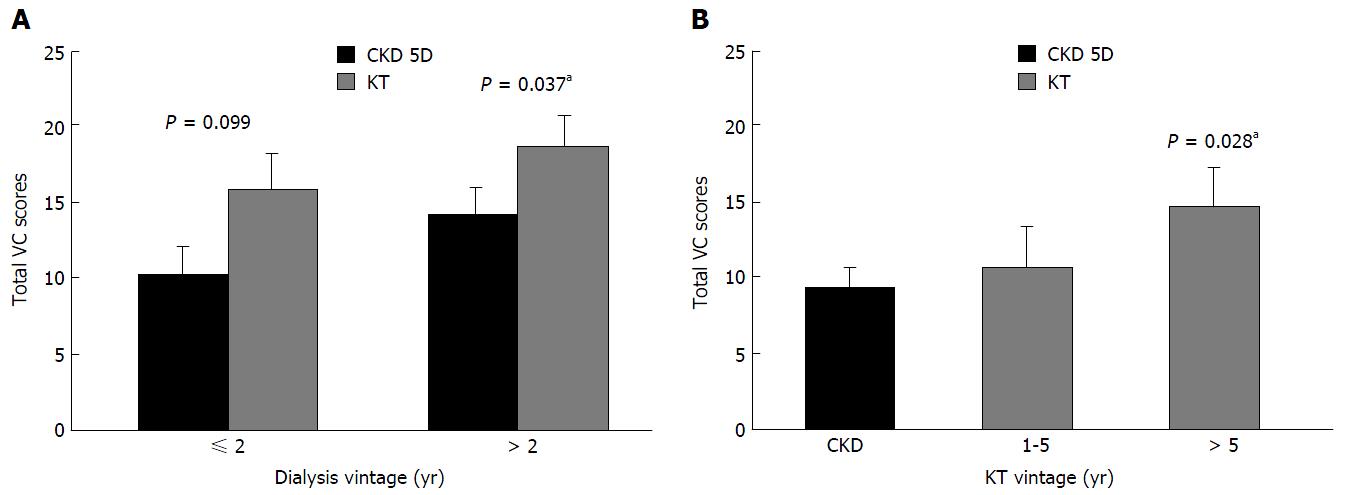
Figure 2 Total vascular calcification scores of chronic kidney disease stages 5D patients and kidney transplant recipients categorized according to (A) dialysis vintage (B) kidney transplant vintage.
Total VC scores are expressed as mean ± SE[60]. aP < 0.05 vs CKD. VC: Vascular calcification; KT: Kidney transplant; CKD: Chronic kidney disease.
- Citation: Taweesedt PT, Disthabanchong S. Mineral and bone disorder after kidney transplantation. World J Transplant 2015; 5(4): 231-242
- URL: https://www.wjgnet.com/2220-3230/full/v5/i4/231.htm
- DOI: https://dx.doi.org/10.5500/wjt.v5.i4.231


