Copyright
©2014 Baishideng Publishing Group Inc.
World J Transplant. Dec 24, 2014; 4(4): 276-293
Published online Dec 24, 2014. doi: 10.5500/wjt.v4.i4.276
Published online Dec 24, 2014. doi: 10.5500/wjt.v4.i4.276
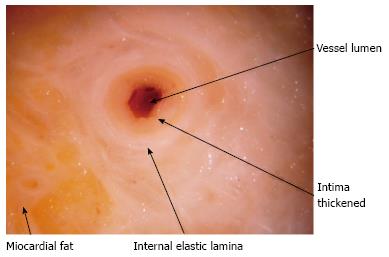
Figure 1 Stenotic coronary artery macroscopic aspect in post mortem study of explanted heart.
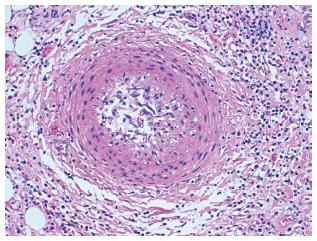
Figure 2 Histopathologic example of stenotic microvasculopathy: Medial thickening and endothelial swelling with evidence of luminal stenosis (hematoxylin-eosin stain).
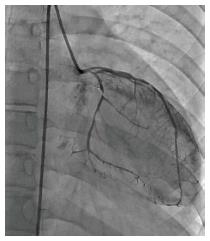
Figure 3 Left coronary angiography showing severe epicardial disease with multiple stenosis in left anterior descending artery and left circumflex artery.
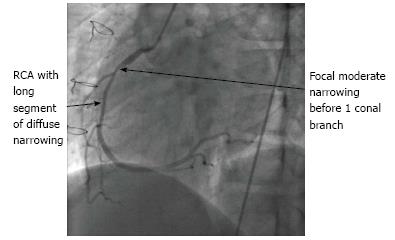
Figure 4 RCA angiography.
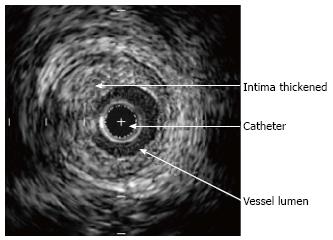
Figure 5 Intravascular ultrasound still frame showing severe intimal thickening (Stanford grade IV).
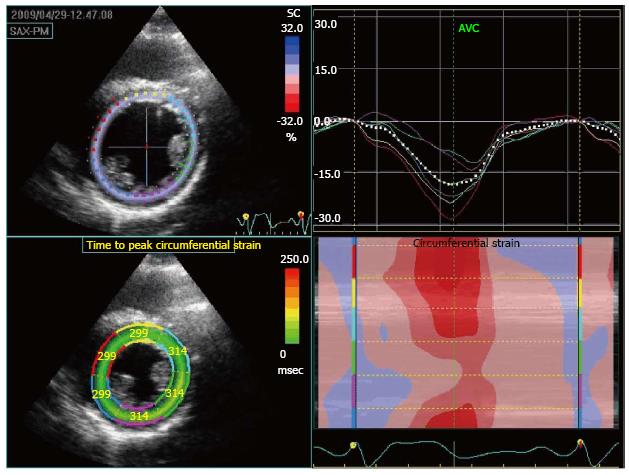
Figure 6 Speckle-tracking echocardiographic analysis of myocardial deformation showing circumferential strain in a patient with coronary allograft vasculopathy.
On the top right image we can appreciate the dyssinchrony (later contraction compared to the rest of the segments) and lower contractility of the green and purple segment corresponding to LCX territory. On the bottom right figure, we can appreciate how the same green and purple segments have significant lower contractility than the others (red corresponds to the maximum contractility and blue to the absence of it). The left superior panel shows the color coding for each of the segments. The left inferior panel shows the time interval between beginning of QRS and maximal strain value.
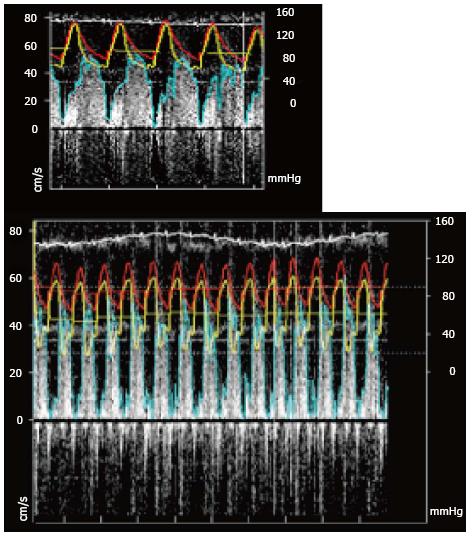
Figure 7 (A) Resting pressure and flow recording (Red: Aortic pressure; Yellow: Distal coronary pressure; Blue: Pulse wave Doppler envelope) and (B) during hyperemia note that the aortic pressure has decrease as well as the distal coronary pressure.
FFR: Ratio of the mean distal coronary pressure at a point past the stenosis the aortic pressure during maximal hyperemia; CFR: Ratio of hyperemic blood flow to resting myocardial blood flow.
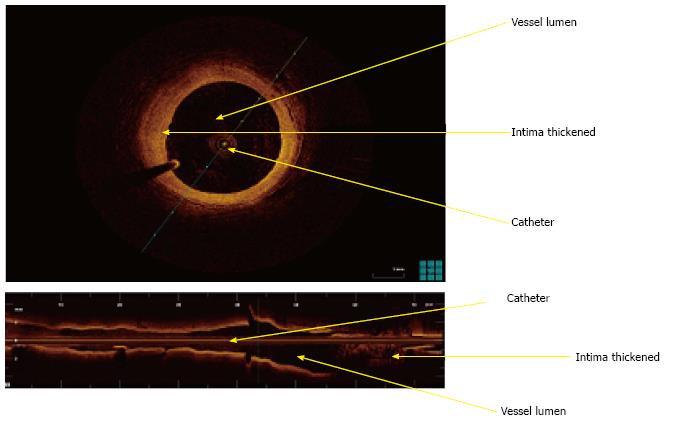
Figure 8 Optical coherence tomography images showing intima hyperplasia.
The superior image shows a transverse cut of the coronary. On the inferior part of the image, longitudinal cut.
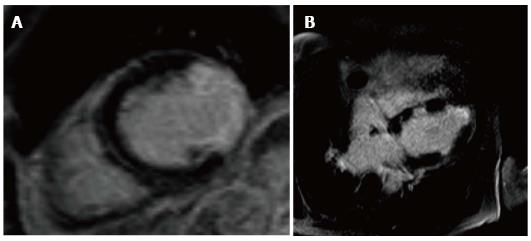
Figure 9 Late gadolinium enhancement scar imaging.
A: Typical infarct pattern Late enhancement with > 75% transmurality; B: Atypical pattern with diffuse pattern of late enhancement.
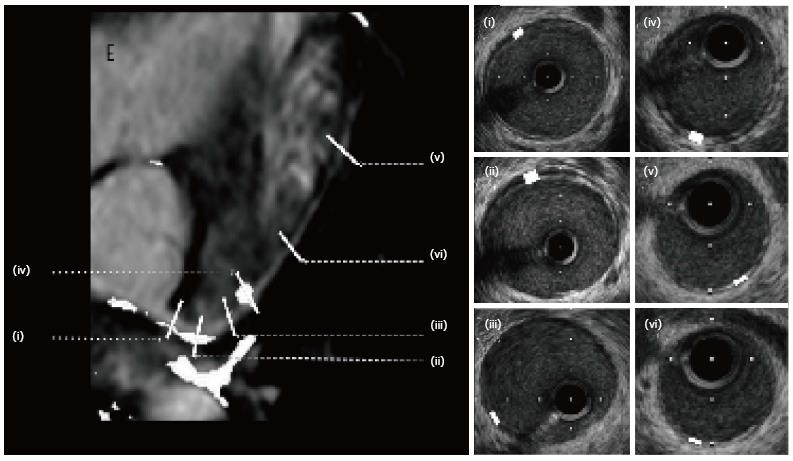
Figure 10 Late gadolinium enhancement in the coronary vessel wall showing corresponding positions for intravascular ultrasound: Illustrates intimal thickening corresponding to enhancement on overlay picture on the left.
- Citation: Dedieu N, Greil G, Wong J, Fenton M, Burch M, Hussain T. Diagnosis and management of coronary allograft vasculopathy in children and adolescents. World J Transplant 2014; 4(4): 276-293
- URL: https://www.wjgnet.com/2220-3230/full/v4/i4/276.htm
- DOI: https://dx.doi.org/10.5500/wjt.v4.i4.276


