Copyright
©The Author(s) 2025.
World J Transplant. Sep 18, 2025; 15(3): 102287
Published online Sep 18, 2025. doi: 10.5500/wjt.v15.i3.102287
Published online Sep 18, 2025. doi: 10.5500/wjt.v15.i3.102287
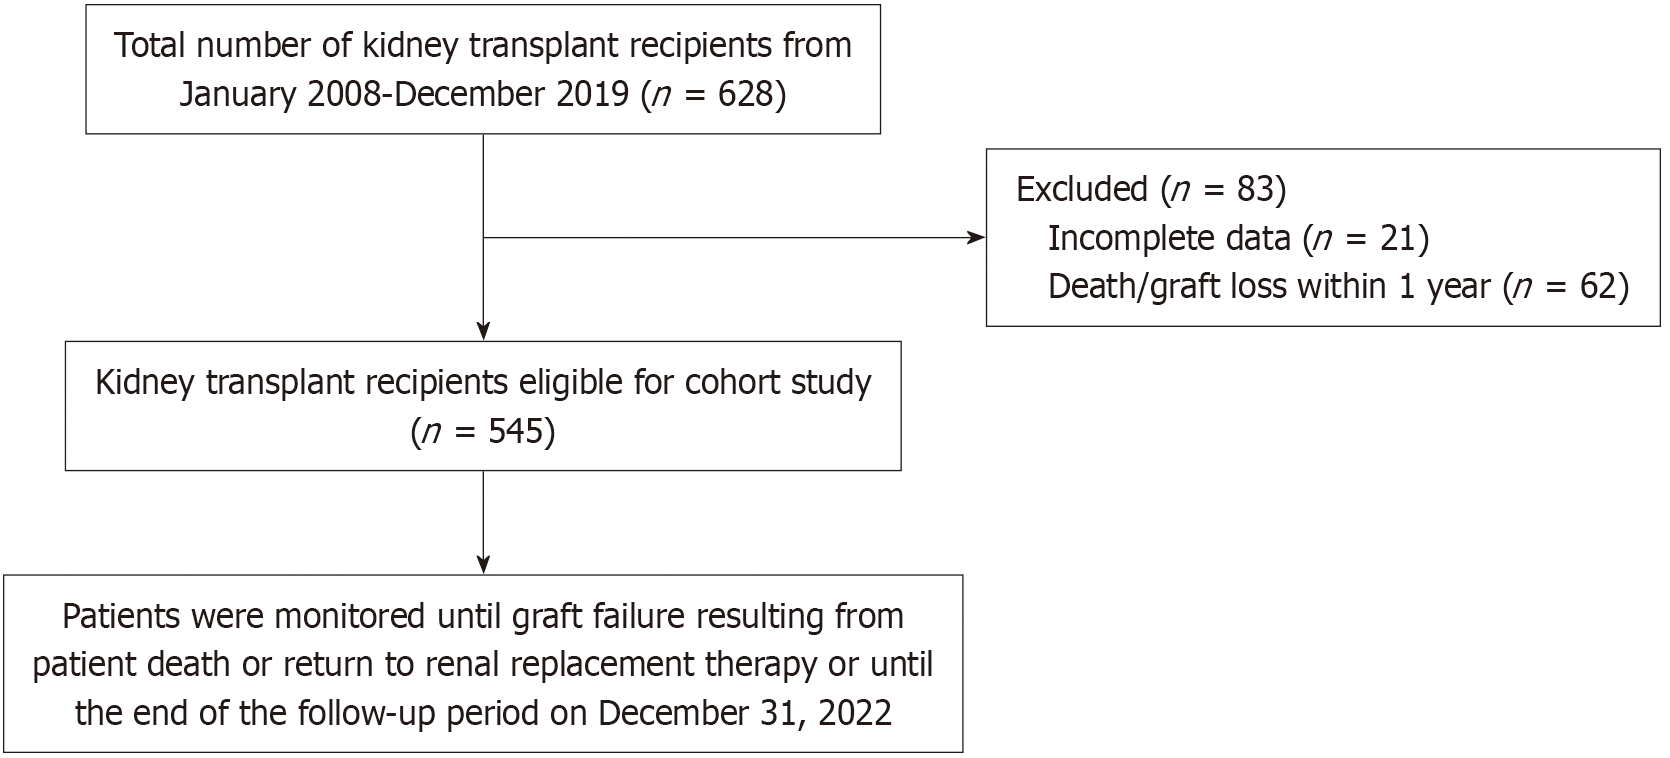
Figure 1 Flow chart of kidney transplant recipients at the study centre, including the number of recipients lost to follow-up within 1 year.
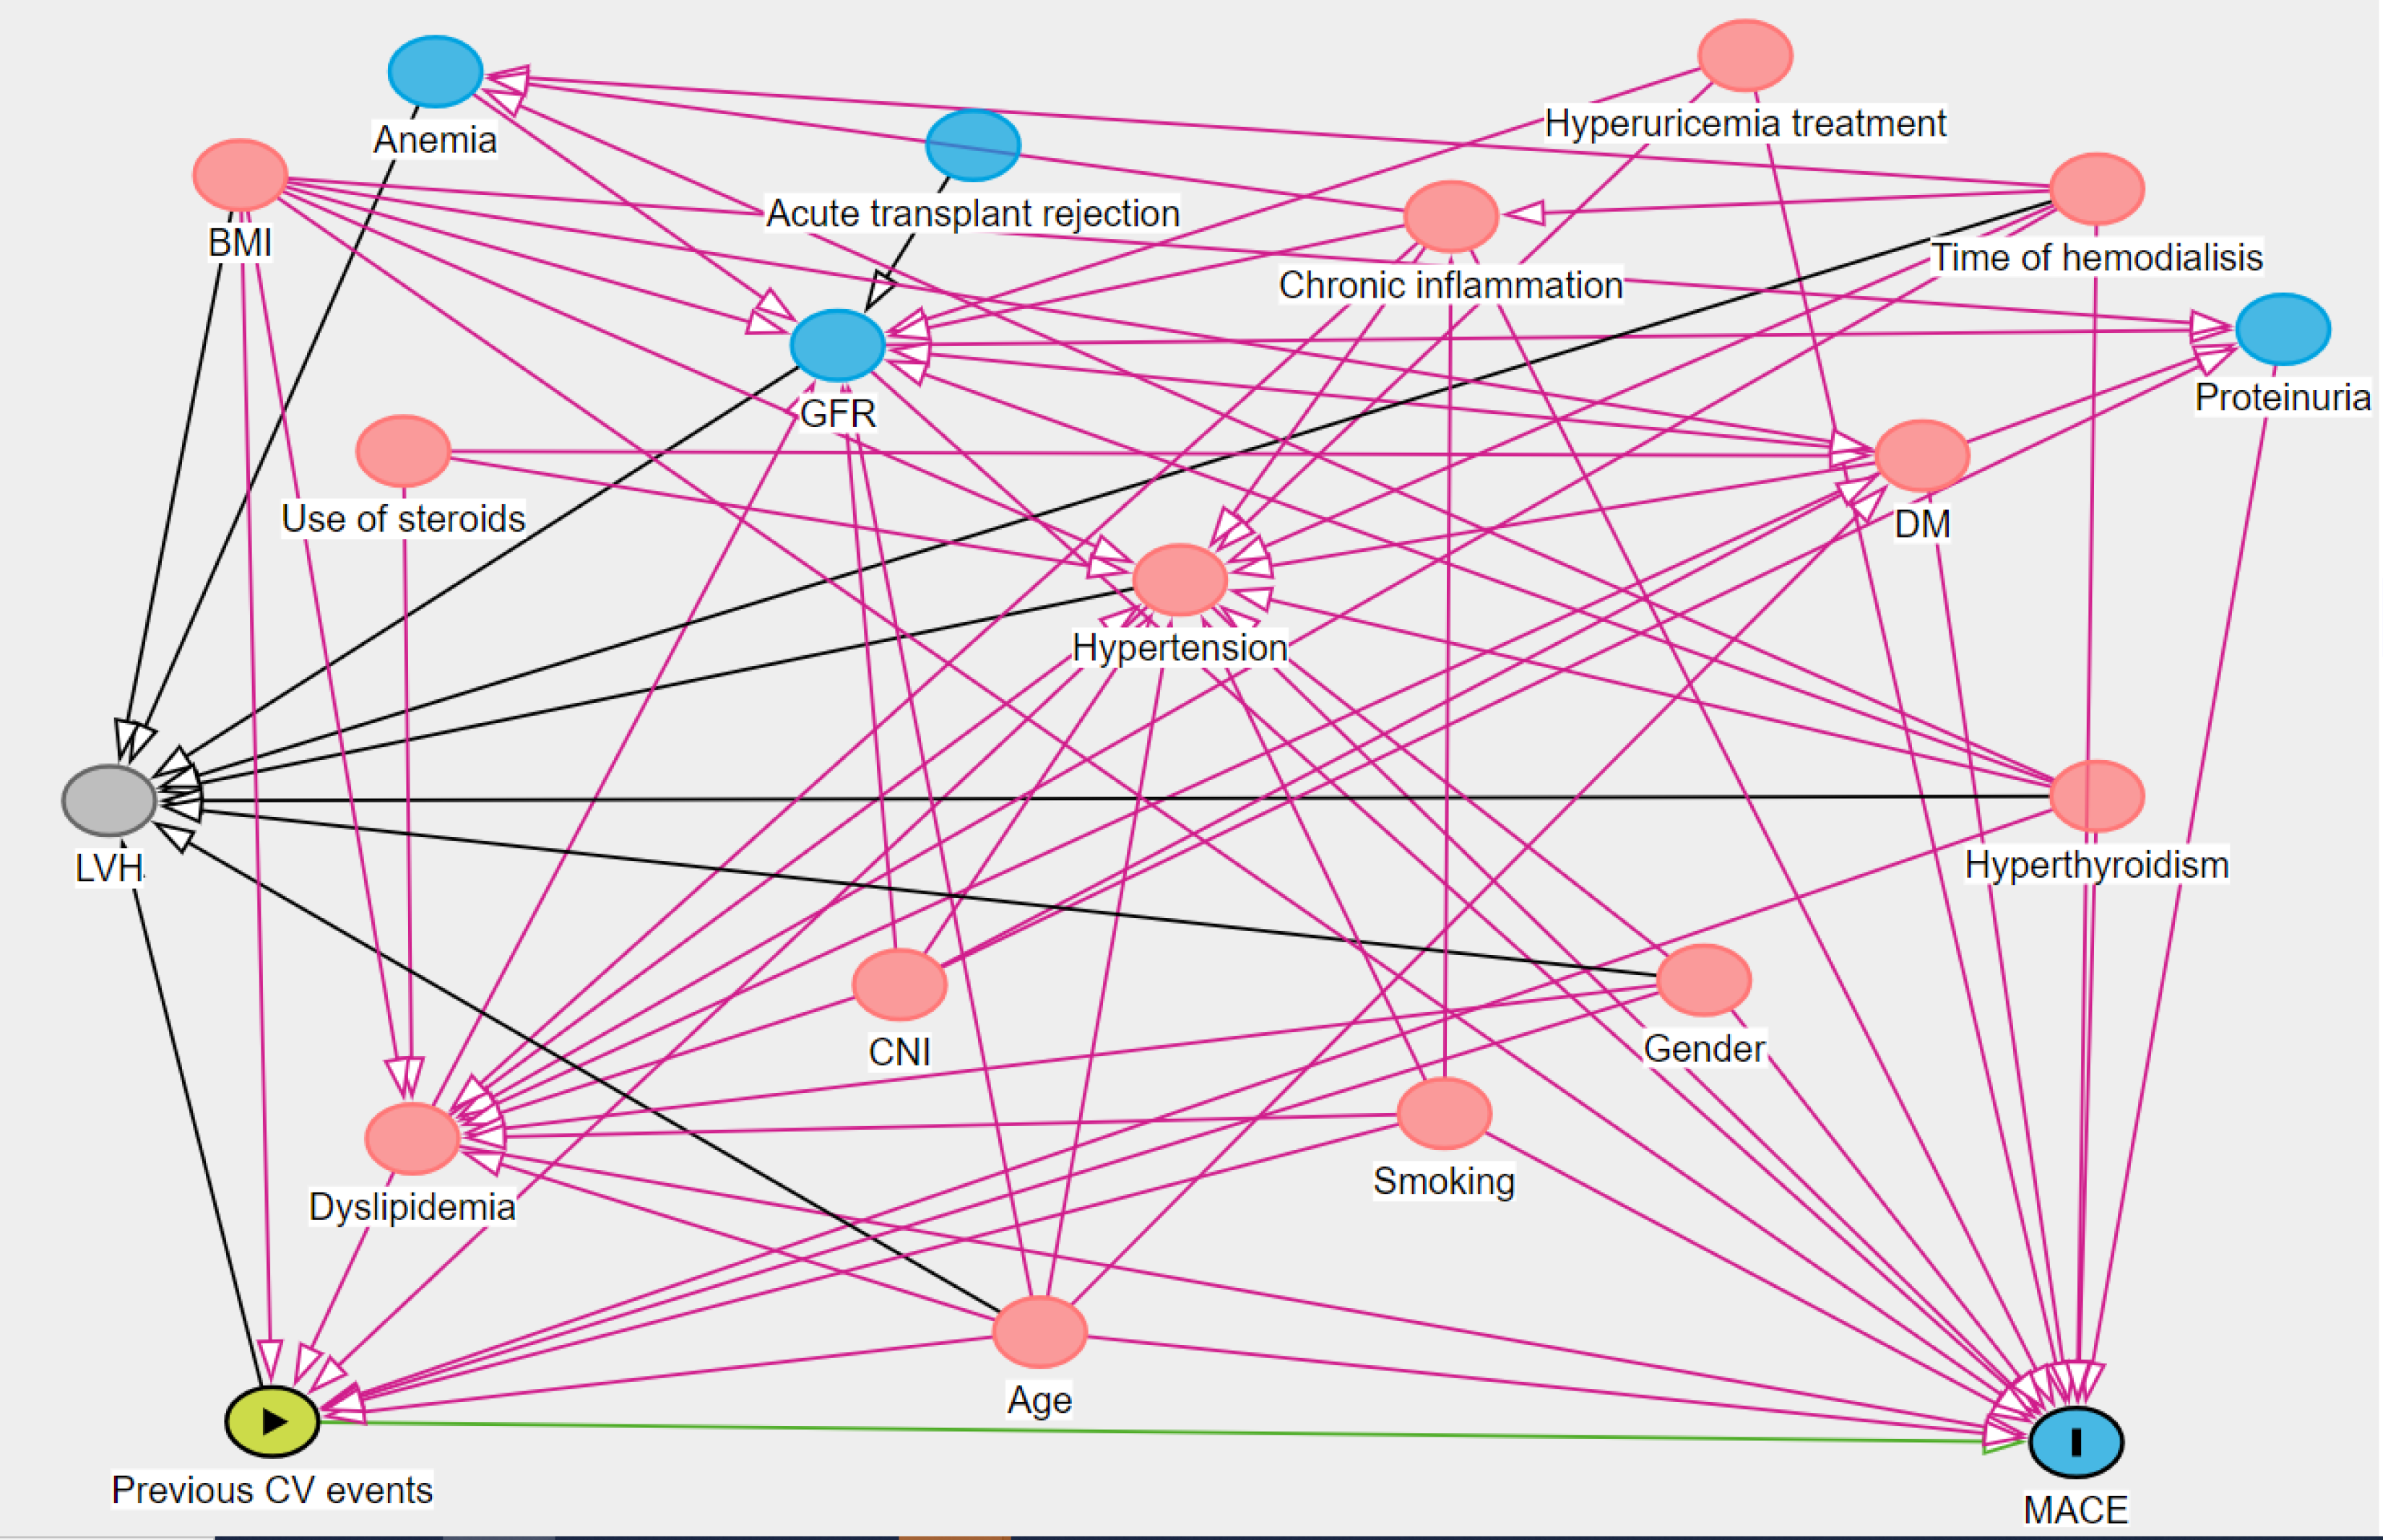
Figure 2 Direct acyclic graph of relationships between study variables.
BMI: Body mass index; CNI: Calcineurin inhibitor; CV: Cardiovascular; DM: Diabetes mellitus; GFR: Glomerular filtration rate; LVH: Left ventricular hypertrophy; MACE: Major adverse cardiovascular event.
- Citation: Junk E, Tzivian L, Folkmane I, Folkmanis K, Jushinskis J, Strazda G, Folkmanis V, Kuzema V, Petersons A. Major adverse cardiovascular events and hyperuricemia as an effect-modifying factor in kidney transplant recipients. World J Transplant 2025; 15(3): 102287
- URL: https://www.wjgnet.com/2220-3230/full/v15/i3/102287.htm
- DOI: https://dx.doi.org/10.5500/wjt.v15.i3.102287


