Copyright
©The Author(s) 2025.
World J Transplant. Jun 18, 2025; 15(2): 98616
Published online Jun 18, 2025. doi: 10.5500/wjt.v15.i2.98616
Published online Jun 18, 2025. doi: 10.5500/wjt.v15.i2.98616
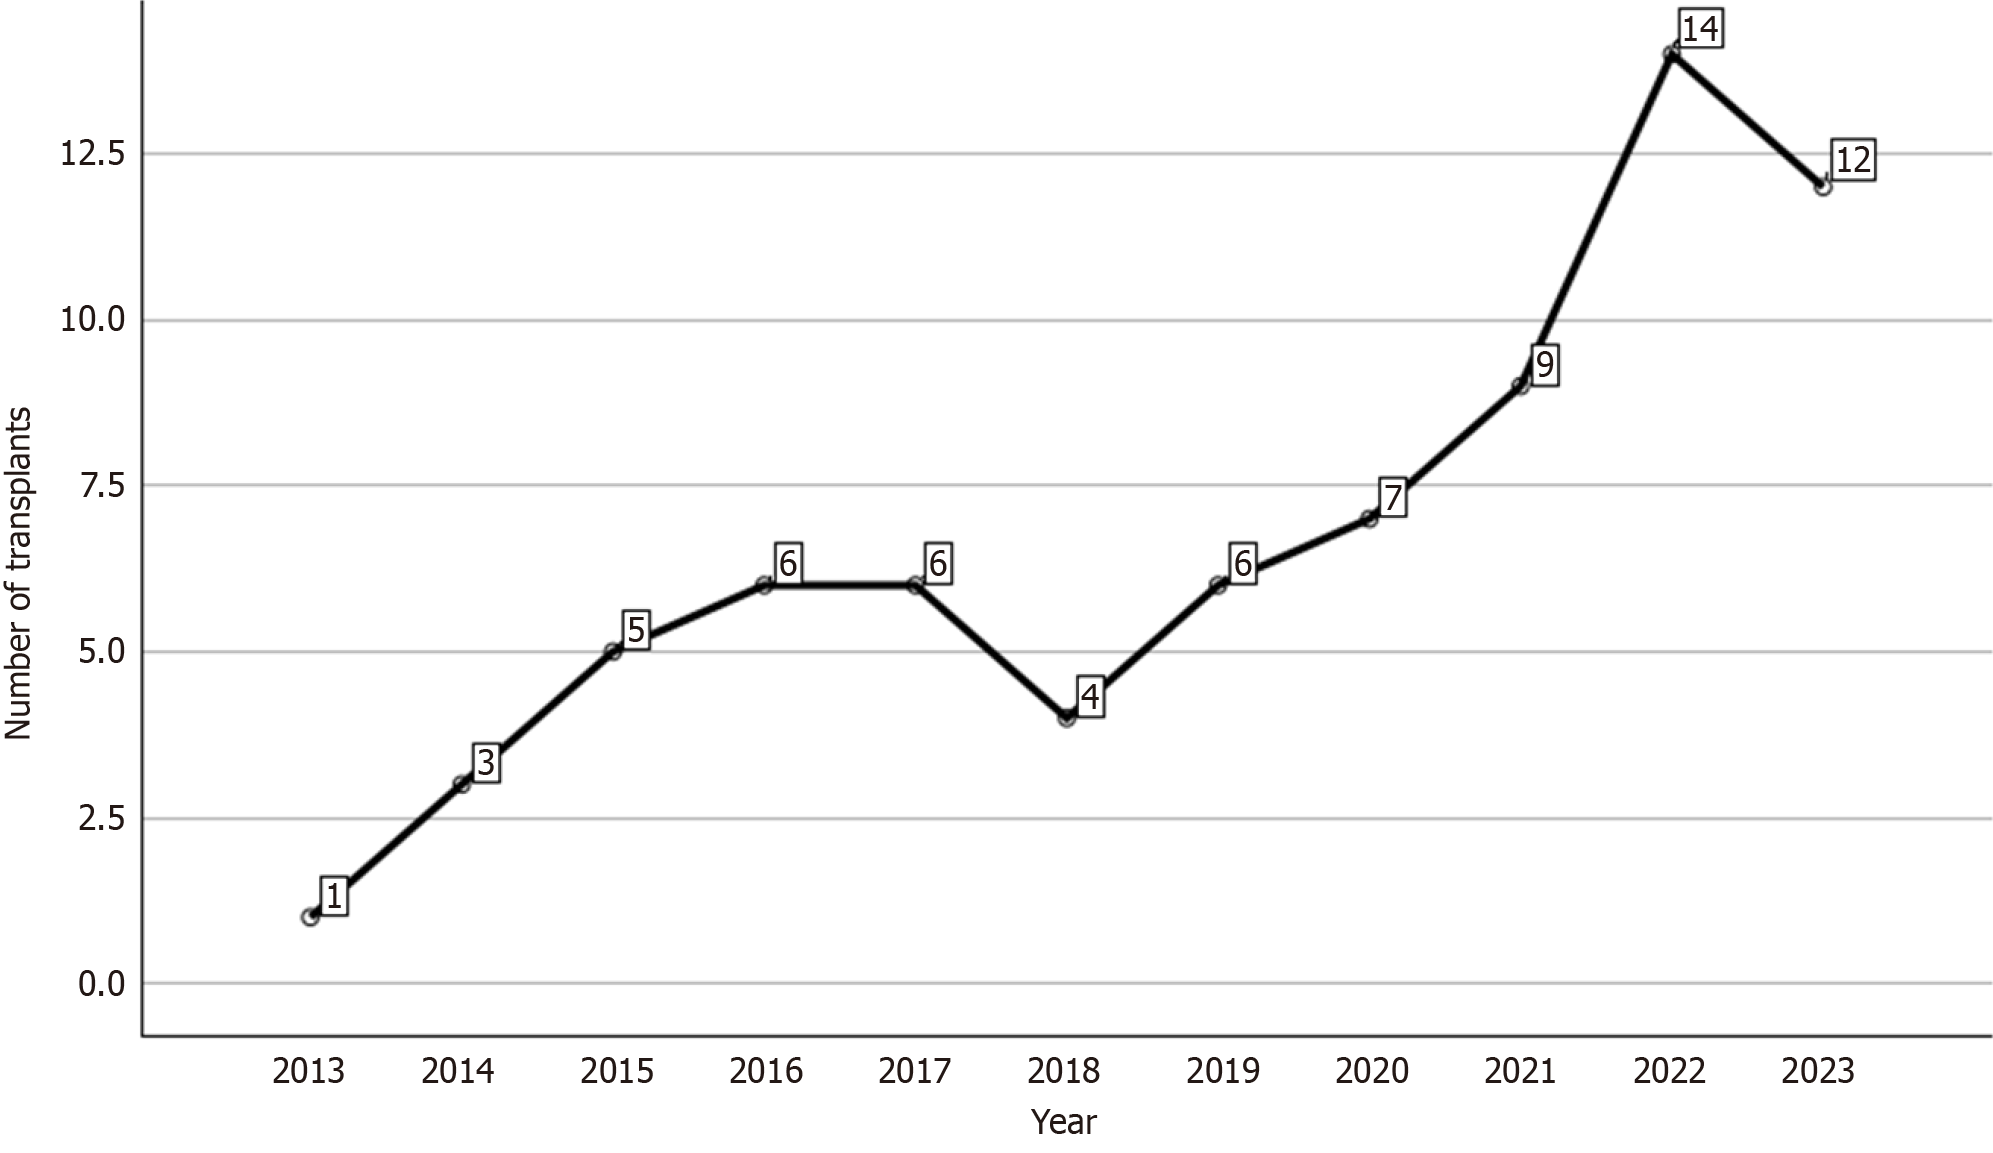
Figure 1
Number of pediatric living-donor liver transplantations per year.
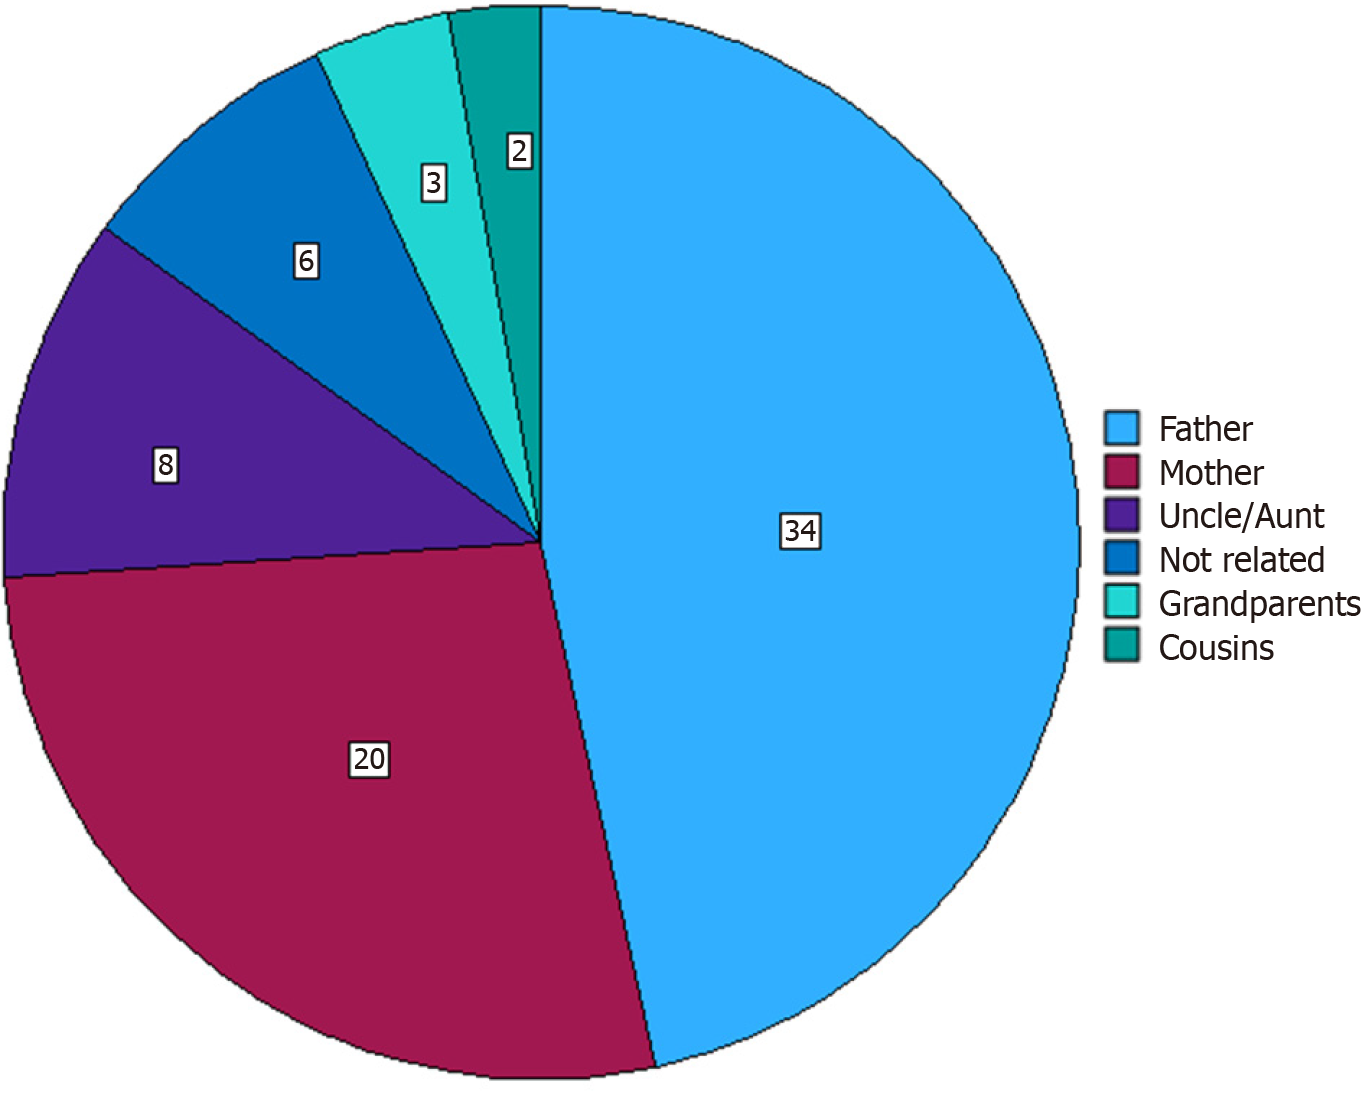
Figure 2
Donor-recipient relationship distribution (%).
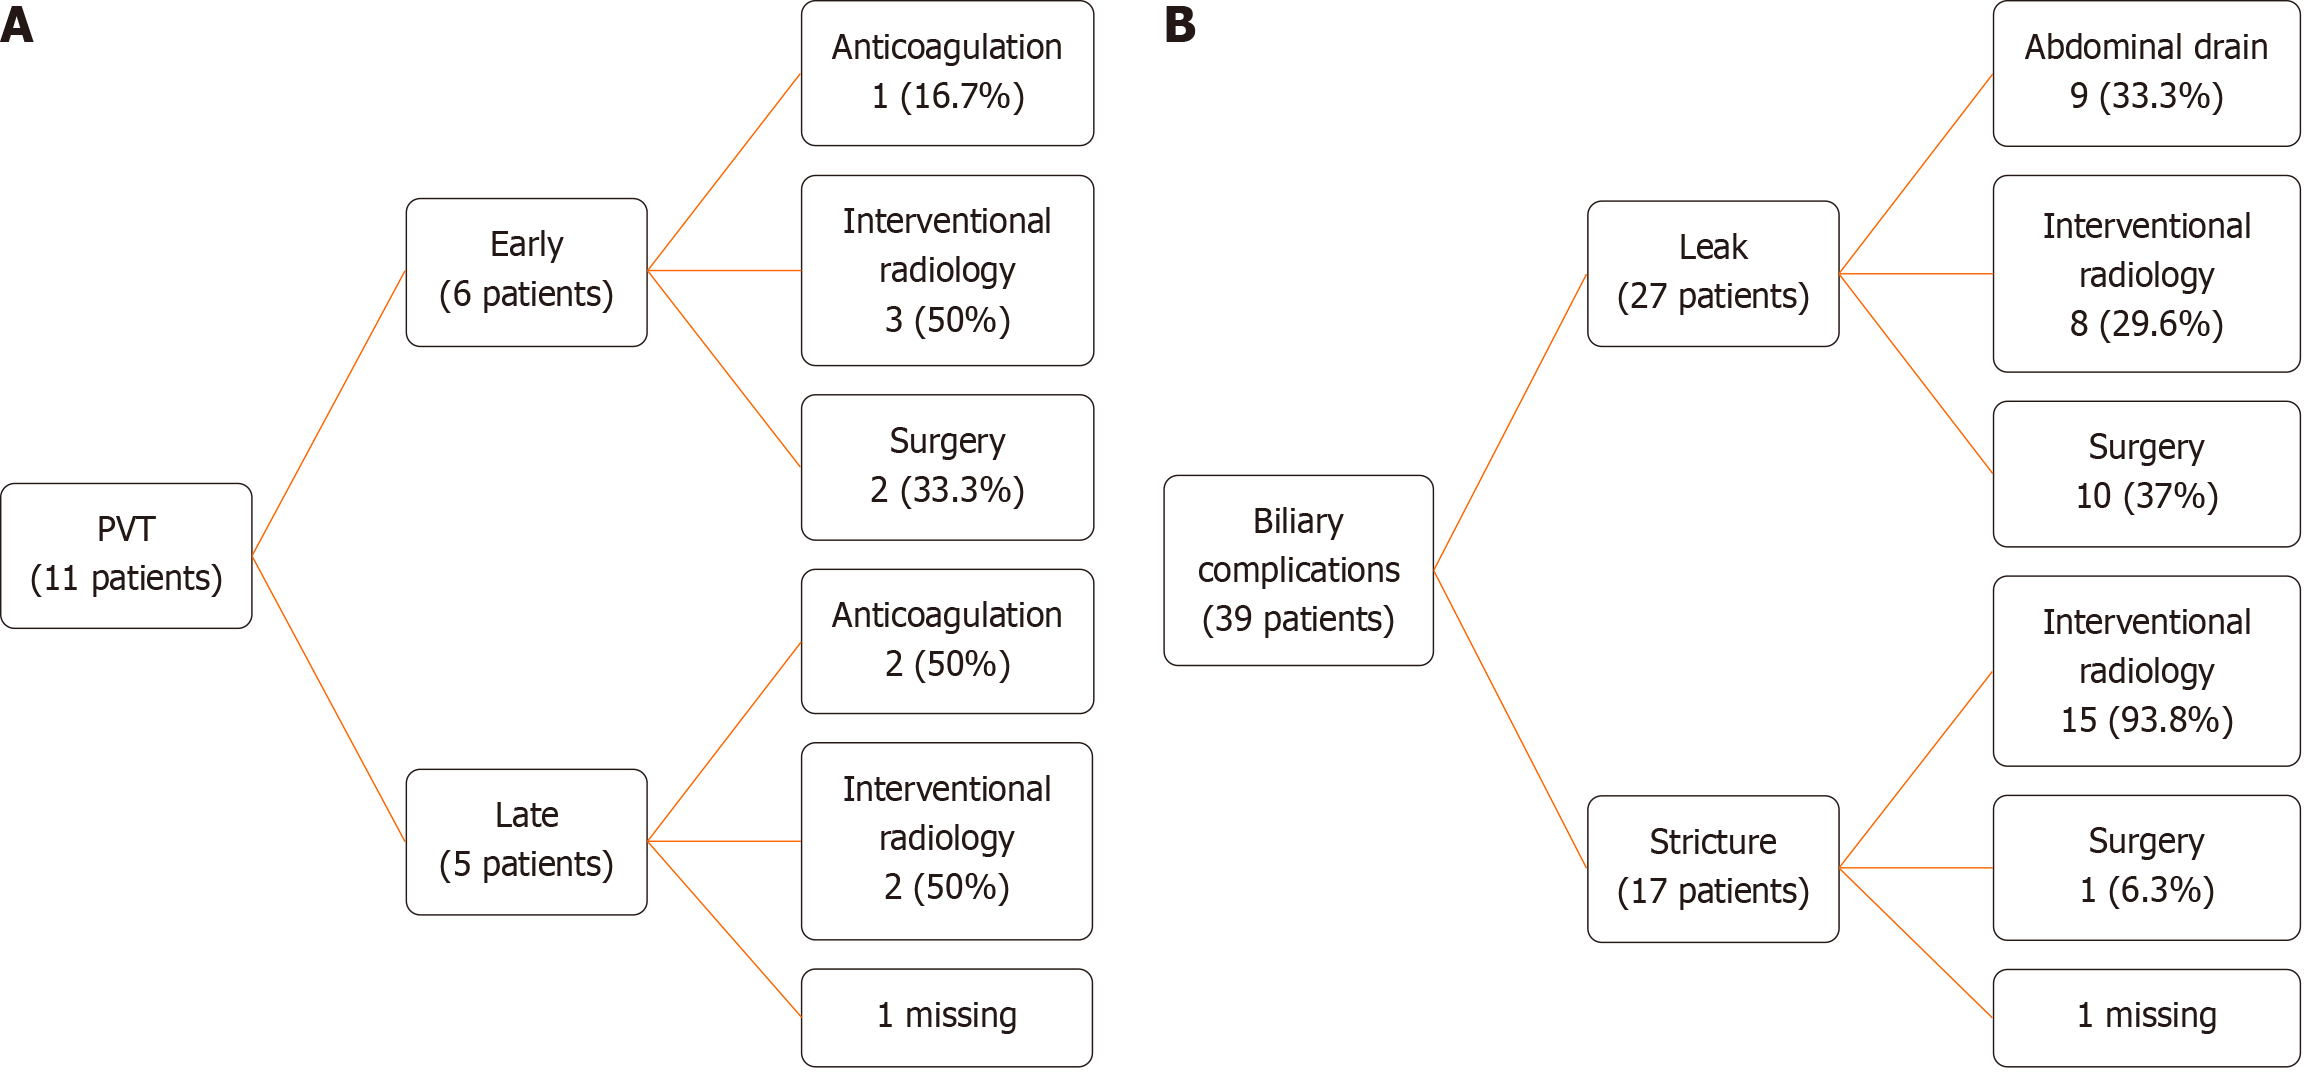
Figure 3 Flowchart of the treatment of patients.
A: Patients diagnosed with portal vein thrombosis; B: Patients diagnosed with biliary complications. PVT: Portal vein thrombosis.
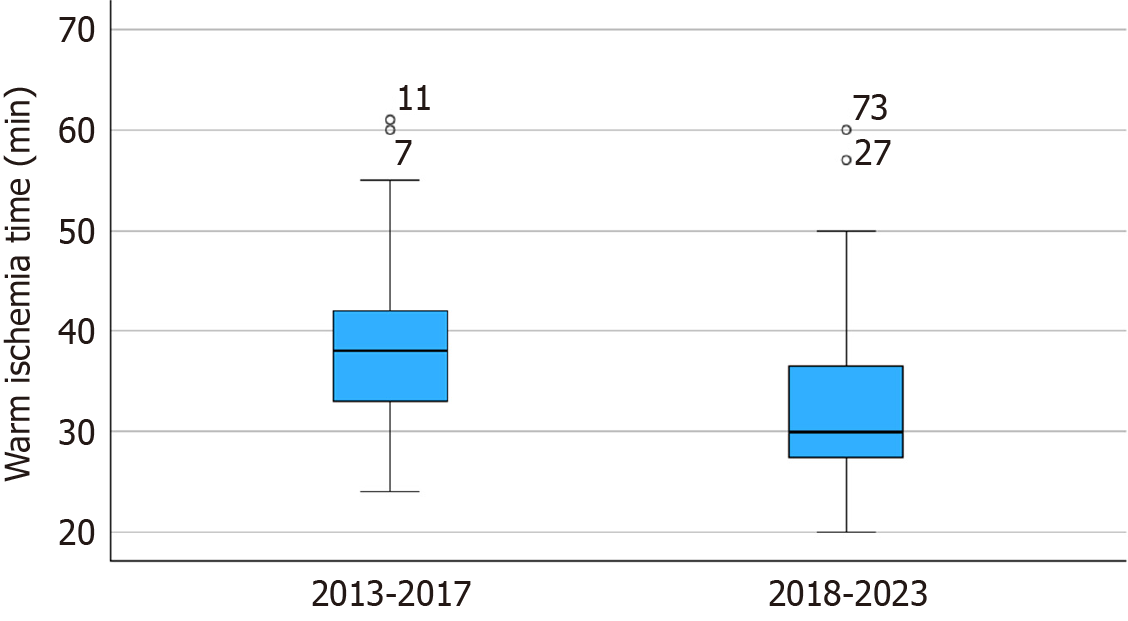
Figure 4
Box-plot of the distribution of measured warm-ischemia time in the two periods.
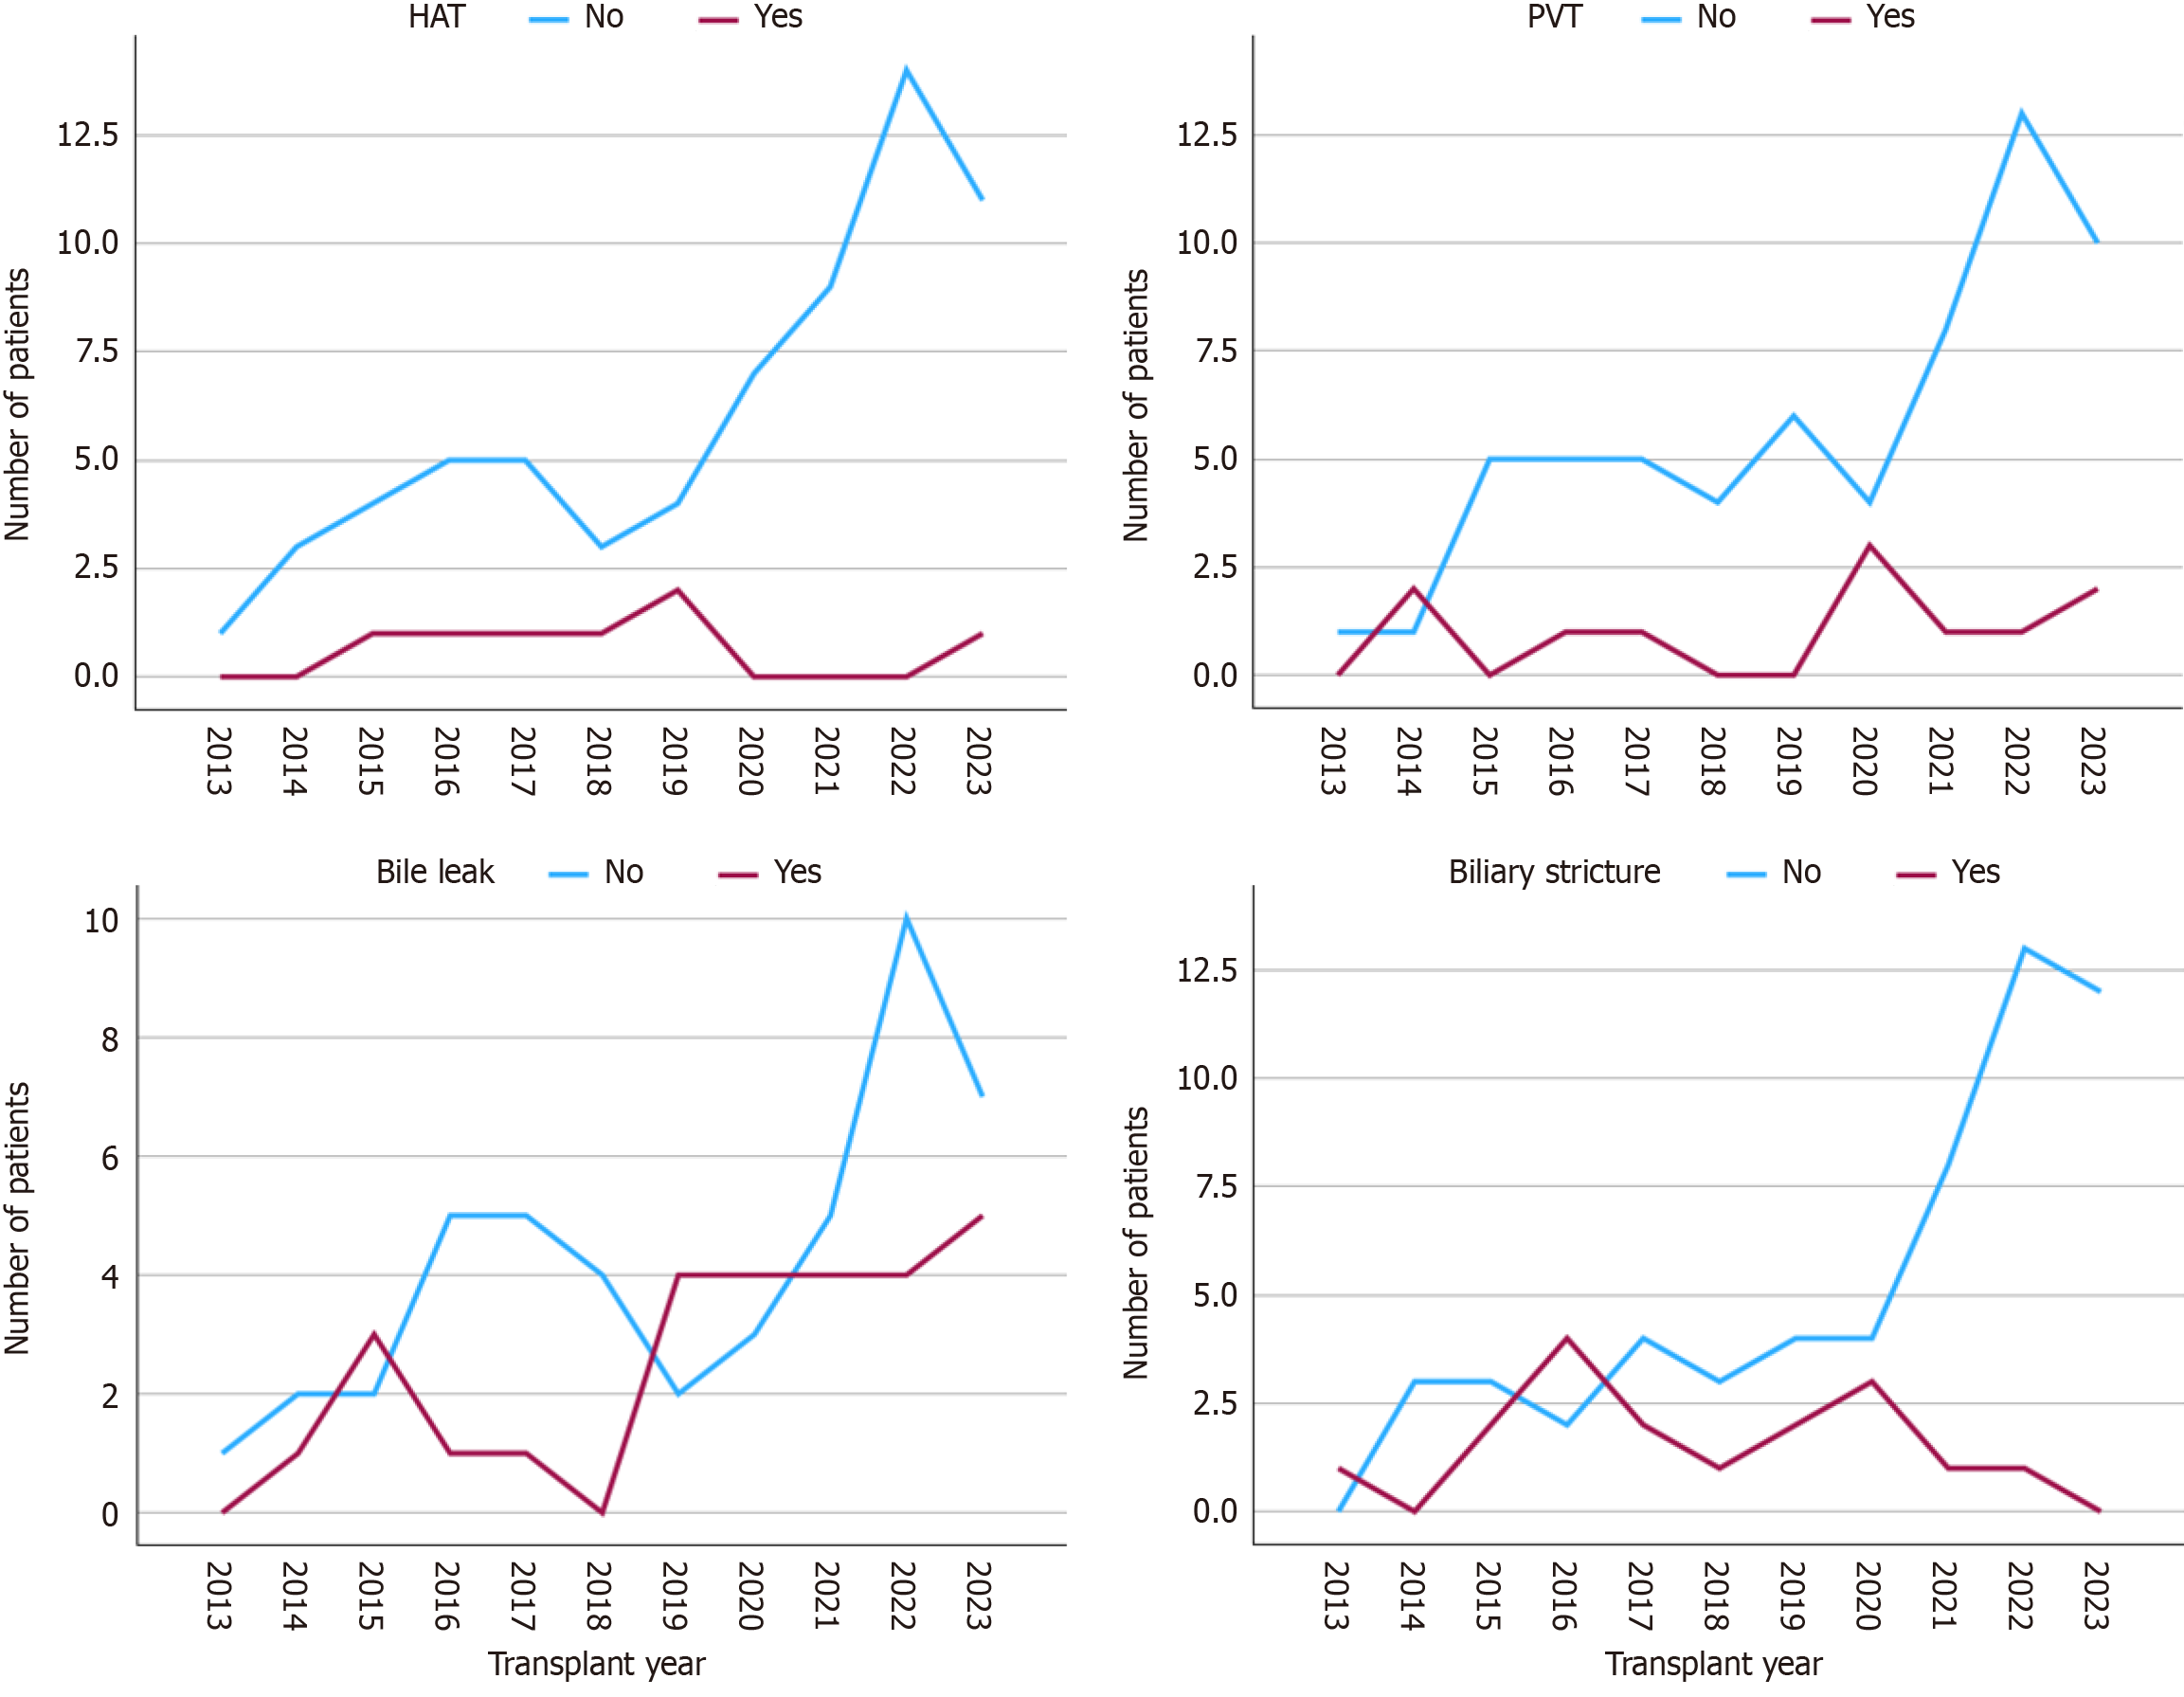
Figure 5 Frequency of surgical complications during the study period.
PVT: Portal vein thrombosis; HAT: Hepatic artery thrombosis.
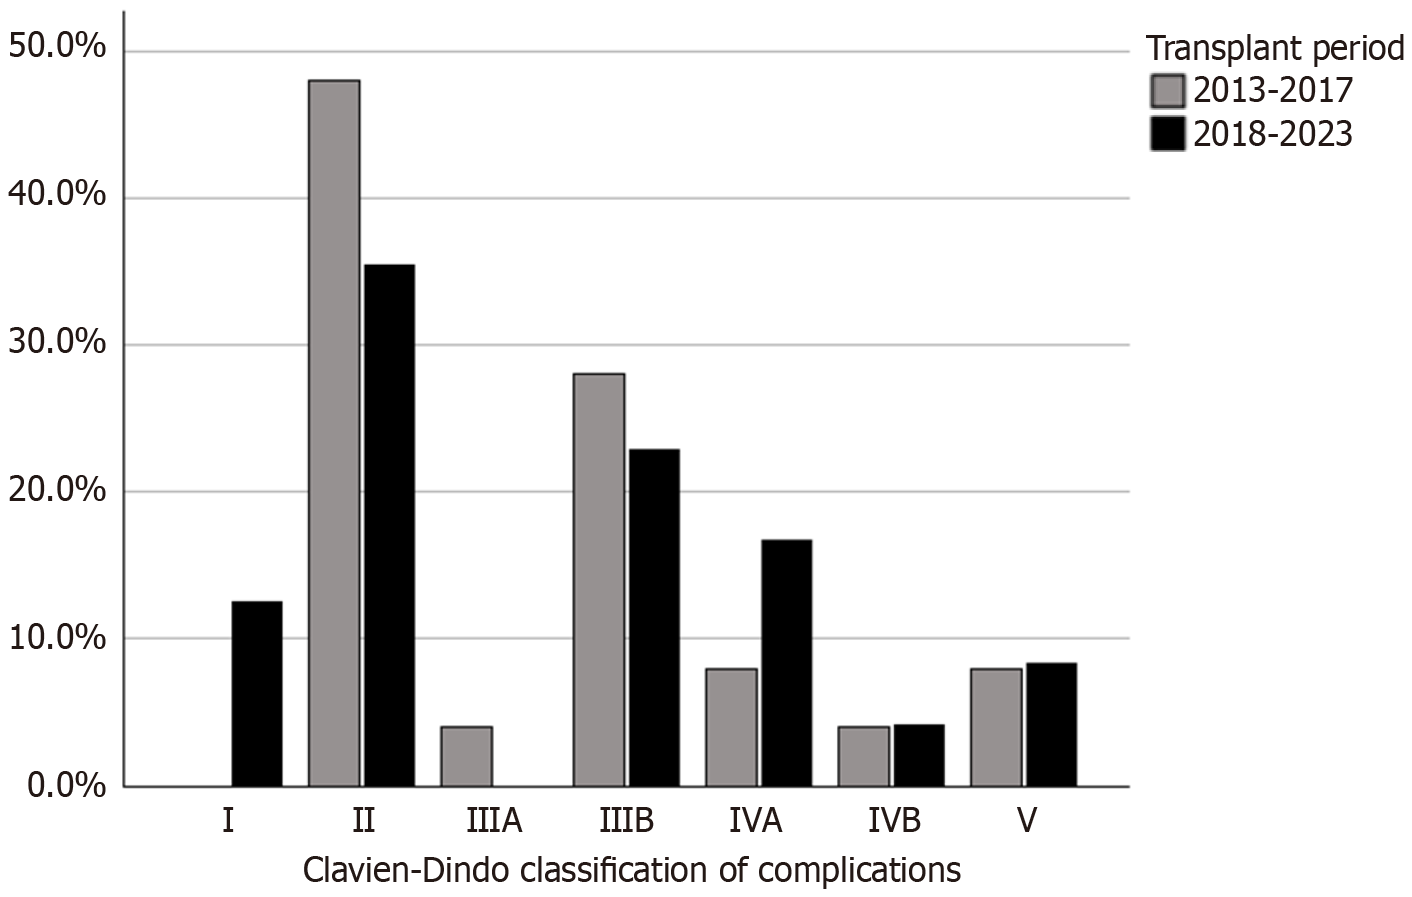
Figure 6
Post-transplant Clavien-Dindo classification of complications in the two periods.
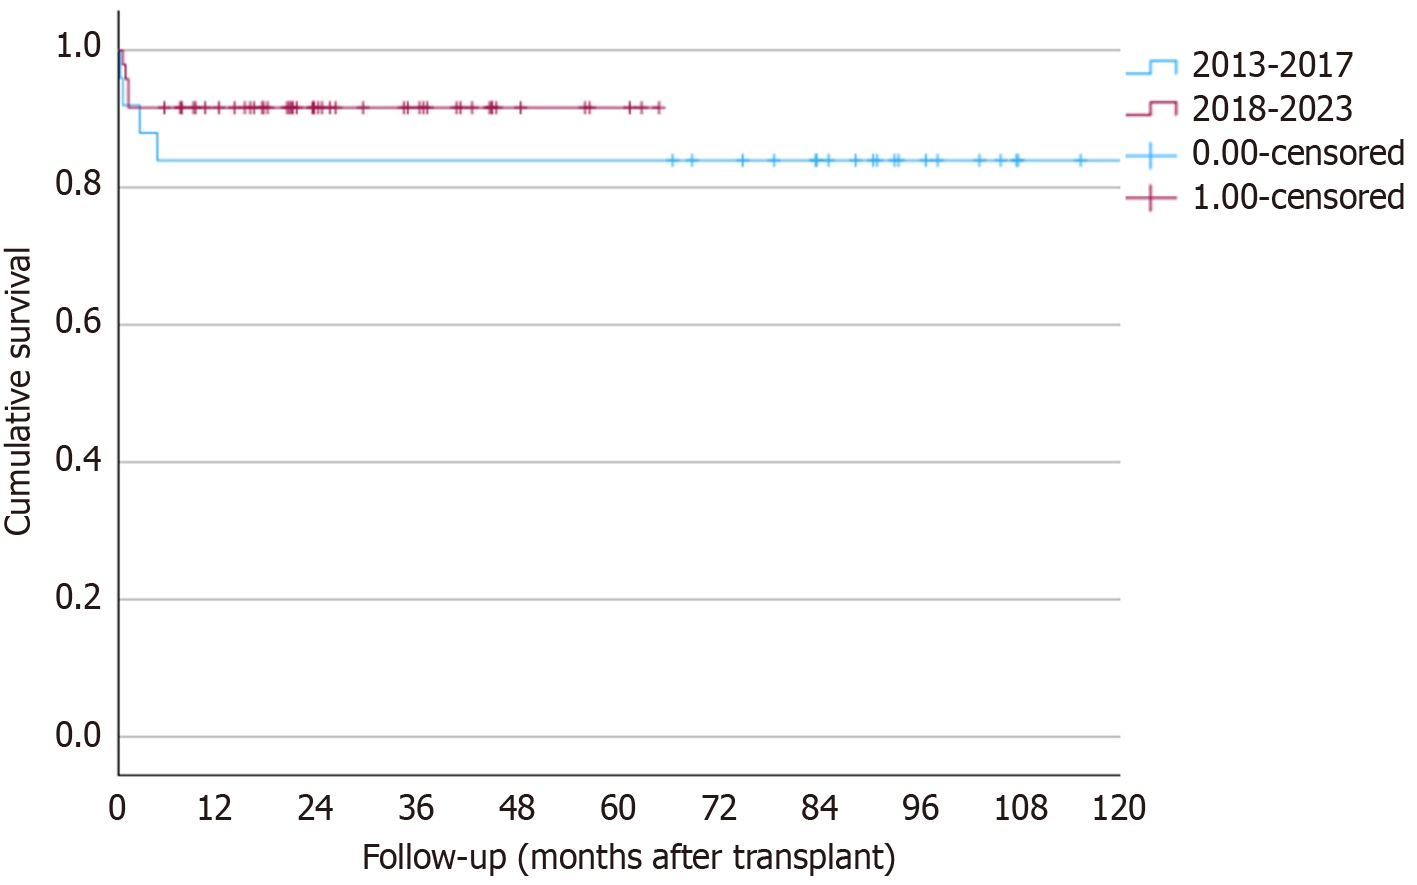
Figure 7
Patient survival after transplantation in the two periods.
- Citation: Farina Junior MA, Utz-Melere M, da Silva CS, Nader LS, Trein CS, Lucchese AM, Machry M, Mariano R, Ferreira CT, Kalil AN, Feier FH. Ten years of a pediatric living donor liver transplantation program in Brazil. World J Transplant 2025; 15(2): 98616
- URL: https://www.wjgnet.com/2220-3230/full/v15/i2/98616.htm
- DOI: https://dx.doi.org/10.5500/wjt.v15.i2.98616


