Copyright
©The Author(s) 2025.
World J Transplant. Mar 18, 2025; 15(1): 95899
Published online Mar 18, 2025. doi: 10.5500/wjt.v15.i1.95899
Published online Mar 18, 2025. doi: 10.5500/wjt.v15.i1.95899
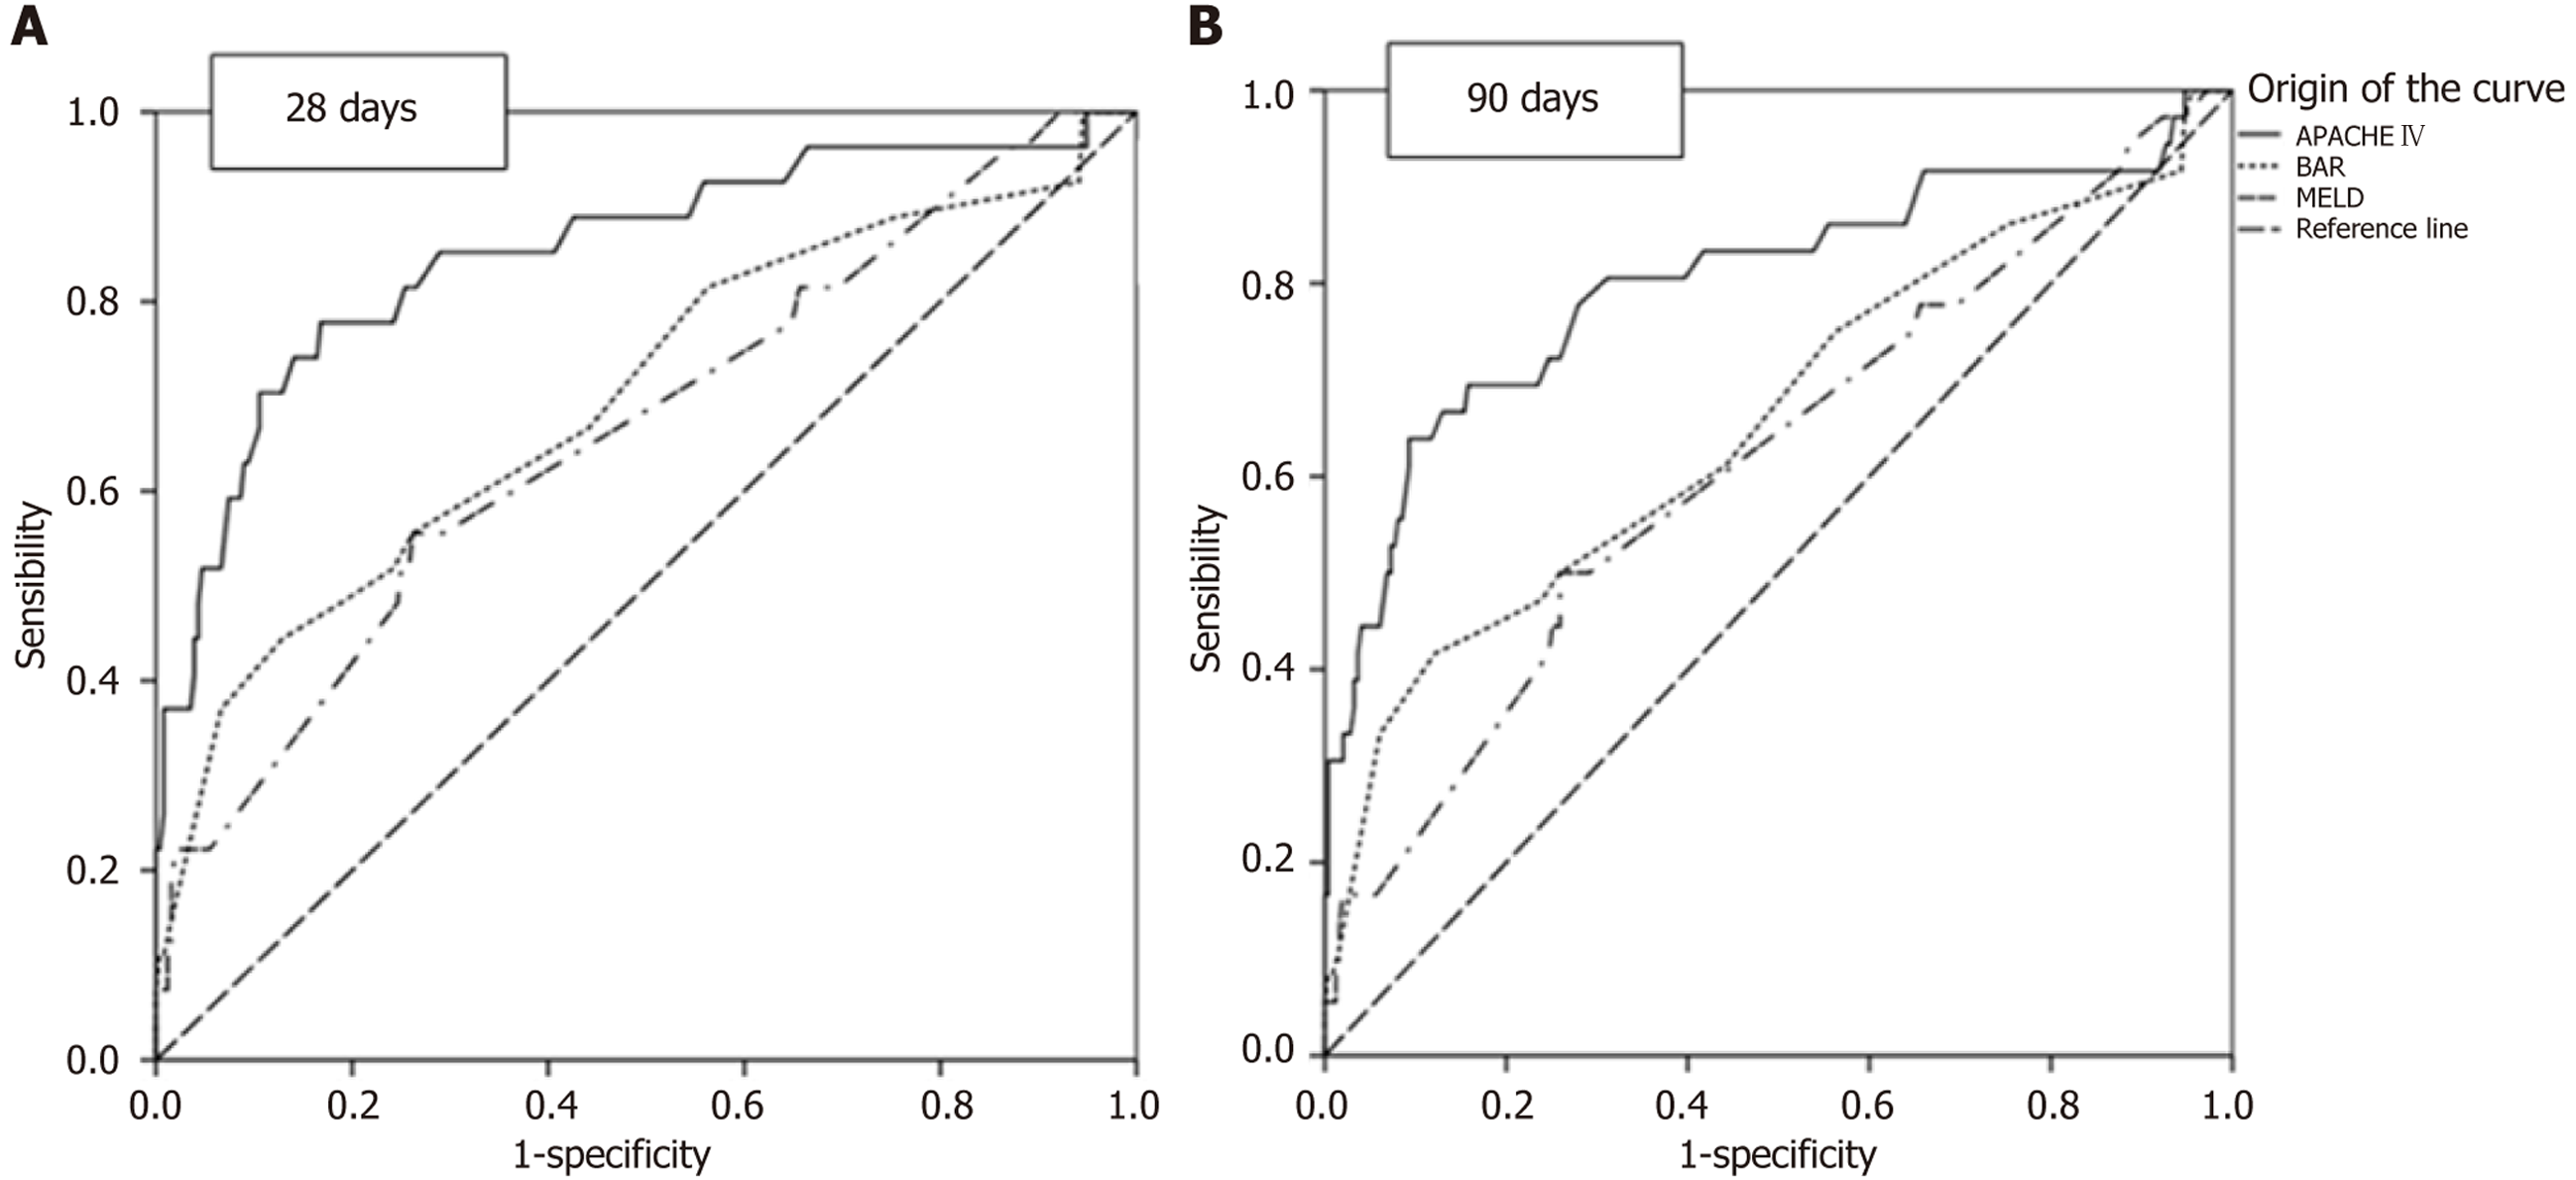
Figure 1 Areas under the curve for Acute Physiology and Chronic Health Evaluation IV, balance of risk, and model for end-stage liver disease scores considering 28 days and 90 days mortality as the outcome.
A: 28 days; B: 90 days. APACHE IV: Acute Physiology and Chronic Health Evaluation IV; BAR: Balance of risk; MELD: Model for end-stage liver disease.
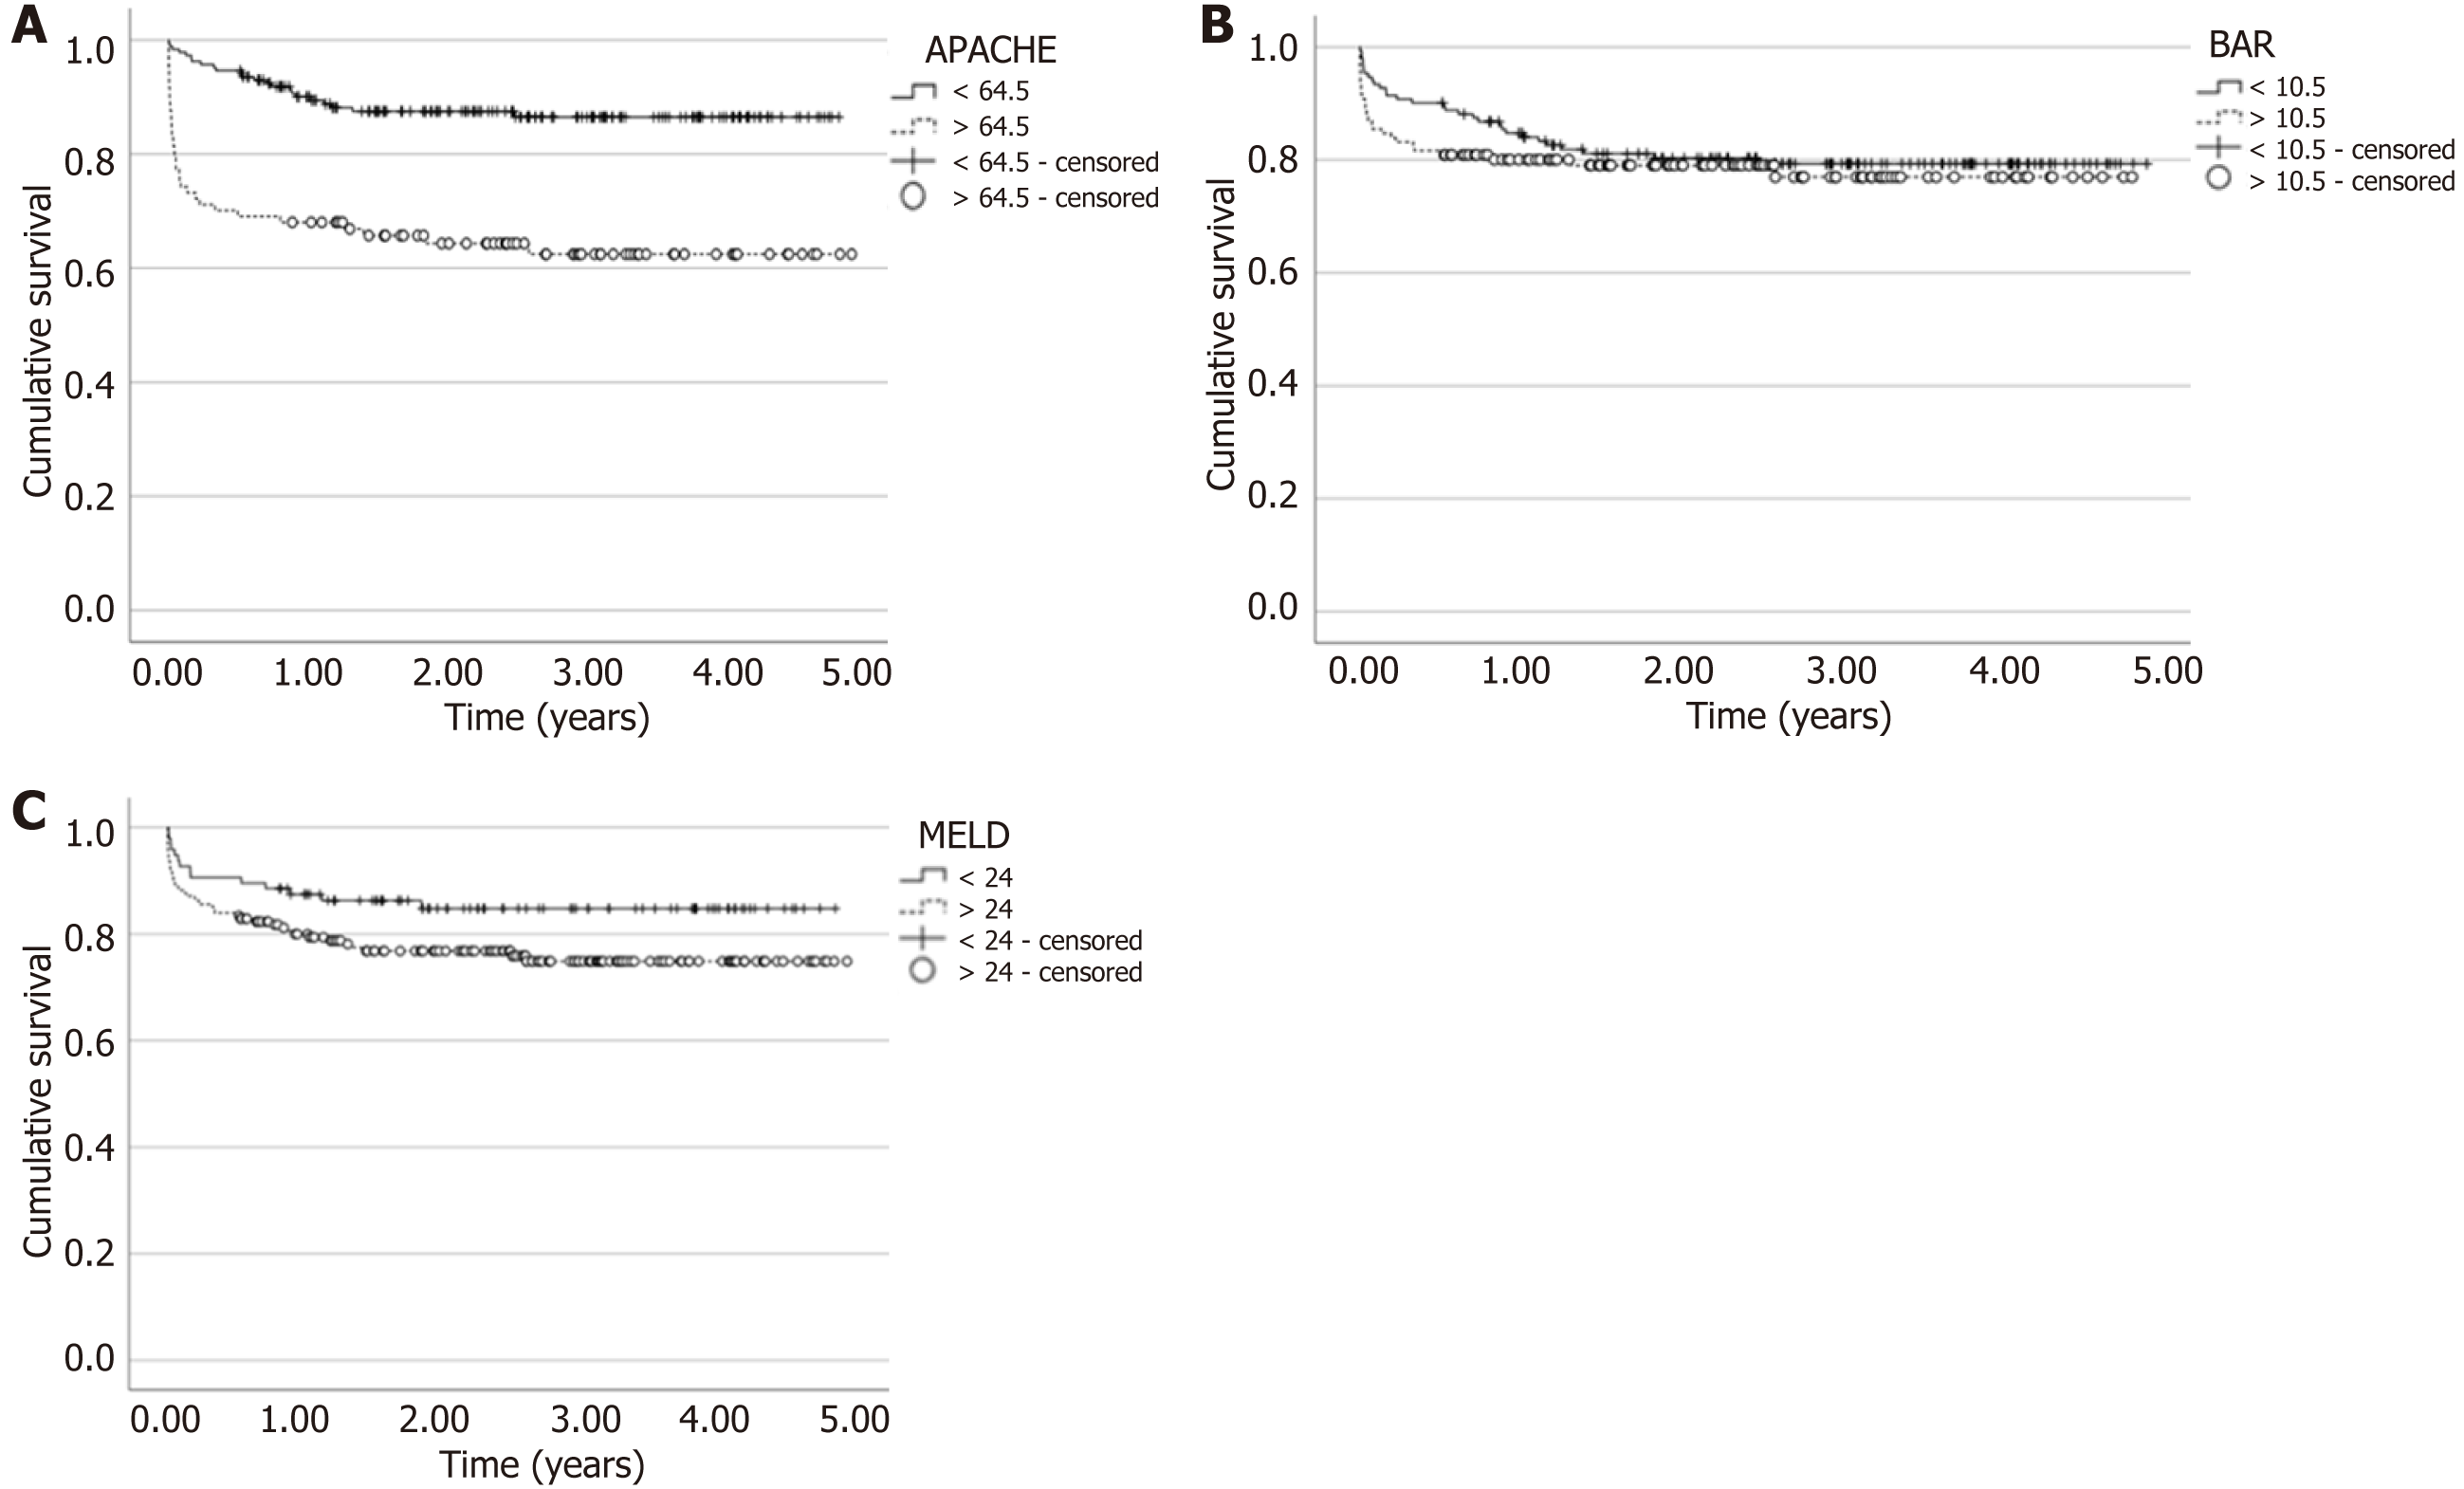
Figure 2 Cumulative survival.
A: Survival calculated for Acute Physiology and Chronic Health Evaluation IV (areas under the curve 64.5); B: Survival calculated for balance of risk (areas under the curve 10.5); C: Survival calculated for model for end-stage liver disease (areas under the curve 24). APACHE IV: Acute Physiology and Chronic Health Evaluation IV; BAR: balance of risk; MELD: Model for end-stage liver disease.
- Citation: Hohenreuther R, Silveira AT, Filho EMR, Garcez A, Lacerda BG, Fernandes SA, Marroni CA. Physiology and health assessment, risk balance, and model for end-stage liver disease scores: Postoperative outcome of liver transplantation. World J Transplant 2025; 15(1): 95899
- URL: https://www.wjgnet.com/2220-3230/full/v15/i1/95899.htm
- DOI: https://dx.doi.org/10.5500/wjt.v15.i1.95899


