Copyright
©The Author(s) 2024.
World J Transplant. Jun 18, 2024; 14(2): 90866
Published online Jun 18, 2024. doi: 10.5500/wjt.v14.i2.90866
Published online Jun 18, 2024. doi: 10.5500/wjt.v14.i2.90866
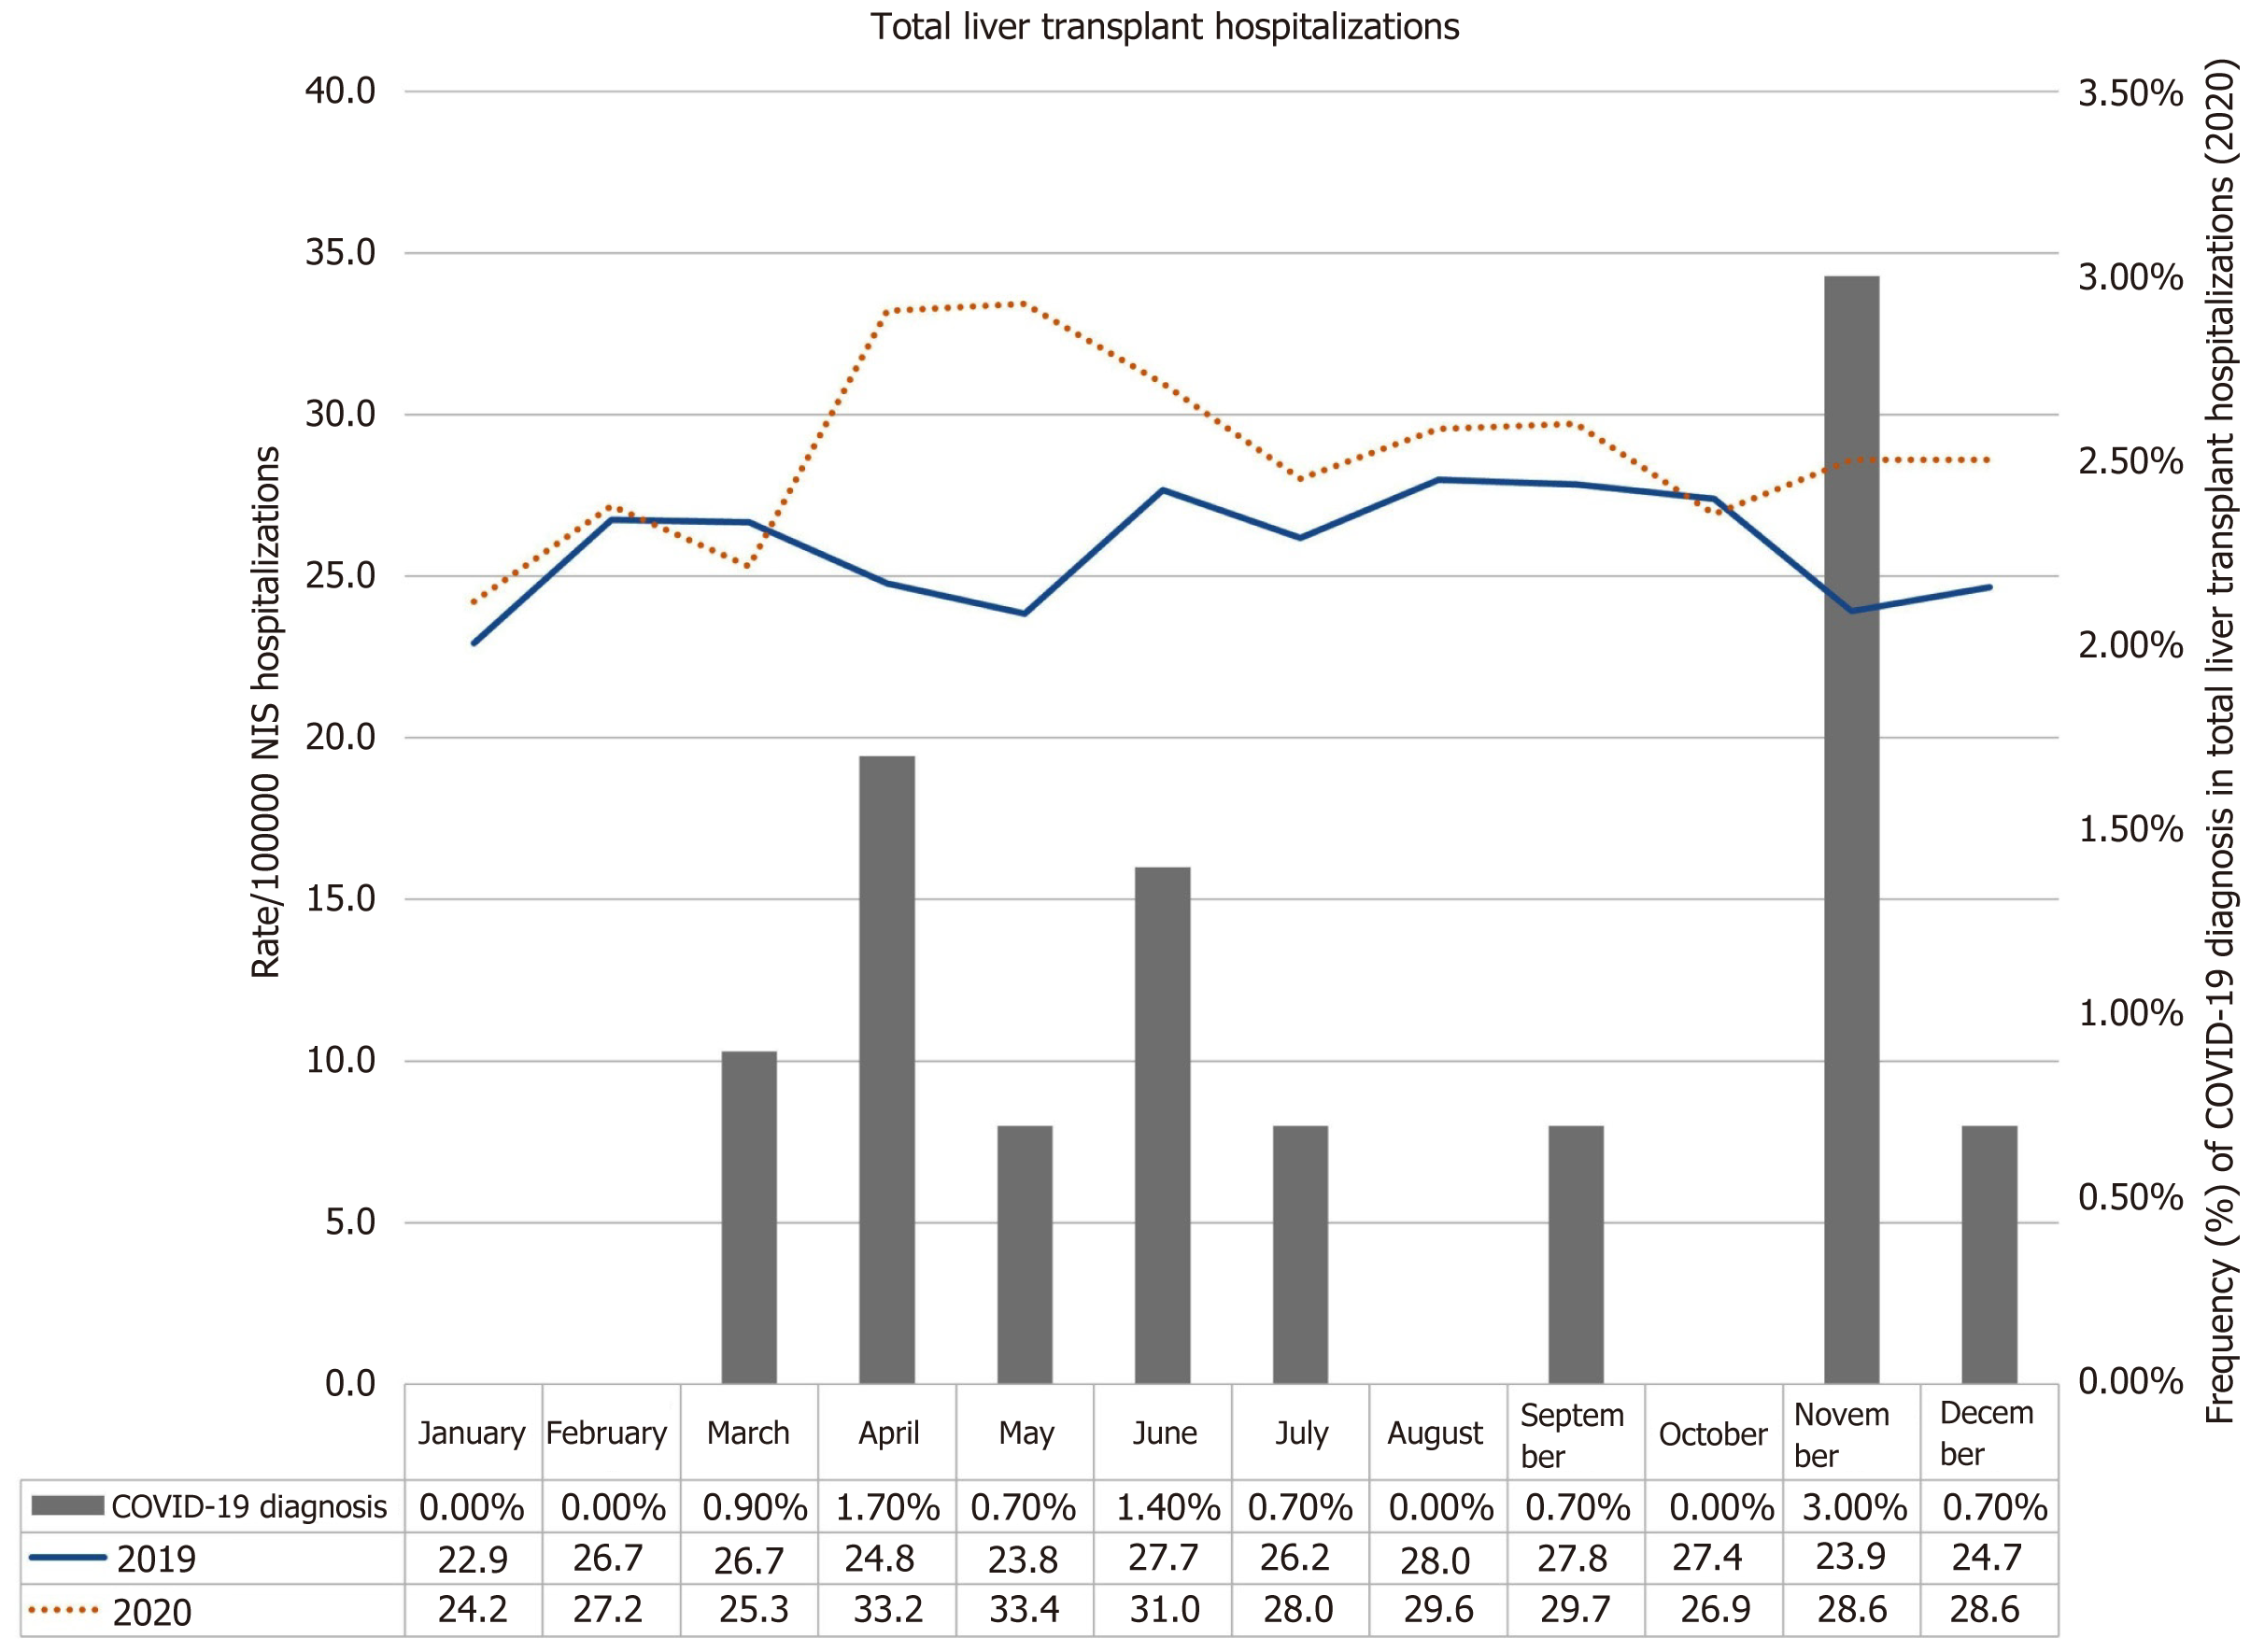
Figure 1 Monthly trend of liver transplant hospitalizations.
The solid blue and dotted orange lines represent rates of liver transplant hospitalizations per 100000 hospitalizations documented in the United States National Inpatient Sample database before and during the coronavirus disease 2019 pandemic for 2019 and 2020, respectively. The bar graph indicates the frequency (%) of coronavirus disease 2019 diagnosed in liver transplant hospitalizations in 2020. COVID-19: Coronavirus disease 2019; NIS: National Inpatient Sample.
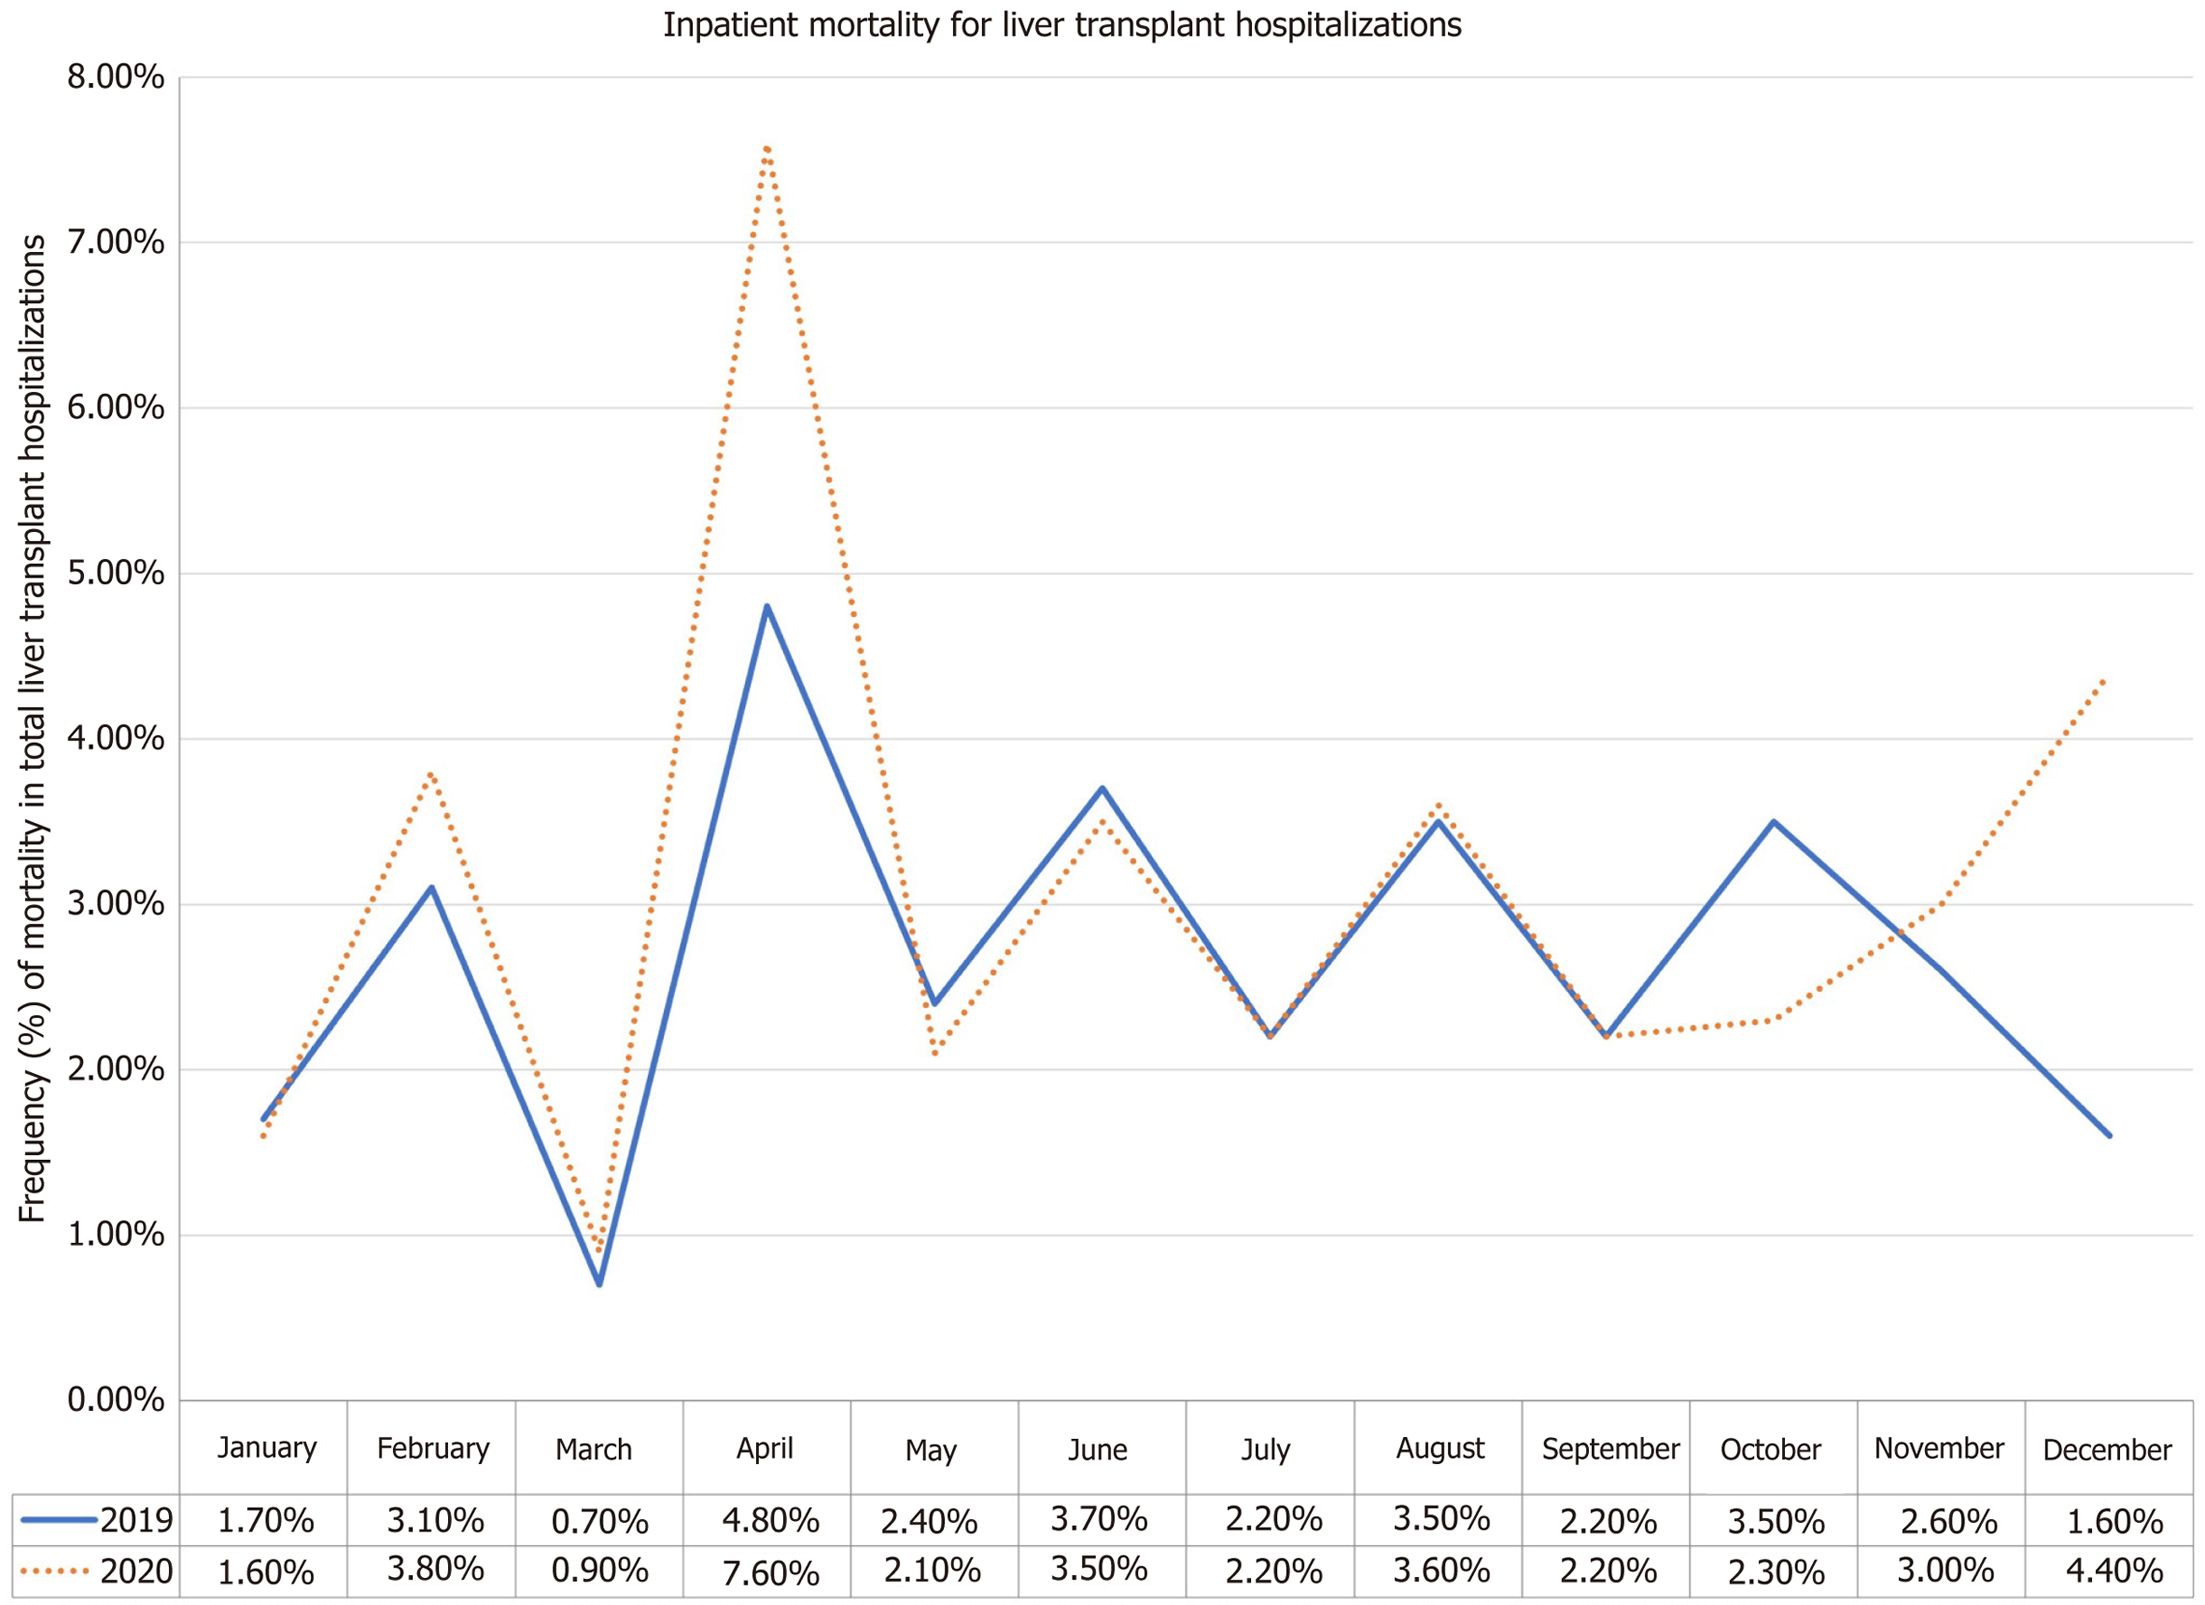
Figure 2 Monthly trends of inpatient mortality in liver transplant hospitalizations.
The solid blue and dotted orange lines represent frequency (%) of inpatient mortality in total liver transplant hospitalizations before and during the coronavirus disease 2019 pandemic for 2019 and 2020, respectively.
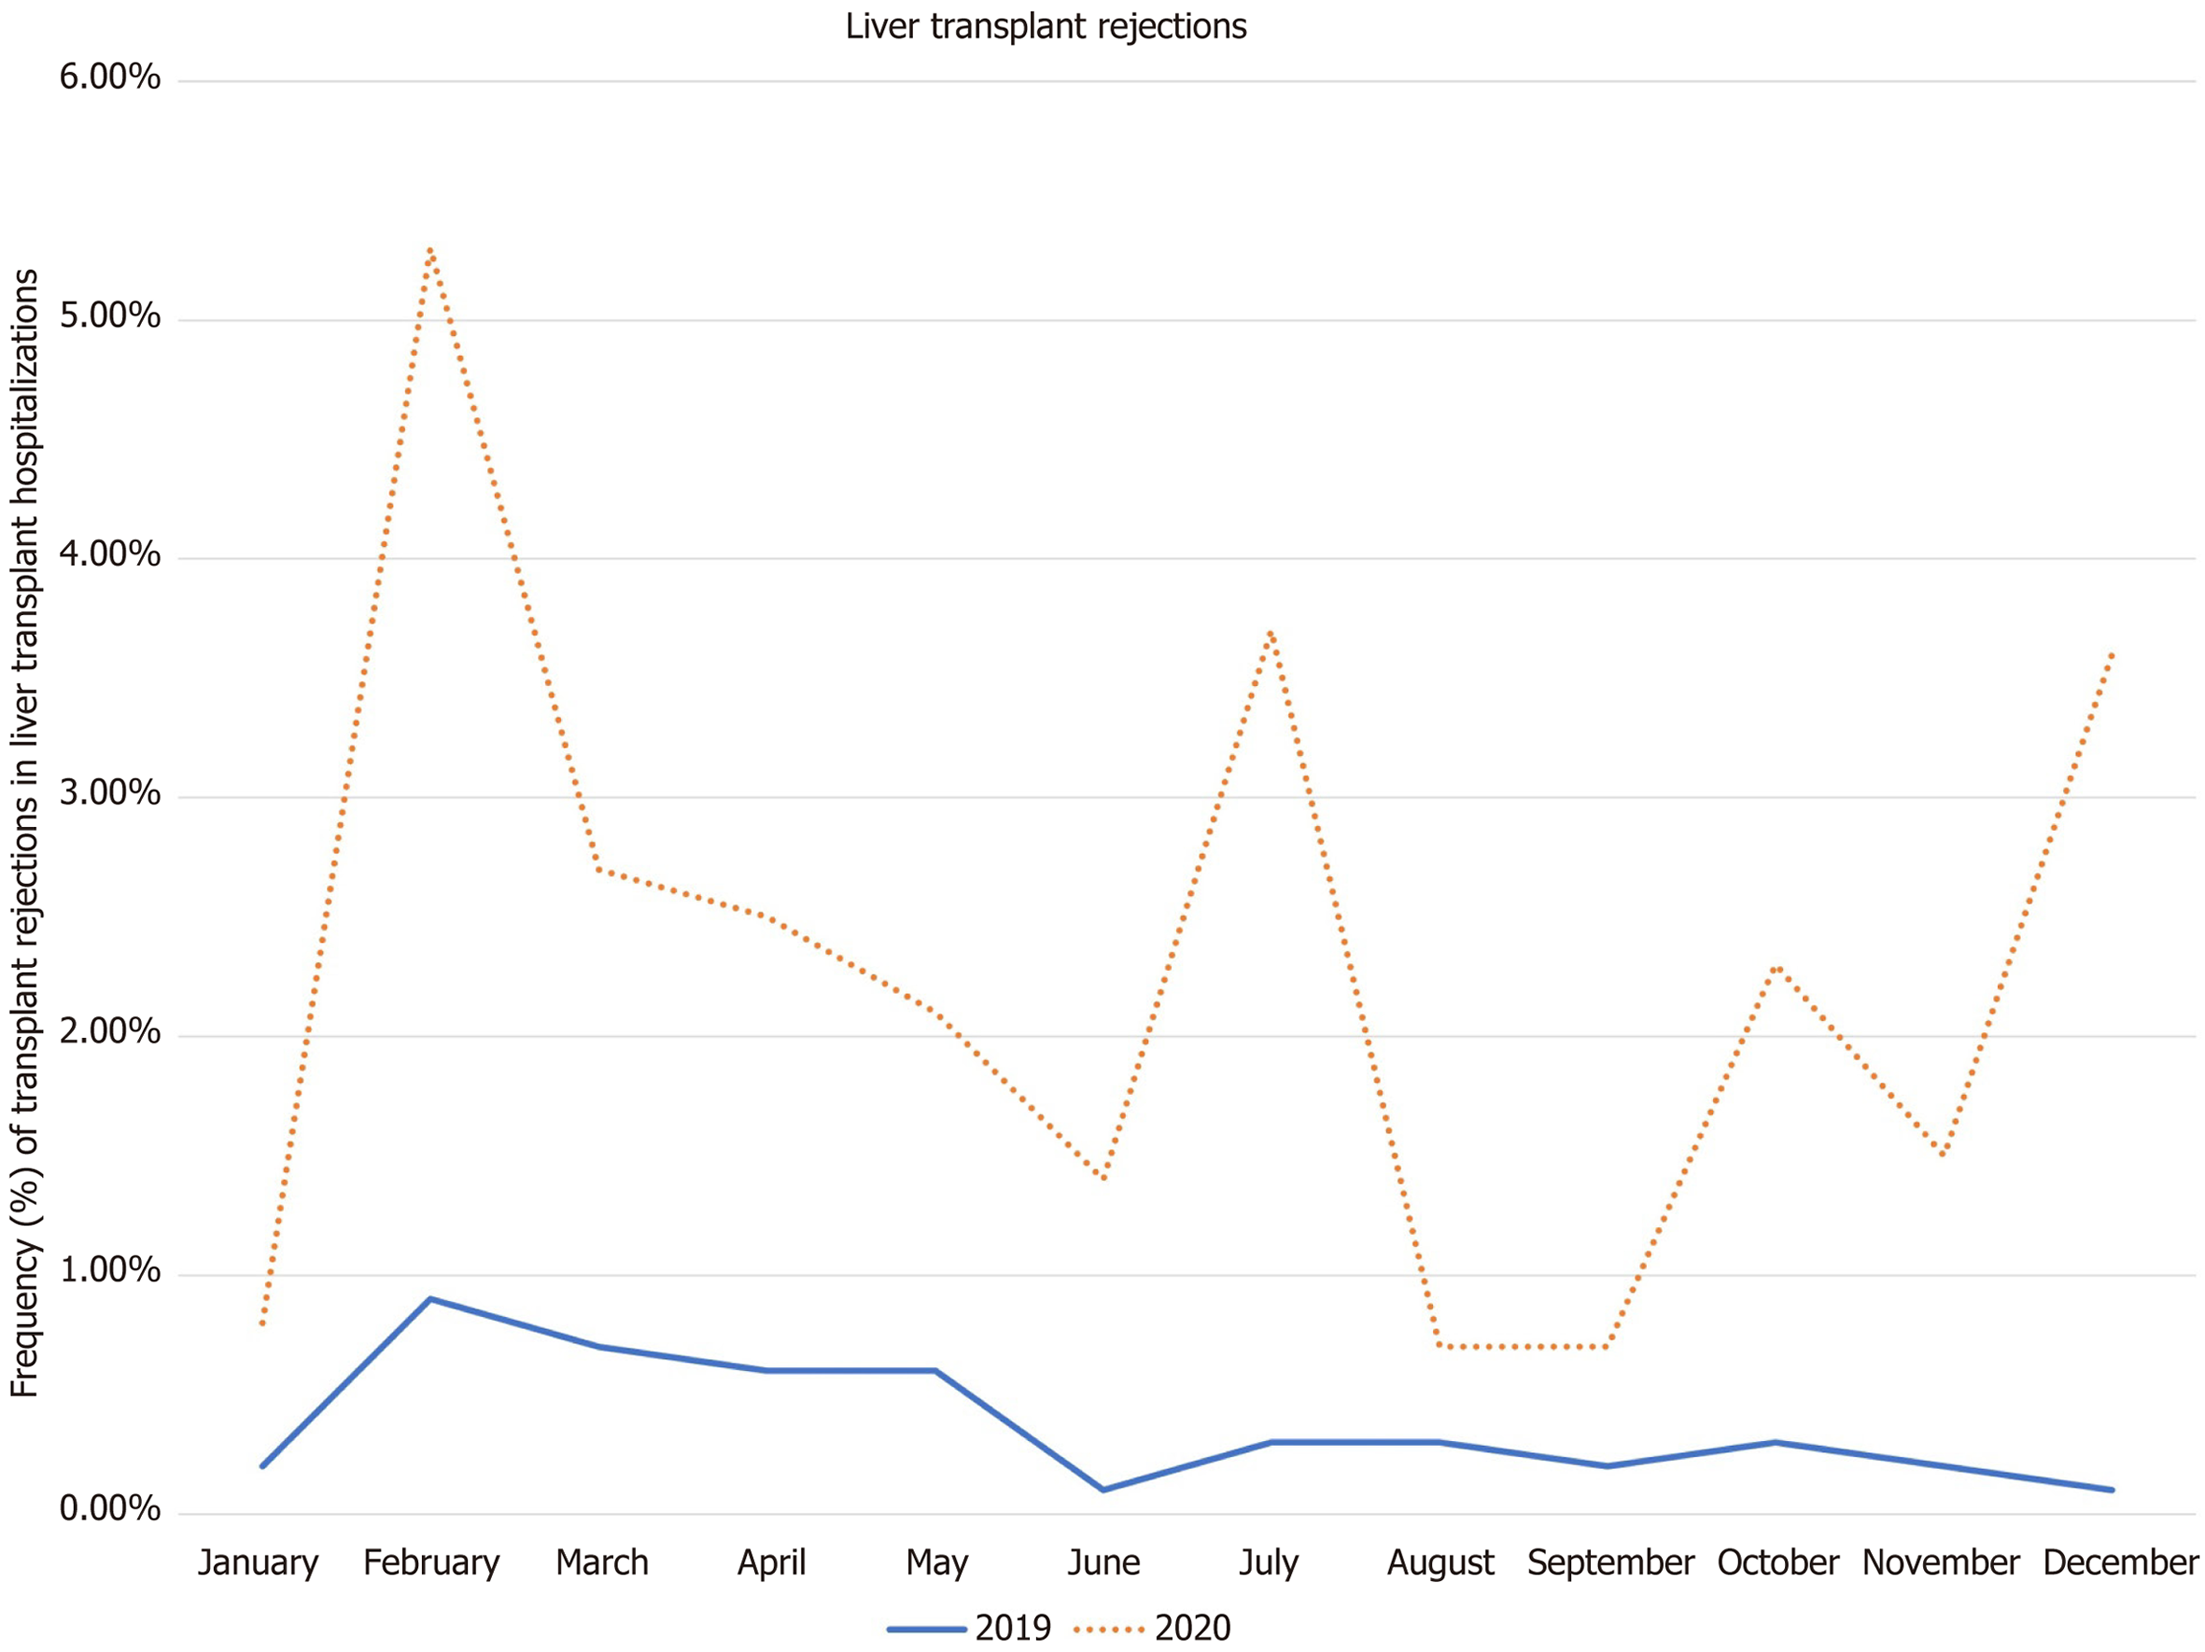
Figure 3 Monthly trends of transplant rejection in liver transplant hospitalizations.
The solid blue and dotted orange lines represent frequency (%) of transplant rejections in liver transplant hospitalizations before and during the coronavirus disease 2019 pandemic for 2019 and 2020, respectively.
- Citation: Inayat F, Patel P, Ali H, Afzal A, Tahir H, Chaudhry A, Ishtiaq R, Rehman AU, Darji K, Afzal MS, Nawaz G, Giammarino A, Satapathy SK. Impact of COVID-19 on liver transplant recipients: A nationwide cohort study evaluating hospitalization, transplant rejection, and inpatient mortality. World J Transplant 2024; 14(2): 90866
- URL: https://www.wjgnet.com/2220-3230/full/v14/i2/90866.htm
- DOI: https://dx.doi.org/10.5500/wjt.v14.i2.90866


