Copyright
©The Author(s) 2023.
World J Transplant. Dec 18, 2023; 13(6): 357-367
Published online Dec 18, 2023. doi: 10.5500/wjt.v13.i6.357
Published online Dec 18, 2023. doi: 10.5500/wjt.v13.i6.357
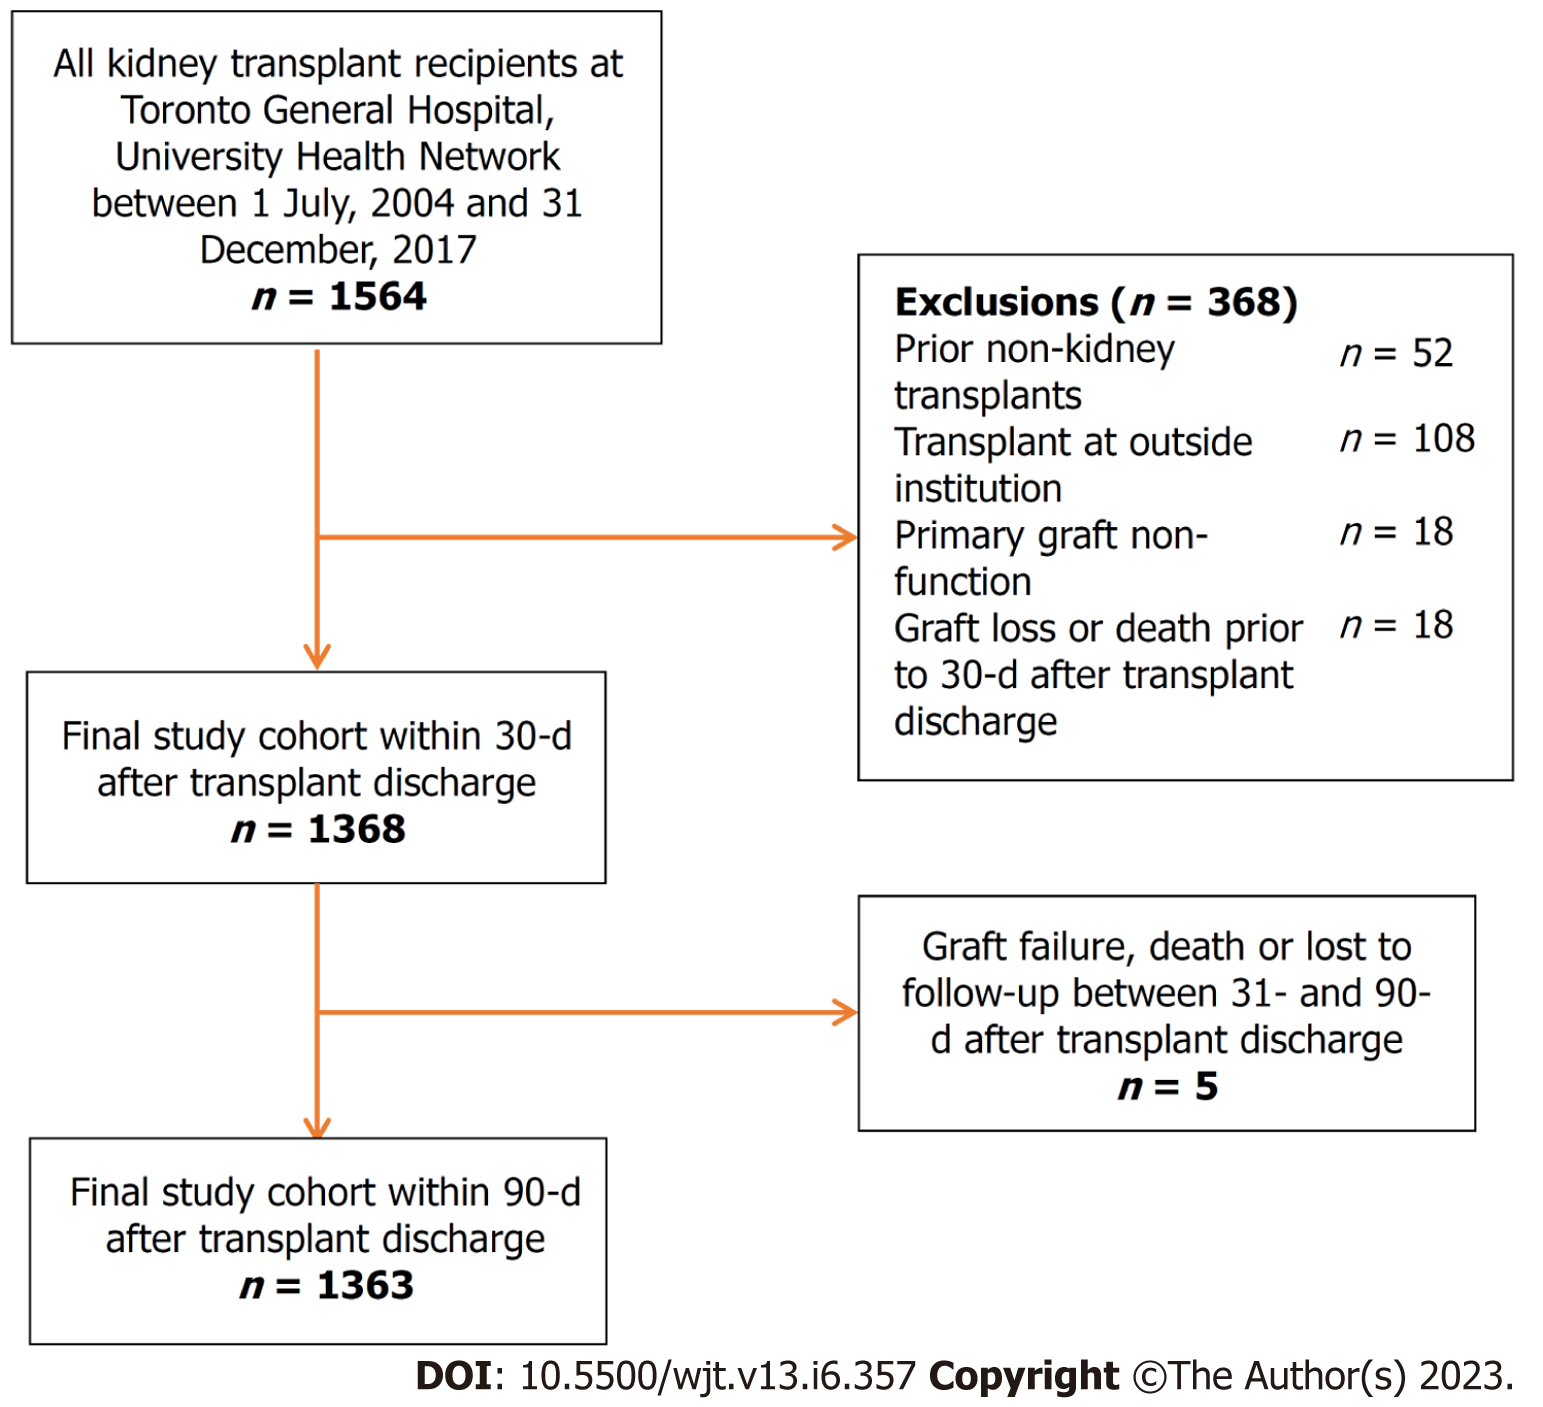
Figure 1 Study flow diagram.
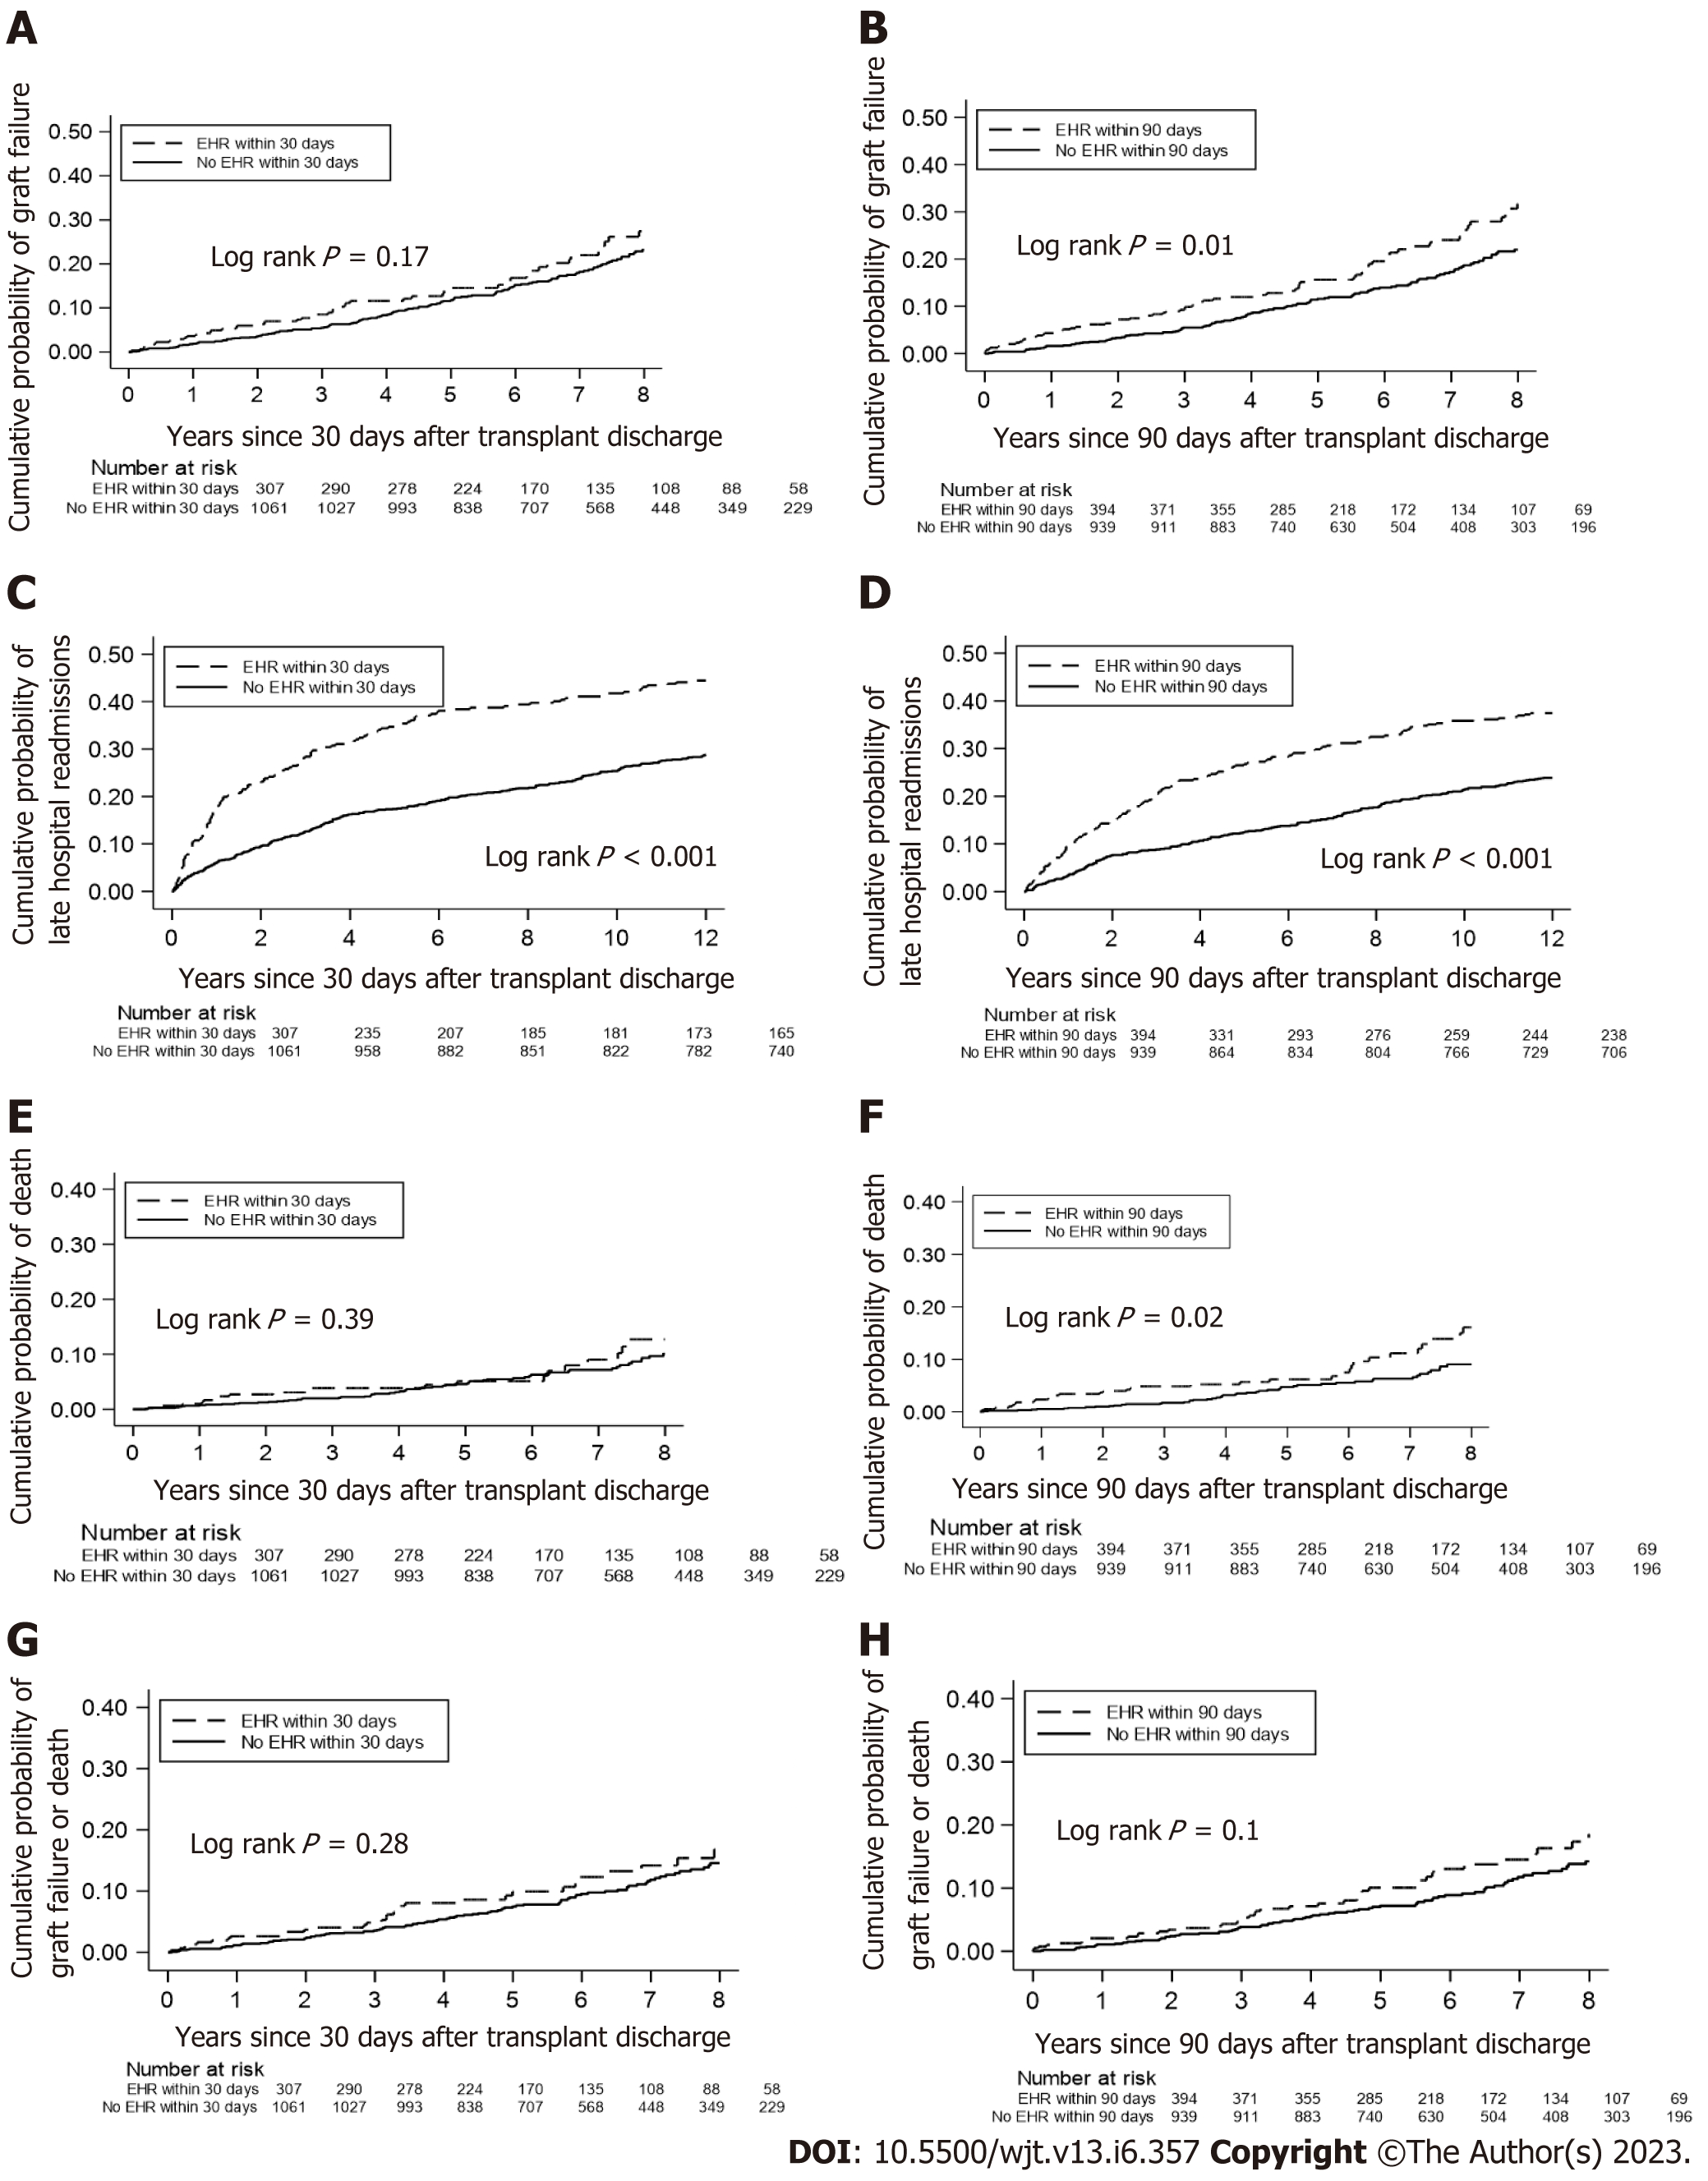
Figure 2 Cumulative probability of clinical outcomes, separated by early hospital readmission status, over 5 years of follow up.
A: Graft failure for 30-d early hospital readmission (EHR) group; B: Graft failure for 90-d EHR; C: Late hospital readmissions for 30-d EHR; D: Late hospital readmissions for 90-d EHR: E: Death for 30-d EHR; F: Death for 90-d EHR; G: Composite of graft failure and death for 30-d EHR; H: Composite of graft failure and death for 90-d EHR.
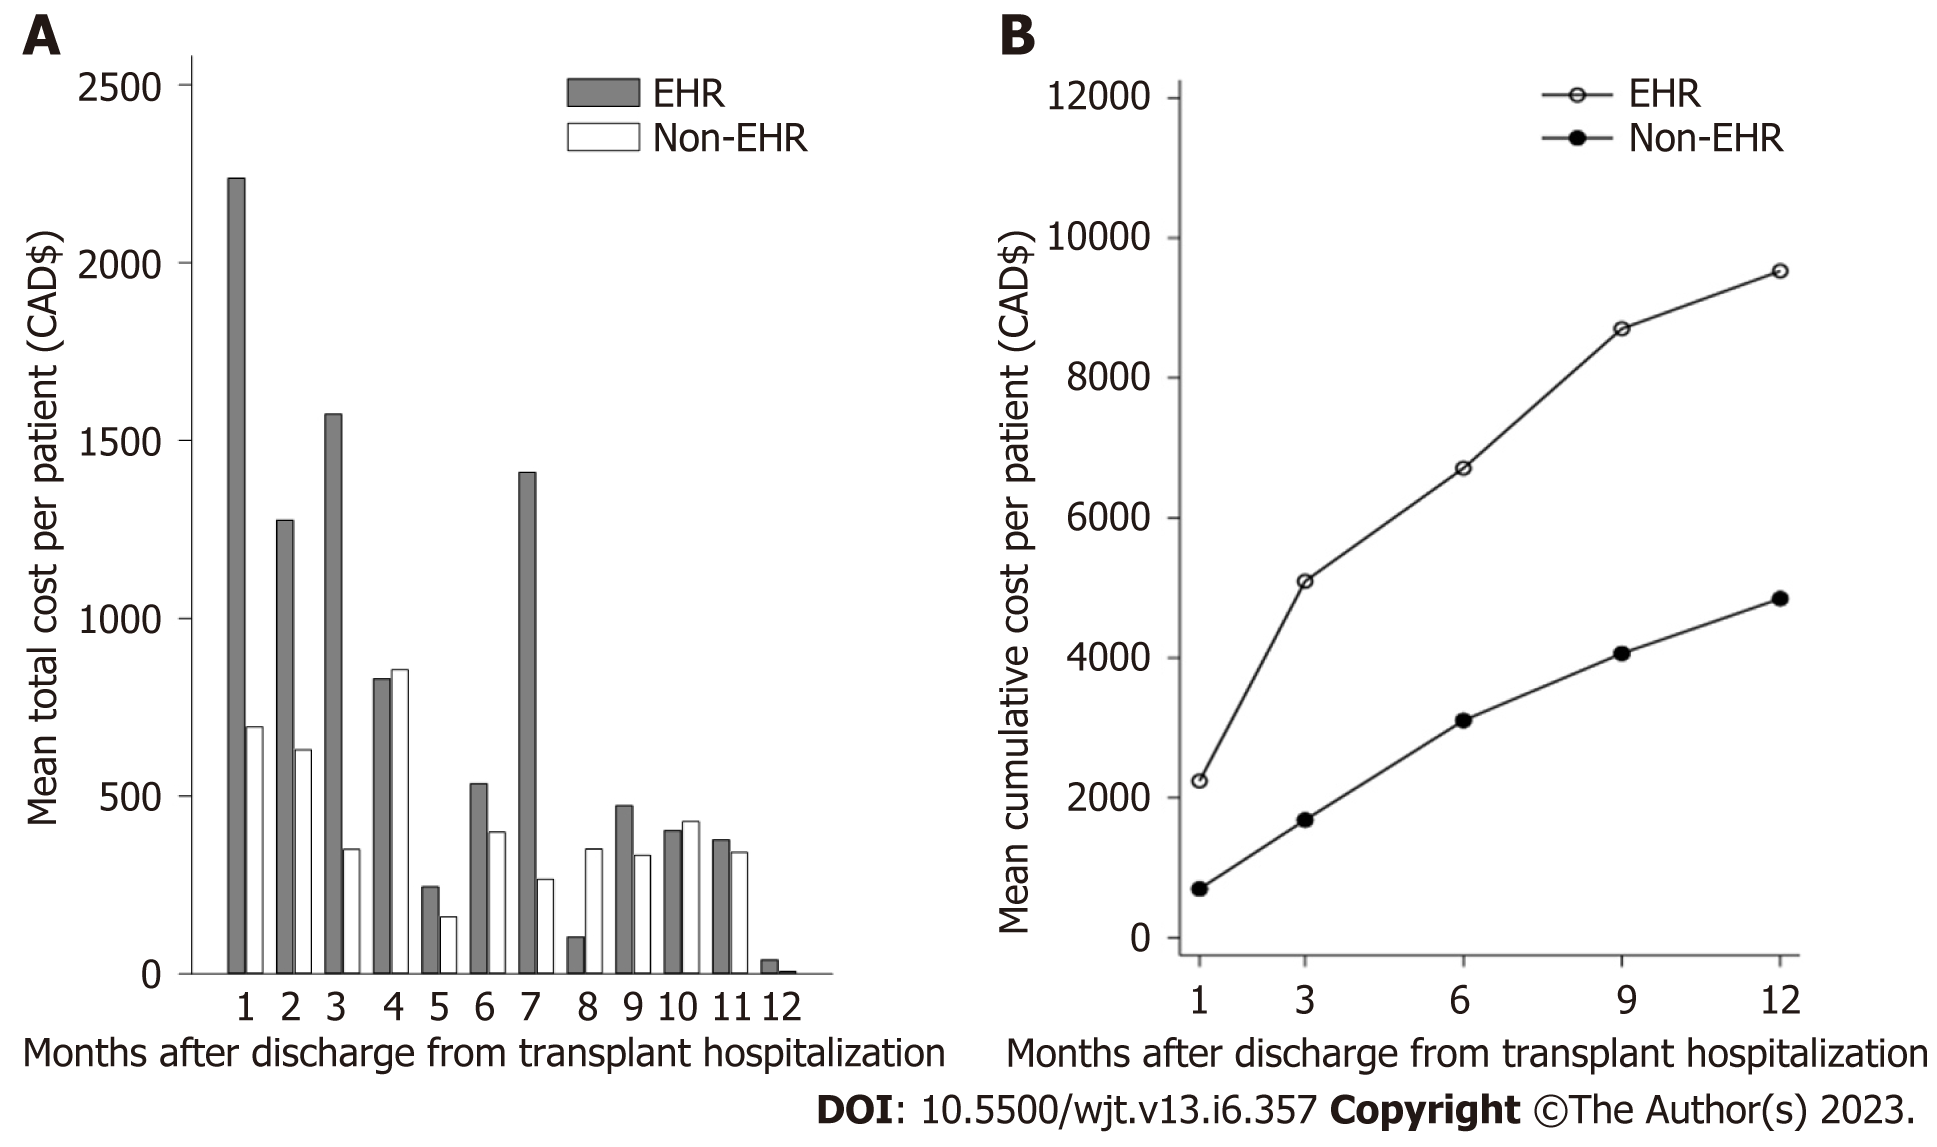
Figure 3 Costs of hospital-based care per kidney transplant recipient over 1-year after transplant discharge.
A: Mean cost of hospital-based care per kidney transplant recipient per month; B: Cumulative cost of hospital-based care over 1-year after transplant discharge. EHR: Early hospital admission.
- Citation: Famure O, Kim ED, Li Y, Huang JW, Zyla R, Au M, Chen PX, Sultan H, Ashwin M, Minkovich M, Kim SJ. Outcomes of early hospital readmission after kidney transplantation: Perspectives from a Canadian transplant centre. World J Transplant 2023; 13(6): 357-367
- URL: https://www.wjgnet.com/2220-3230/full/v13/i6/357.htm
- DOI: https://dx.doi.org/10.5500/wjt.v13.i6.357


