


Published online Mar 19, 2025. doi: 10.5498/wjp.v15.i3.100112
Revised: November 2, 2024
Accepted: January 10, 2025
Published online: March 19, 2025
Processing time: 201 Days and 21 Hours
Many patients with coronavirus disease 2019 (COVID-19) may experience emotional issues and cognitive impairment. However, it remains unclear whether the brain mediates the impact of COVID-19 on the emergence of psychopathological symptoms. It remains unclear whether anxiety and depression are caused by stressors or viral infection.
To use functional near-infrared spectroscopy (fNIRS) to detect cortical hemody
A total of 58 subjects, comprising 29 patients with first acute COVID-19 infection and 29 healthy controls without COVID-19 infection and without anxiety or depression were recruited. Then cortical activation during the performance of the verbal fluency test (VFT) and brain connectivity during the resting state (rs) were evaluated by 53-channel fNIRS. For the COVID-19-infected group, Patient Health Questionnaire-9 (PHQ-9) and General Anxiety Disorder-7 (GAD-7) were used to assess the emotional state before fNIRS measures.
For the rs, compared to the uninfected group, the infected group exhibited lower rs functional connectivity (FC) in the dorsolateral prefrontal cortex (DLPFC), which was correlated with both the PHQ score and GAD score. During the VFT, the infected group exhibited significantly lower cortical activation than the uninfected group in both Broca-left and Broca-right. Besides, the integral value in the DLPFC-L showed a significant negative correlation with the PHQ-9 score during the VFT in the infected group.
There were significant differences in the bilateral Broca area and DLPFC between the COVID-19-infected and uninfected groups, which may be the reason why COVID-19 infection impairs cognitive function and language function and leads to psychiatric symptoms. In addition, the rsFC in patients with COVID-19 was positively correlated with the severity of depression and anxiety, which may be related to the fact that the mental symptoms of patients with COVID-19 are characterized by depression and anxiety, rather than depression or anxiety alone. Our study provides evidence that the psychological and emotional issues caused by COVID-19 are not only due to external social factors but also involve more direct brain neural mechanisms and abnormal neural circuits, which also provide insights into the future treatment and prognosis of individuals with COVID-19.
Core Tip: Our study provides evidence that the psychological and emotional issues caused by coronavirus disease 2019 (COVID-19) are not only due to external social factors but also involve more direct brain neural mechanisms and abnormal neural circuits. Specifically, COVID-19 infection damages the bilateral Broca area and the dorsolateral prefrontal cortex, thus affecting cognitive function and causing mood symptoms. In our study, patients with acute COVID-19 infection were included to rule out the effects of stressors on mood symptoms, and the functional near-infrared spectroscopy data of the resting state and task state confirmed each other.
- Citation: Ma WJ, Yuan RC, Peng ZY, Wu Q, Al-Matary M, Yang HS, Cheng P, Zhao GJ, Lu CC, Zhang YX, Hong JK, Li WH. Mood symptoms, cognitive function, and changes of brain hemodynamics in patients with COVID-19: A functional near-infrared spectroscopy study. World J Psychiatry 2025; 15(3): 100112
- URL: https://www.wjgnet.com/2220-3206/full/v15/i3/100112.htm
- DOI: https://dx.doi.org/10.5498/wjp.v15.i3.100112
The global coronavirus disease 2019 (COVID-19) pandemic has had profound implications for public health, leading to substantial morbidity and mortality, as well as a range of health concerns including mental disorders and impairment of cognitive function. Affective disorders, especially anxiety and depression (A&D), are the main psychiatric manifestations in patients infected with coronavirus[1]. Some researchers think it may be because of the implementation of lockdowns, social restrictions, loss of loved ones, job loss, life changes, and many other problems[2]. These changes dramatically increased stressors[2]. However, some studies have shown that, for COVID-19 infection, neural manifestations may occur simultaneously with respiratory symptoms or even after a few months of patient recovery[3], suggesting that the appearance of these symptoms may be a consequence of the viral infection[4]. The emergence of neuropsychiatric symptoms caused by COVID-19 infection is believed to involve the overproduction of proinflammatory cytokines (cytokine storm)[5] and increased permeability of the blood-brain barrier[6], which triggers the neuroinflammatory process. However, it remains unclear whether the brain mediates the impact of COVID-19 on the emergence of psychopathological symptoms. Whether A&D are caused by stressors or viral infection is still debated.
Our research hypothesis posits that cognitive dysfunction and emotional issues in patients following infection are not solely attributable to external factors. Instead, we propose that the infection may affect specific regions of the brain, leading to decreased functional connectivity (FC), which in turn manifests as A&D and cognitive impairment. Consequently, we intend to utilize functional near-infrared spectroscopy (fNIRS) alongside relevant cognitive tasks to assess the brain function of patients infected with COVID-19.
fNIRS is a non-invasive, functional neuroimaging technique that assesses brain function by quantifying cerebral oxygenation at the microvasculature level. This technology has been used for the evaluation of cerebral function and extends to the clinical field of psychiatry, as one of the objective modalities for probing psychoses[7]. Task-based and resting state (rs) fNIRS have been widely utilized to explore brain cognitive functions[8,9].
The rs is a natural condition in which there is neither overt perceptual input nor behavioral output. RsFC reflects baseline, spontaneous, and instinct activity, and the functional network of the brain[10]. Due to its convenience and comparability across different studies and its reflection of spontaneous brain activity, the rs is becoming a vital experimental paradigm to study brain function[11]. Compared to healthy controls (HCs), atypical patterns of rsFC have been shown to be pathological manifestations of many brain disorders such as schizophrenia, autism spectrum disorders, Alzheimer’s disease, Parkinson’s disease, epilepsy[12], and affective disorders[13,14]. However, only a few fNIRS studies have focused on the rsFC in affective disorders. By using a two-channel fNIRS, a group of researchers measured the spontaneous oscillation of hemodynamic changes in the prefrontal cortex (PFC) of HCs, and the results revealed that participants with higher anxiety levels showed more right-dominant activities in the rs[15]. A recent study measured the superior and middle frontal lobe and the postcentral area of the brain, and revealed that compared to HCs, older depressed patients showed significant differences in FC both at rest and during the task performance, and depressed subjects showed increased FC in the left frontoparietal cortical network at rest[16].
A task-based activity refers to neural pathways of the brain to specific stimuli, such as executive function and emotion[17]. The fNIRS has been utilized by numerous laboratories to design task models. At present, the most widely used cognitive task is the verbal fluency test (VFT)[18], because this test is easy to administer and requires little time, equipment, and space[19]. The combined use of fNIRS with the VFT has been applied to psychiatric research for many years[20], and has been proven to distinguish healthy individuals from those with major psychiatric disorders[21] and differentiate psychiatric disorders[19].
In the present study, we used fNIRs to investigate the neural response of the VFT associated with executive function and FC in rs networks in patients infected with COVID-19 and their relationship with mental symptoms (mainly depression and anxiety), to understand the effects of COVID-19 on brain function.
A total of 65 subjects were initially recruited, but 7 of them were excluded due to poor data quality or obvious head movement during fNIRS data collection; therefore, only 58 subjects were included in the data analysis. Twenty-nine subjects (10 males and 19 females, mean age = 42.66 ± 13.19 years) with acute COVID-19 infection were recruited at the Second Xiangya Hospital of Central South University (Changsha, China). The inclusion criteria were as follows: (1) First-time infection with COVID-19, and in the acute infection period. All of them were diagnosed by at least one experienced clinician based on positive real-time reverse transcription polymerase chain reaction assay of throat swabs as well as other physiological and biochemical imaging indicators; and (2) Age between 20 and 60 years. Twenty-nine HCs (11 males and 18 females, mean age = 41.48 ± 9.55 years) were recruited from the local community, and they had no history of COVID-19 infection. The HC group and COVID-19-infected group were matched in age, sex, and years of education. All subjects had no history of psychiatric disorders, cognitive disorders, neurological disease, or brain injury. Additionally, for the COVID-19-infected group, the Patient Health Questionnaire-9 (PHQ-9)[22] and General Anxiety Disorder-7 (GAD-7)[23] were used to assess the emotional state before fNIRS measures. The HCs underwent mental health evaluation using the Symptom Checklist-90 to ensure that no psychiatric patients were included. After providing a complete explanation to the participants, all of them provided written informed consent. The study was approved by the ethics committee of Second Xiangya Hospital of Central South University.
The VFT was selected to measure changes in oxygenated hemoglobin (HbO) and deoxygenated hemoglobin (HbR) during a cognitive activation task. Previous reports showed measurable PF activation during the task[24-26]. A semantic category version of the VFT was used in our study. The VFT task contains three blocks: vegetables, animals, and fruits. Each block was composed of three periods: A 30-second pretask period, 60-second task period, and 60-second post-task period. The participants were asked to verbally describe as many words as possible pertaining to a certain semantic category.
All subjects underwent 5-minute rs fNIRS measurements. The rs measurements were performed in a silent room to secure against any outside interference. After filling out all personal information and clinical scales, the subjects were instructed to sit in a comfortable chair and keep still with their eyes open. They were told to relax their mind, stay awake, and remain motionless as much as possible. During the measurements, all obvious head movements were recorded for data screening.
The 53 multichannel fNIRS instrument (BS-7000; Wuhan Znion Technology Co., Ltd., Wuhan, China) measures the concentration changes of hemoglobin in the PFC using two wavelengths (690 nm and 830 nm) of infrared light at a sampling rate of 100 Hz. The emitter and detector optodes were 3 cm apart. The cortical areas between each emitter and detector pair are known as a channel. Anatomically, channels corresponded to cortical regions 2-3 cm beneath the skin and scalp surface. Sixteen emitters and sixteen detectors constituted a total of 53 channels and were placed with reference to the 10-20 system (emitter 9 was located at Fpz)[27]. The 53-channel placement is shown in Figure 1.

To normalize the fNIRS channel, we applied a three-dimensional digitizer (NirMap; Wuhan Znion Technology Co., Ltd., Wuhan, China) to record the exact spatial coordinates of four reference points (Nz, Cz, AL, and RL) and 32 probes (16 emitters and 16 detectors). Then the 53 channels were converted to an estimated Montreal Neurological Institute space[28] by NIRS-SPM software[29]. Then, according to the Brodmanns’ area, each channel was projected to the cortical surface based on the maximum overlap probability. To analyze the different types of intrahemispheric and interhemispheric connectivities[10], we identified different 10 regions of interest (ROIs) in Figure 1.
For rs data, preprocessing was performed by Homer2, which is a MATLAB-based toolbox to analyze the fNIRS data[30]. The purpose of preprocessing was to convert raw optical intensity to concentration of HbO and HbR. The preprocessing steps were as follows. First, the raw optical intensity was converted to optical density. Second, motion artifact was detected and corrected by channel using a cubic spline interpolation, and the result was then subtracted from the original signal to obtain the denoised segment (for parameters, tMotion = 0.5 seconds, tMask = 3 seconds, SDthresh = 20, APMthresh = 5)[31]. Third, band-pass filtering with a range of 0.01 Hz to 0.1 Hz was used to remove baseline drift and physiological noise such as cardiac (0.5-2.5 Hz), respiratory (0.25-0.4 Hz), and Mayer waves (0.1 Hz) interference[32]. Then, according to modified Beer-Lambert law[33], changes in relative concentrations of HbO, HbR, and total hemoglobin concentration were calculated. Finally, although 5 minutes (300 seconds) of fNIRS data were collected, only 180 seconds of data were selected and subsequently analyzed for FC. Specifically, the first 20 seconds of data were removed for possible initial instability due to machine and subjects, and the last 100 seconds of data were removed for possible subjects’ mind status changes. In addition, before processing, the coefficient of variation values of the data were calculated for each channel to evaluate signal quality[34]. Twenty-five percent was the bad channel cut-off value; therefore, channels with coefficient of variation value greater than 25% was marked as a bad channel. For every subject, when the number of bad channels exceeded 20% of the total (8 channels, for 40 channels), the data were eliminated.
For activation task data, HbO and HbR changes were processed and analyzed using such methods[25,26]: Data preprocessing was performed by Homer2, which is a MATLAB-based toolbox used to analyze the fNIRS data[30]. The purpose of preprocessing was to convert raw optical intensity to the concentration of HbO and HbR. Then, first-order correction was used to exclude task-unrelated changes during the VFT. The pretask baseline was determined as the mean across the last 10 seconds of the pretask period, and the post-task baseline was determined as the mean across the last 5 seconds of the post-task period. Linear fitting was performed based on the data between the two baselines. Moving average methods were applied to remove short-term motion artifacts in the analyzed data (moving average window: 5 seconds). Moreover, a derived parameter, namely, integral value (IV), was calculated from these oxygenation variables. The IV effectively describes the total size of the hemodynamic response during the task period. The mathematical formula of the IV was as follows:
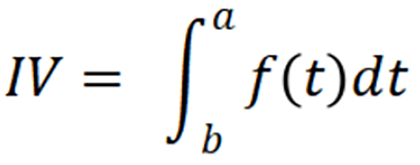
Where is the time point and f(t) is the HbO concentration at time t. The time range of IV calculation is the task period, that is 0-60 seconds after the start of the task, and only when f(t) is greater than 0, integral calculation was performed.
A MATLAB-based toolbox called NIRS-KIT[35] was used to calculate rsFC in this study. We analyzed and compared the rsFC between the COVID-19 history and HC group at four different levels. Only HbO signals were analyzed in this study since they have a better signal-to-noise ratio than HbR and are more sensitive to monitoring regional cerebral blood flow[36]. First, to obtain an overview of the rsFC of the COVID-19 history and HC group, correlations of channels’ pair were taken into consideration to represent the strength of rsFC, so a conventional method (Pearson correlation coefficient) was calculated in any possible channel pair. Second, all channel pairs were arranged according to the ROI (dorsolateral PFC-left [DLPFC-L], DLPFC-right (R), frontopolar area-L (FPA-L), FPA-R, Broca-L, Broca-R) to obtain an FC matrix, and four types of interests’ connectivity[10] were analyzed to compare the intrahemispheric and interhemispheric connectivity of the COVID-19 history and HC group. Third, to further characterize the topological properties of the brain network, we performed modern graph-theoretical analysis[37-39]. Lastly, correlations between rsFC and the scores of PHQ-9 and GAD-7 were calculated to explore the relationship between rsFC and clinical results.
To obtain the difference in rsFC strength between the COVID-19 history and HC group, the average FC matrix of the two groups was compared. Fisher’s r-z transformation was applied to convert the Pearson correlation coefficient r of each channel to the normally distributed variable z. To further analyze the intrahemispheric and interhemispheric connectivity, according to Zhu et al[10], we defined four types of connectivity: (1) Figure 2A: The Short-I (S1) for the intrahemispheric connectivity within each ROI (DLPFC-L to DLPFC-L, FPA-L to FPA-L, Broca-L to Broca-L, DLPFC-R to DLPFC-R, FPA-R to FPA-R, Broca-R to Broca-R); (2) Figure 2B: The Short-II (S2) for the intrahemispheric connectivity between different ROIs (DLPFC-L to FPA-L, DLPFC-L to Broca-L, FPA-L to Broca-L, DLPFC-R to FPA-R, DLPFC-R to Broca-R, FPA-R to Broca-R); (3) Figure 2C: The Long-I (L1) for the interhemispheric connectivity between symmetrical ROIs (DLPFC-L to DLPFC-R, FPA-L to FPA-R, Broca-L to Broca-R); and (4) Figure 2D: The Long-II (L2) for the interhemispheric connectivity between asymmetrical ROIs (DLPFC-L to FPA-R, DLPFC-L to Broca-R, FPA-L to Broca-R, FPA-L to DLPFC-R, Broca-L to DLPFC-R, Broca-L to FPA-R). All connections of channel pairs were classified as one of these four types.

In this part, the connection number was measured as the strength of rsFC. Based on the FC matrix, the channels were considered the “node” of the rsFC network, and the connection represented by correlation coefficient between any channel pairs was considered the “edge” of the rsFC network. Then the edge numbers were calculated as the connection number in the network. In addition, we set different thresholds of correlation coefficient to increase the robustness of the edge number results. Specifically, value T (means threshold) was defined to binarize the correlation matrix (0 or 1). Once the r value of a channel pair was smaller than T, there were no significant correlations and the edge number of 0 was calculated. By contrast, when the r value of a channel pair was larger than or equal to T value, there was a significant correlation and one edge number was calculated. T value was set at 0.4-0.9 and a step size of 0.05[10]. Next, total network edge numbers for the four types of connectivity (S1, S2, L1, L2) were calculated in different T values.
For modern graph-theoretical analysis[37-39], the metrics we used were global and local efficiency[40], and degree centrality[41]. The mathematical formulas of these metrics were as follows.
Global efficiency:
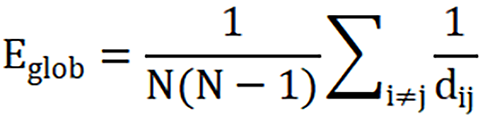
Where dij represents the shortest path length between node i and node j, and N represents the total number of nodes.
Local efficiency:
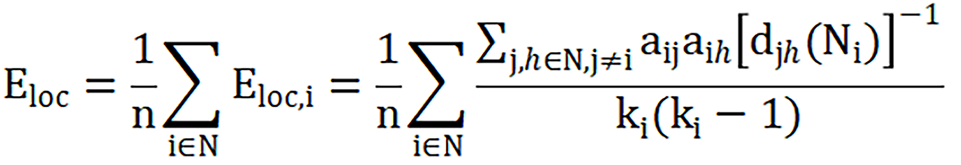
Where Eloc,i is the local efficiency of node i, djh(Ni) is the length of the shortest path between j and h, that contains only neighbors of i, and N represents the total number of nodes.
Degree centrality:
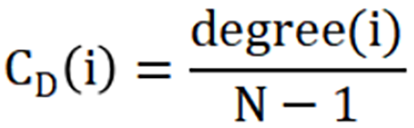
Where CD(i) is the degree centrality of node i, degree(i) is the degree of node i (the number of edges connected to node i), and N is the total number of nodes in the network.
In brief, the global efficiency reflects the average efficiency of information sharing in the entire network, representing the network integration. The local efficiency reflects the efficiency of information sharing in local network. The degree centrality reflects the importance of individual nodes and how these nodes interact, structurally or functionally with many other nodes in the network[42].
The S IV was calculated to measure the total change in HbO concentration during the VFT task, reflecting the individual’s activation intensity induced by the task. The IV was an effective indicator and was widely used in various VFT studies[15,43,44].
Correlations between fNIRS data and the scores of PHQ-9 and GAD-7 were performed in the COVID-19-infected group by partial correlation method with age and sex as covariates. Notably, not all indicators as previously mentioned were used to perform such correlation tests, since we only had an interest in those indicators that showed statistically significant differences between the COVID-19 history and HC groups.
Group comparison of the FC matrix after Fisher r-to-z transformation was performed using the two-sample t-test in NIRS KIT[35]. All other statistical analyses were performed with IBM SPSS version 26. Sex differences were statistically quantified by the χ2 test. The age and educational years between the two groups were assessed using the Student’s t-test. For rs indicators, the average FC matrix of the two groups was compared using the independent samples t-test, and statistical tests were corrected for multiple comparisons using Benjamini-Hochberg correction[43] to control the false discovery rate. For network indexes, including network edge number, global efficiency, local efficiency, and degree centrality, analysis of variance was used to compare groups’ differences at different thresholds of correlation. Specifically, one-way mixed models with repeated measurements were performed. In these models, the subject group (2 levels: Uninfected group and infected group) was between-subject factors and threshold (11 levels: 0.4-0.9, 0.05 as step size) was a repeated factor, network indexes were defined as the response variables, respectively. Also, the relationships between brain network measures (four types of connection edge number, global efficiency, local efficiency, and degree centrality) and clinical score (PHQ-9 and GAD-7) in the COVID-19-infected group were evaluated to further determine the long-term effects of COVID-19 on the brain network as well as validate the clinical values. The partial correlation between network metrics and clinical scores regarding sex and age as control variables was assessed. For task-induced activation (S IV), the independent samples t-test was performed, and the correlation between S IV and clinical score (PHQ-9 and GAD-7) was also assessed.
The uninfected group and infected group were comparable for age, sex, and years of education. There were no significant baseline differences between the two groups (P > 0.05) (Table 1).
Compared to the uninfected group, the infected group showed a significantly lower rsFC (Figure 3). Group statistical analyses showed that the connection edge number of the infected group was significantly decreased in S2, that is, the number of effective connections in different interest intervals within the hemisphere was less (Figure 4 and Table 2). To assess the differences in network topology characteristics, we used three indicators: including global efficiency, local efficiency, and degree centrality. The infected group was significantly lower in local efficiency and degree centrality in DLPFC-R than the HC group (Figure 5 and Table 3).


| Independent variables (FC type) | F value of between subject variable (group) | df | P value |
| S1 | 0.40 | 1, 56 | 0.528 |
| S2 | 4.28 | 1, 56 | 0.043a |
| L1 | 0.33 | 1, 56 | 0.569 |
| L2 | 2.88 | 1, 56 | 0.095 |
| Independent variables (network indicators) | ROI | F value of between subject variable (group) | df | P value |
| Global efficiency | - | 3.98 | 1, 56 | 0.051 |
| Local efficiency | Broca-L | 2.23 | 1, 56 | 0.141 |
| DLPFC-L | 3.33 | 1, 56 | 0.074 | |
| FPA-L | 3.37 | 1, 56 | 0.072 | |
| FPA-R | 2.59 | 1, 56 | 0.113 | |
| DLPFC-R | 6.02 | 1, 56 | 0.017a | |
| Broca-R | 1.94 | 1, 56 | 0.169 | |
| Degree centrality | Broca-L | 2.64 | 1, 56 | 0.110 |
| DLPFC-L | 1.95 | 1, 56 | 0.168 | |
| FPA-L | 2.24 | 1, 56 | 0.140 | |
| FPA-R | 1.99 | 1, 56 | 0.164 | |
| DLPFC-R | 5.37 | 1, 56 | 0.024a | |
| Broca-R | 1.62 | 1, 56 | 0.208 |
The number of S2 connectivity and the global efficiency were positively correlated with both PHQ-9 score and GAD-7 score in the infected group (Figure 6 and Table 4). The number of S2 was positively correlated with GAD-7 score at a marginal significance (P = 0.056).

The Figure 7 shows the blood oxygen waveform graphs during the task. Figure 7A shows the waveform graph for the uninfected group. Figure 7B shows the waveform graph for the infected group. Figure 7C shows the average blood oxygen waveform graph between two groups. Figure 8A shows the activation of HbO based on S IV (the size of neural activity during the task) in the healthy group when the P < 0.05 is in the range of -3 to 6. The darker the color, the significantly activated difference; the lighter the color, the more inhibited the activation of the corresponding channel. This figure shows significant activation in the PF lobe. Figure 8B shows the activation of HbO based on S IV (the size of neural activity during the task) in the brain of the COVID-19 group when the P value of the COVID-19 group was < 0.05. Channels 1, 21, 22, and 27 were activated significantly. Figure 8C shows the position corresponding to the significant difference of HbO S IV in brain activation during the VFT tasks between the healthy group and the COVID-19 group. Indicates that the activation of the corresponding channel is more inhibited. The figure shows that the S-IVs of the healthy group were significantly activated at channels 5, 14, 42, 49, 50, and 53, whereas the activation was inhibited at channel 38. Table 5 shows that the IV had a significant difference in both Broca-L and Broca-R between two groups (P < 0.05).


The PHQ-9 score showed a significant negative correlation with IV in the left DLPFC during the VFT (Table 6).
| ROI | PHQ-9 | GAD-7 | ||
| r value | P value | r value | P value | |
| Broca-L | -0.205 | 0.336 | 0.002 | 0.992 |
| DLPFC-L | -0.422a | 0.040 | -0.202 | 0.344 |
| FPA-L | -0.174 | 0.416 | 0.035 | 0.869 |
| FPA-R | -0.158 | 0.460 | 0.071 | 0.740 |
| DLPFC-R | -0.121 | 0.573 | -0.106 | 0.623 |
| Broca-R | -0.279 | 0.187 | -0.070 | 0.746 |
In the present work, we compared individuals with COVID-19 acute infection and those without a history of COVID-19 infection using rs and task-based fNIRS. For our subjects in the acute phase of infection, where respiratory symptoms coincide with changes in brain function, and no other external factors (the stressors we mentioned above) are present, we can assume that COVID-19 infection does affect brain function directly. These effects manifest in three aspects.
First, there was an impact on brain FC. Looking at the affected brain regions, the main reduction in connectivity occurred within the hemisphere of interest (S2), specifically in the DLPFC-R. From the indicators, both the local efficiency and degree centrality of the DLPFC-R showed a decrease, which represented a decline in information transmission efficiency and information processing ability, respectively. In general, COVID-19 infection caused abnormal rsFC and disrupted topological properties in the right DLPF brain network, and these network abnormalities may be associated with cognitive impairment[45], which is also known as “brain fog”.
Second, there was a decrease in brain activation during cognitive task execution. Decreased task-evoked activity in the Broca-L and Broca-R was observed during the VFT in the infected group. This finding reflected the involvement of executive functions rather than pure language production, which would more likely have resulted in a difference in unilateral (i.e. left hemispheric) activation[46]. That is to say, COVID-19 infection damages the bilateral Broca’s area and thus affects not only language function but also the executive function of infected people.
Third, there was a correlation with mood symptoms. During the rs, we found that the number of S2 connectivity and the global efficiency were positively correlated with both PHQ score and GAD score in the infected group. There are many studies on the different brain activation patterns of patients with depression or anxiety and healthy people by fNIRS technology, but the results are quite different. Some studies have found that right PF lobe dysfunction is key to the onset of depression[47], whereas others believe that the left lateral PFC plays a key role in the development of depression[48]. Some researchers measured the spontaneous oscillation of hemodynamic changes in the PFC of HCs, and the results revealed that participants with higher anxiety levels showed more right-dominant activities at the rs[15]. However, most studies have shown that patients with depression have significantly lower HbO compared to healthy individuals while higher HbO in anxiety[26,44,49]. Our results seem to contradict previous conclusions. However, Wu et al[50] found differences in cerebral hemodynamics among anxious depression, non-anxious depression, and healthy groups; that is, hemodynamic activation in the right DLPFC was significantly higher in the anxious depression group than in the non-anxious depression and healthy groups. This conclusion explains our results well, for most subjects infected with COVID-19 in our study had anxious depression rather than non-anxious depression.
Interestingly, during the VFT, a negative correlation was found in the infected group between depression severity and DLPFC-L activation, while no correlation was observed between the anxiety severity and the activation. Wen et al[51] found that characteristic markers of major depression (MD) and A&D are quite different; that is, MD is associated with the deficient activation in brain oxygenation, while A&D is characterized by the intermediate peak in spontaneous low-frequency oscillations. Therefore, we cannot simply measure the correlation between cortical activation and anxiety or depression among patients with A&D. Besides, the VFT only covers limited executive functions, which are not enough to distinguish different symptoms. By contrast, a high-level cognition (HCT) task can better reflect the function of the cerebral cortex (the possible reason is that the HCT is more challenging and would trigger a comprehensive response of human cognitive capacity). This suggests that a HCT task can be used in the future for the study of task-based fNIRS[18].
However, regardless of the rs or task state, we found differences in DLPFC between infected and uninfected groups and its correlation with A&D symptoms, which is the key brain region in affective disorders. That is to say, our study provides a kind of evidence that the psychological and emotional issues brought about by COVID-19 are not only due to external social factors but also involve more direct brain neural mechanisms and abnormal neural circuits.
This study had some limitations. One of the most important points is the heterogeneity of infection in the infected group, including the severity and timing of infection. In our original conception, there were differences among the emotional state and cognitive performance of patients when they were at different stages of infection or varying degrees of severity. Therefore, we conducted a preliminary analysis during the preprocessing phase of the data but found no significant differences in the data grouped by the timing or severity of the infection. The possible reason is, among the participants we recruited, patients in the early stages of infection or acute infection show severe symptoms, while those with longer infection durations experience prolonged recovery. From this perspective, both types of patients are equally severe. This is very interesting, but further research is needed to confirm. Future studies can rigorously control for the severity or stage of infection, increase sample size, and explore the different correlations between COVID-19 infections and emotions, cognition, and brain function.
Another point is, the limited sample size of the study, comprising only 29 patients with initial infections and a matched control group of 29 healthy individuals, can be attributed to the stringent inclusion criteria established to exclude the confounding effects of recurrent or chronic infections. As the first-time infection patients exhibited significant symptoms, such as respiratory failure and high fever, some individuals were unable to endure cognitive and scale assessments. Although the patients included in the study could tolerate these evaluations, common symptoms of COVID-19, like coughing, posed challenges to data collection, particularly during tasks requiring sustained verbal output. While near-infrared brain function imaging minimizes motion artifacts compared to other imaging modalities, some concerns persist regarding the potential for data inaccuracies due to severe head movement. Overall, under these challenges, excluding seven participants due to poor data quality is a good result. Nevertheless, in future studies, for COVID-19 patients, it is still necessary to explore some assessment paradigms that are simple and not affected by their physical factors.
Overall, we conducted fNIRS of both the rs and task state in patients with acute infection of COVID-19. These two states confirmed each other and showed that COVID-19 infection affected bilateral Broca area and DLPFC, thus affecting language and cognitive function, while causing psychiatric symptoms. This provides insights for the future diagnosis, treatment, and prognosis of individuals with COVID-19. It suggests that in addition to monitoring respiratory symptoms, close attention should be given to the neurological, psychological symptoms, and cognitive functions of patients. Even if abnormalities are not currently evident, there is a possibility of them emerging in the future. Therefore, preventive measures and early intervention should be implemented concurrently to address potential issues proactively.
We sincerely thank all patients and healthy subjects for their valuable participation.
| 1. | COVID-19 Mental Disorders Collaborators. Global prevalence and burden of depressive and anxiety disorders in 204 countries and territories in 2020 due to the COVID-19 pandemic. Lancet. 2021;398:1700-1712. [RCA] [PubMed] [DOI] [Full Text] [Full Text (PDF)] [Cited by in Crossref: 2518] [Cited by in RCA: 2698] [Article Influence: 674.5] [Reference Citation Analysis (0)] |
| 2. | Machlin L, McLaughlin KA. Pre-pandemic brain structure and function and adolescent psychopathology during the COVID-19 pandemic. Curr Opin Psychol. 2023;52:101647. [RCA] [PubMed] [DOI] [Full Text] [Cited by in Crossref: 1] [Cited by in RCA: 1] [Article Influence: 0.5] [Reference Citation Analysis (0)] |
| 3. | Mazza MG, Palladini M, De Lorenzo R, Magnaghi C, Poletti S, Furlan R, Ciceri F; COVID-19 BioB Outpatient Clinic Study group, Rovere-Querini P, Benedetti F. Persistent psychopathology and neurocognitive impairment in COVID-19 survivors: Effect of inflammatory biomarkers at three-month follow-up. Brain Behav Immun. 2021;94:138-147. [RCA] [PubMed] [DOI] [Full Text] [Full Text (PDF)] [Cited by in Crossref: 157] [Cited by in RCA: 330] [Article Influence: 82.5] [Reference Citation Analysis (0)] |
| 4. | da Silva Lopes L, Silva RO, de Sousa Lima G, de Araújo Costa AC, Barros DF, Silva-Néto RP. Is there a common pathophysiological mechanism between COVID-19 and depression? Acta Neurol Belg. 2021;121:1117-1122. [RCA] [PubMed] [DOI] [Full Text] [Full Text (PDF)] [Cited by in Crossref: 6] [Cited by in RCA: 23] [Article Influence: 5.8] [Reference Citation Analysis (0)] |
| 5. | Tate W, Walker M, Sweetman E, Helliwell A, Peppercorn K, Edgar C, Blair A, Chatterjee A. Molecular Mechanisms of Neuroinflammation in ME/CFS and Long COVID to Sustain Disease and Promote Relapses. Front Neurol. 2022;13:877772. [RCA] [PubMed] [DOI] [Full Text] [Full Text (PDF)] [Cited by in Crossref: 28] [Cited by in RCA: 61] [Article Influence: 20.3] [Reference Citation Analysis (0)] |
| 6. | Zazzara MB, Bellieni A, Calvani R, Coelho-Junior HJ, Picca A, Marzetti E. Inflammaging at the Time of COVID-19. Clin Geriatr Med. 2022;38:473-481. [RCA] [PubMed] [DOI] [Full Text] [Full Text (PDF)] [Cited by in RCA: 16] [Reference Citation Analysis (0)] |
| 7. | Pinti P, Tachtsidis I, Hamilton A, Hirsch J, Aichelburg C, Gilbert S, Burgess PW. The present and future use of functional near-infrared spectroscopy (fNIRS) for cognitive neuroscience. Ann N Y Acad Sci. 2020;1464:5-29. [RCA] [PubMed] [DOI] [Full Text] [Full Text (PDF)] [Cited by in Crossref: 468] [Cited by in RCA: 577] [Article Influence: 115.4] [Reference Citation Analysis (0)] |
| 8. | Quan W, Wu T, Li Z, Wang Y, Dong W, Lv B. Reduced prefrontal activation during a verbal fluency task in Chinese-speaking patients with schizophrenia as measured by near-infrared spectroscopy. Prog Neuropsychopharmacol Biol Psychiatry. 2015;58:51-58. [RCA] [PubMed] [DOI] [Full Text] [Cited by in Crossref: 35] [Cited by in RCA: 46] [Article Influence: 4.6] [Reference Citation Analysis (0)] |
| 9. | Zhao J, Liu J, Jiang X, Zhou G, Chen G, Ding XP, Fu G, Lee K. Linking Resting-State Networks in the Prefrontal Cortex to Executive Function: A Functional Near Infrared Spectroscopy Study. Front Neurosci. 2016;10:452. [RCA] [PubMed] [DOI] [Full Text] [Full Text (PDF)] [Cited by in Crossref: 19] [Cited by in RCA: 21] [Article Influence: 2.3] [Reference Citation Analysis (0)] |
| 10. | Zhu H, Xu J, Li J, Peng H, Cai T, Li X, Wu S, Cao W, He S. Decreased functional connectivity and disrupted neural network in the prefrontal cortex of affective disorders: A resting-state fNIRS study. J Affect Disord. 2017;221:132-144. [RCA] [PubMed] [DOI] [Full Text] [Cited by in Crossref: 46] [Cited by in RCA: 51] [Article Influence: 6.4] [Reference Citation Analysis (0)] |
| 11. | Fox MD, Raichle ME. Spontaneous fluctuations in brain activity observed with functional magnetic resonance imaging. Nat Rev Neurosci. 2007;8:700-711. [RCA] [PubMed] [DOI] [Full Text] [Cited by in Crossref: 4711] [Cited by in RCA: 4996] [Article Influence: 277.6] [Reference Citation Analysis (0)] |
| 12. | Uhlhaas PJ, Singer W. Neural synchrony in brain disorders: relevance for cognitive dysfunctions and pathophysiology. Neuron. 2006;52:155-168. [RCA] [PubMed] [DOI] [Full Text] [Cited by in Crossref: 1424] [Cited by in RCA: 1344] [Article Influence: 70.7] [Reference Citation Analysis (0)] |
| 13. | Anand A, Li Y, Wang Y, Lowe MJ, Dzemidzic M. Resting state corticolimbic connectivity abnormalities in unmedicated bipolar disorder and unipolar depression. Psychiatry Res. 2009;171:189-198. [RCA] [PubMed] [DOI] [Full Text] [Full Text (PDF)] [Cited by in Crossref: 293] [Cited by in RCA: 276] [Article Influence: 17.3] [Reference Citation Analysis (0)] |
| 14. | Sheline YI, Price JL, Yan Z, Mintun MA. Resting-state functional MRI in depression unmasks increased connectivity between networks via the dorsal nexus. Proc Natl Acad Sci U S A. 2010;107:11020-11025. [RCA] [PubMed] [DOI] [Full Text] [Cited by in Crossref: 813] [Cited by in RCA: 883] [Article Influence: 58.9] [Reference Citation Analysis (0)] |
| 15. | Ishikawa W, Sato M, Fukuda Y, Matsumoto T, Takemura N, Sakatani K. Correlation between asymmetry of spontaneous oscillation of hemodynamic changes in the prefrontal cortex and anxiety levels: a near-infrared spectroscopy study. J Biomed Opt. 2014;19:027005. [RCA] [PubMed] [DOI] [Full Text] [Cited by in Crossref: 35] [Cited by in RCA: 45] [Article Influence: 4.1] [Reference Citation Analysis (0)] |
| 16. | Rosenbaum D, Hagen K, Deppermann S, Kroczek AM, Haeussinger FB, Heinzel S, Berg D, Fallgatter AJ, Metzger FG, Ehlis AC; TREND Study Consortium. State-dependent altered connectivity in late-life depression: a functional near-infrared spectroscopy study. Neurobiol Aging. 2016;39:57-68. [RCA] [PubMed] [DOI] [Full Text] [Cited by in Crossref: 33] [Cited by in RCA: 37] [Article Influence: 4.1] [Reference Citation Analysis (0)] |
| 17. | Glover GH. Overview of functional magnetic resonance imaging. Neurosurg Clin N Am. 2011;22:133-139, vii. [RCA] [PubMed] [DOI] [Full Text] [Full Text (PDF)] [Cited by in Crossref: 683] [Cited by in RCA: 493] [Article Influence: 35.2] [Reference Citation Analysis (0)] |
| 18. | Lang X, Wen D, Li Q, Yin Q, Wang M, Xu Y. fNIRS Evaluation of Frontal and Temporal Cortex Activation by Verbal Fluency Task and High-Level Cognition Task for Detecting Anxiety and Depression. Front Psychiatry. 2021;12:690121. [RCA] [PubMed] [DOI] [Full Text] [Full Text (PDF)] [Cited by in Crossref: 5] [Cited by in RCA: 14] [Article Influence: 3.5] [Reference Citation Analysis (0)] |
| 19. | Yeung MK, Lin J. Probing depression, schizophrenia, and other psychiatric disorders using fNIRS and the verbal fluency test: A systematic review and meta-analysis. J Psychiatr Res. 2021;140:416-435. [RCA] [PubMed] [DOI] [Full Text] [Cited by in Crossref: 20] [Cited by in RCA: 68] [Article Influence: 17.0] [Reference Citation Analysis (0)] |
| 20. | Yeung MK, Chan AS. Functional near-infrared spectroscopy reveals decreased resting oxygenation levels and task-related oxygenation changes in mild cognitive impairment and dementia: A systematic review. J Psychiatr Res. 2020;124:58-76. [RCA] [PubMed] [DOI] [Full Text] [Cited by in Crossref: 70] [Cited by in RCA: 60] [Article Influence: 12.0] [Reference Citation Analysis (0)] |
| 21. | Wei Y, Chen Q, Curtin A, Tu L, Tang X, Tang Y, Xu L, Qian Z, Zhou J, Zhu C, Zhang T, Wang J. Functional near-infrared spectroscopy (fNIRS) as a tool to assist the diagnosis of major psychiatric disorders in a Chinese population. Eur Arch Psychiatry Clin Neurosci. 2021;271:745-757. [RCA] [PubMed] [DOI] [Full Text] [Cited by in Crossref: 14] [Cited by in RCA: 40] [Article Influence: 10.0] [Reference Citation Analysis (0)] |
| 22. | Kroenke K, Spitzer RL, Williams JB. The PHQ-9: validity of a brief depression severity measure. J Gen Intern Med. 2001;16:606-613. [RCA] [PubMed] [DOI] [Full Text] [Cited by in Crossref: 21545] [Cited by in RCA: 28894] [Article Influence: 1203.9] [Reference Citation Analysis (0)] |
| 23. | Spitzer RL, Kroenke K, Williams JB, Löwe B. A brief measure for assessing generalized anxiety disorder: the GAD-7. Arch Intern Med. 2006;166:1092-1097. [RCA] [PubMed] [DOI] [Full Text] [Cited by in Crossref: 11947] [Cited by in RCA: 18835] [Article Influence: 991.3] [Reference Citation Analysis (0)] |
| 24. | Herrmann MJ, Ehlis AC, Fallgatter AJ. Frontal activation during a verbal-fluency task as measured by near-infrared spectroscopy. Brain Res Bull. 2003;61:51-56. [RCA] [PubMed] [DOI] [Full Text] [Cited by in Crossref: 146] [Cited by in RCA: 131] [Article Influence: 6.0] [Reference Citation Analysis (0)] |
| 25. | Takizawa R, Kasai K, Kawakubo Y, Marumo K, Kawasaki S, Yamasue H, Fukuda M. Reduced frontopolar activation during verbal fluency task in schizophrenia: a multi-channel near-infrared spectroscopy study. Schizophr Res. 2008;99:250-262. [RCA] [PubMed] [DOI] [Full Text] [Cited by in Crossref: 229] [Cited by in RCA: 238] [Article Influence: 14.0] [Reference Citation Analysis (0)] |
| 26. | Takizawa R, Fukuda M, Kawasaki S, Kasai K, Mimura M, Pu S, Noda T, Niwa S, Okazaki Y; Joint Project for Psychiatric Application of Near-Infrared Spectroscopy (JPSY-NIRS) Group. Neuroimaging-aided differential diagnosis of the depressive state. Neuroimage. 2014;85 Pt 1:498-507. [RCA] [PubMed] [DOI] [Full Text] [Cited by in Crossref: 176] [Cited by in RCA: 220] [Article Influence: 20.0] [Reference Citation Analysis (0)] |
| 27. | Xiao X, Zhu H, Liu WJ, Yu XT, Duan L, Li Z, Zhu CZ. Semi-automatic 10/20 Identification Method for MRI-Free Probe Placement in Transcranial Brain Mapping Techniques. Front Neurosci. 2017;11:4. [RCA] [PubMed] [DOI] [Full Text] [Full Text (PDF)] [Cited by in Crossref: 22] [Cited by in RCA: 22] [Article Influence: 2.8] [Reference Citation Analysis (0)] |
| 28. | Singh AK, Okamoto M, Dan H, Jurcak V, Dan I. Spatial registration of multichannel multi-subject fNIRS data to MNI space without MRI. Neuroimage. 2005;27:842-851. [RCA] [PubMed] [DOI] [Full Text] [Cited by in Crossref: 430] [Cited by in RCA: 515] [Article Influence: 25.8] [Reference Citation Analysis (0)] |
| 29. | Ye JC, Tak S, Jang KE, Jung J, Jang J. NIRS-SPM: statistical parametric mapping for near-infrared spectroscopy. Neuroimage. 2009;44:428-447. [RCA] [PubMed] [DOI] [Full Text] [Cited by in Crossref: 667] [Cited by in RCA: 771] [Article Influence: 45.4] [Reference Citation Analysis (0)] |
| 30. | Huppert TJ, Diamond SG, Franceschini MA, Boas DA. HomER: a review of time-series analysis methods for near-infrared spectroscopy of the brain. Appl Opt. 2009;48:D280-D298. [RCA] [PubMed] [DOI] [Full Text] [Full Text (PDF)] [Cited by in Crossref: 1312] [Cited by in RCA: 1091] [Article Influence: 68.2] [Reference Citation Analysis (0)] |
| 31. | Scholkmann F, Spichtig S, Muehlemann T, Wolf M. How to detect and reduce movement artifacts in near-infrared imaging using moving standard deviation and spline interpolation. Physiol Meas. 2010;31:649-662. [RCA] [PubMed] [DOI] [Full Text] [Cited by in Crossref: 330] [Cited by in RCA: 429] [Article Influence: 28.6] [Reference Citation Analysis (0)] |
| 32. | Santosa H, Hong MJ, Kim SP, Hong KS. Noise reduction in functional near-infrared spectroscopy signals by independent component analysis. Rev Sci Instrum. 2013;84:073106. [RCA] [PubMed] [DOI] [Full Text] [Cited by in Crossref: 134] [Cited by in RCA: 83] [Article Influence: 6.9] [Reference Citation Analysis (0)] |
| 33. | Sakatani K, Yamashita D, Yamanaka T, Oda M, Yamashita Y, Hoshino T, Fujiwara N, Murata Y, Katayama Y. Changes of cerebral blood oxygenation and optical pathlength during activation and deactivation in the prefrontal cortex measured by time-resolved near infrared spectroscopy. Life Sci. 2006;78:2734-2741. [RCA] [PubMed] [DOI] [Full Text] [Cited by in Crossref: 42] [Cited by in RCA: 50] [Article Influence: 2.6] [Reference Citation Analysis (0)] |
| 34. | Piper SK, Krueger A, Koch SP, Mehnert J, Habermehl C, Steinbrink J, Obrig H, Schmitz CH. A wearable multi-channel fNIRS system for brain imaging in freely moving subjects. Neuroimage. 2014;85 Pt 1:64-71. [RCA] [PubMed] [DOI] [Full Text] [Cited by in Crossref: 227] [Cited by in RCA: 264] [Article Influence: 22.0] [Reference Citation Analysis (0)] |
| 35. | Hou X, Zhang Z, Zhao C, Duan L, Gong Y, Li Z, Zhu C. NIRS-KIT: a MATLAB toolbox for both resting-state and task fNIRS data analysis. Neurophotonics. 2021;8:010802. [RCA] [PubMed] [DOI] [Full Text] [Full Text (PDF)] [Cited by in Crossref: 72] [Cited by in RCA: 134] [Article Influence: 33.5] [Reference Citation Analysis (0)] |
| 36. | Fu G, Mondloch CJ, Ding XP, A Short L, Sun L, Lee K. The neural correlates of the face attractiveness aftereffect: a functional near-infrared spectroscopy (fNIRS) study. Neuroimage. 2014;85 Pt 1:363-371. [RCA] [PubMed] [DOI] [Full Text] [Cited by in Crossref: 13] [Cited by in RCA: 26] [Article Influence: 2.2] [Reference Citation Analysis (0)] |
| 37. | Zhang HY, Wang SJ, Xing J, Liu B, Ma ZL, Yang M, Zhang ZJ, Teng GJ. Detection of PCC functional connectivity characteristics in resting-state fMRI in mild Alzheimer's disease. Behav Brain Res. 2009;197:103-108. [RCA] [PubMed] [DOI] [Full Text] [Cited by in Crossref: 179] [Cited by in RCA: 191] [Article Influence: 11.9] [Reference Citation Analysis (0)] |
| 38. | Niu H, Wang J, Zhao T, Shu N, He Y. Revealing topological organization of human brain functional networks with resting-state functional near infrared spectroscopy. PLoS One. 2012;7:e45771. [RCA] [PubMed] [DOI] [Full Text] [Full Text (PDF)] [Cited by in Crossref: 76] [Cited by in RCA: 78] [Article Influence: 6.0] [Reference Citation Analysis (0)] |
| 39. | Niu H, He Y. Resting-state functional brain connectivity: lessons from functional near-infrared spectroscopy. Neuroscientist. 2014;20:173-188. [RCA] [PubMed] [DOI] [Full Text] [Cited by in Crossref: 57] [Cited by in RCA: 63] [Article Influence: 5.3] [Reference Citation Analysis (0)] |
| 40. | Latora V, Marchiori M. Efficient behavior of small-world networks. Phys Rev Lett. 2001;87:198701. [RCA] [PubMed] [DOI] [Full Text] [Cited by in Crossref: 3311] [Cited by in RCA: 2372] [Article Influence: 98.8] [Reference Citation Analysis (0)] |
| 41. | Guimerà R, Amaral LA. Cartography of complex networks: modules and universal roles. J Stat Mech. 2005;2005:nihpa35573. [RCA] [PubMed] [DOI] [Full Text] [Full Text (PDF)] [Cited by in Crossref: 445] [Cited by in RCA: 334] [Article Influence: 16.7] [Reference Citation Analysis (0)] |
| 42. | Rubinov M, Sporns O. Complex network measures of brain connectivity: uses and interpretations. Neuroimage. 2010;52:1059-1069. [RCA] [PubMed] [DOI] [Full Text] [Cited by in Crossref: 6976] [Cited by in RCA: 7444] [Article Influence: 465.3] [Reference Citation Analysis (0)] |
| 43. | Benjamini Y, Hochberg Y. Controlling the False Discovery Rate: A Practical and Powerful Approach to Multiple Testing. J R Stat Soc Series B: Stat Methodol. 1995;57:289-300. [DOI] [Full Text] |
| 44. | Suto T, Fukuda M, Ito M, Uehara T, Mikuni M. Multichannel near-infrared spectroscopy in depression and schizophrenia: cognitive brain activation study. Biol Psychiatry. 2004;55:501-511. [RCA] [PubMed] [DOI] [Full Text] [Cited by in Crossref: 334] [Cited by in RCA: 307] [Article Influence: 14.6] [Reference Citation Analysis (0)] |
| 45. | Ceban F, Ling S, Lui LMW, Lee Y, Gill H, Teopiz KM, Rodrigues NB, Subramaniapillai M, Di Vincenzo JD, Cao B, Lin K, Mansur RB, Ho RC, Rosenblat JD, Miskowiak KW, Vinberg M, Maletic V, McIntyre RS. Fatigue and cognitive impairment in Post-COVID-19 Syndrome: A systematic review and meta-analysis. Brain Behav Immun. 2022;101:93-135. [RCA] [PubMed] [DOI] [Full Text] [Full Text (PDF)] [Cited by in Crossref: 841] [Cited by in RCA: 885] [Article Influence: 295.0] [Reference Citation Analysis (0)] |
| 46. | Metzger FG, Ehlis AC, Haeussinger FB, Schneeweiss P, Hudak J, Fallgatter AJ, Schneider S. Functional brain imaging of walking while talking - An fNIRS study. Neuroscience. 2017;343:85-93. [RCA] [PubMed] [DOI] [Full Text] [Cited by in Crossref: 43] [Cited by in RCA: 51] [Article Influence: 5.7] [Reference Citation Analysis (0)] |
| 47. | Tsujii N, Mikawa W, Adachi T, Sakanaka S, Shirakawa O. Right prefrontal function and coping strategies in patients with remitted major depressive disorder. Prog Neuropsychopharmacol Biol Psychiatry. 2021;108:110085. [RCA] [PubMed] [DOI] [Full Text] [Cited by in Crossref: 1] [Cited by in RCA: 9] [Article Influence: 2.3] [Reference Citation Analysis (0)] |
| 48. | Akiyama T, Koeda M, Okubo Y, Kimura M. Hypofunction of left dorsolateral prefrontal cortex in depression during verbal fluency task: A multi-channel near-infrared spectroscopy study. J Affect Disord. 2018;231:83-90. [RCA] [PubMed] [DOI] [Full Text] [Cited by in Crossref: 39] [Cited by in RCA: 58] [Article Influence: 8.3] [Reference Citation Analysis (0)] |
| 49. | Kameyama M, Fukuda M, Yamagishi Y, Sato T, Uehara T, Ito M, Suto T, Mikuni M. Frontal lobe function in bipolar disorder: a multichannel near-infrared spectroscopy study. Neuroimage. 2006;29:172-184. [RCA] [PubMed] [DOI] [Full Text] [Cited by in Crossref: 201] [Cited by in RCA: 205] [Article Influence: 10.8] [Reference Citation Analysis (0)] |
| 50. | Wu H, Li T, Peng C, Yang C, Bian Y, Li X, Xiao Q, Wang P, Zhang Z, Zhang Y. The right prefrontal cortex (PFC) can distinguish anxious depression from non-anxious depression: A promising functional near infrared spectroscopy study (fNIRS). J Affect Disord. 2022;317:319-328. [RCA] [PubMed] [DOI] [Full Text] [Cited by in RCA: 13] [Reference Citation Analysis (0)] |
| 51. | Wen D, Lang X, Zhang H, Li Q, Yin Q, Chen Y, Xu Y. Task and Non-task Brain Activation Differences for Assessment of Depression and Anxiety by fNIRS. Front Psychiatry. 2021;12:758092. [RCA] [PubMed] [DOI] [Full Text] [Full Text (PDF)] [Cited by in Crossref: 1] [Cited by in RCA: 7] [Article Influence: 1.8] [Reference Citation Analysis (0)] |